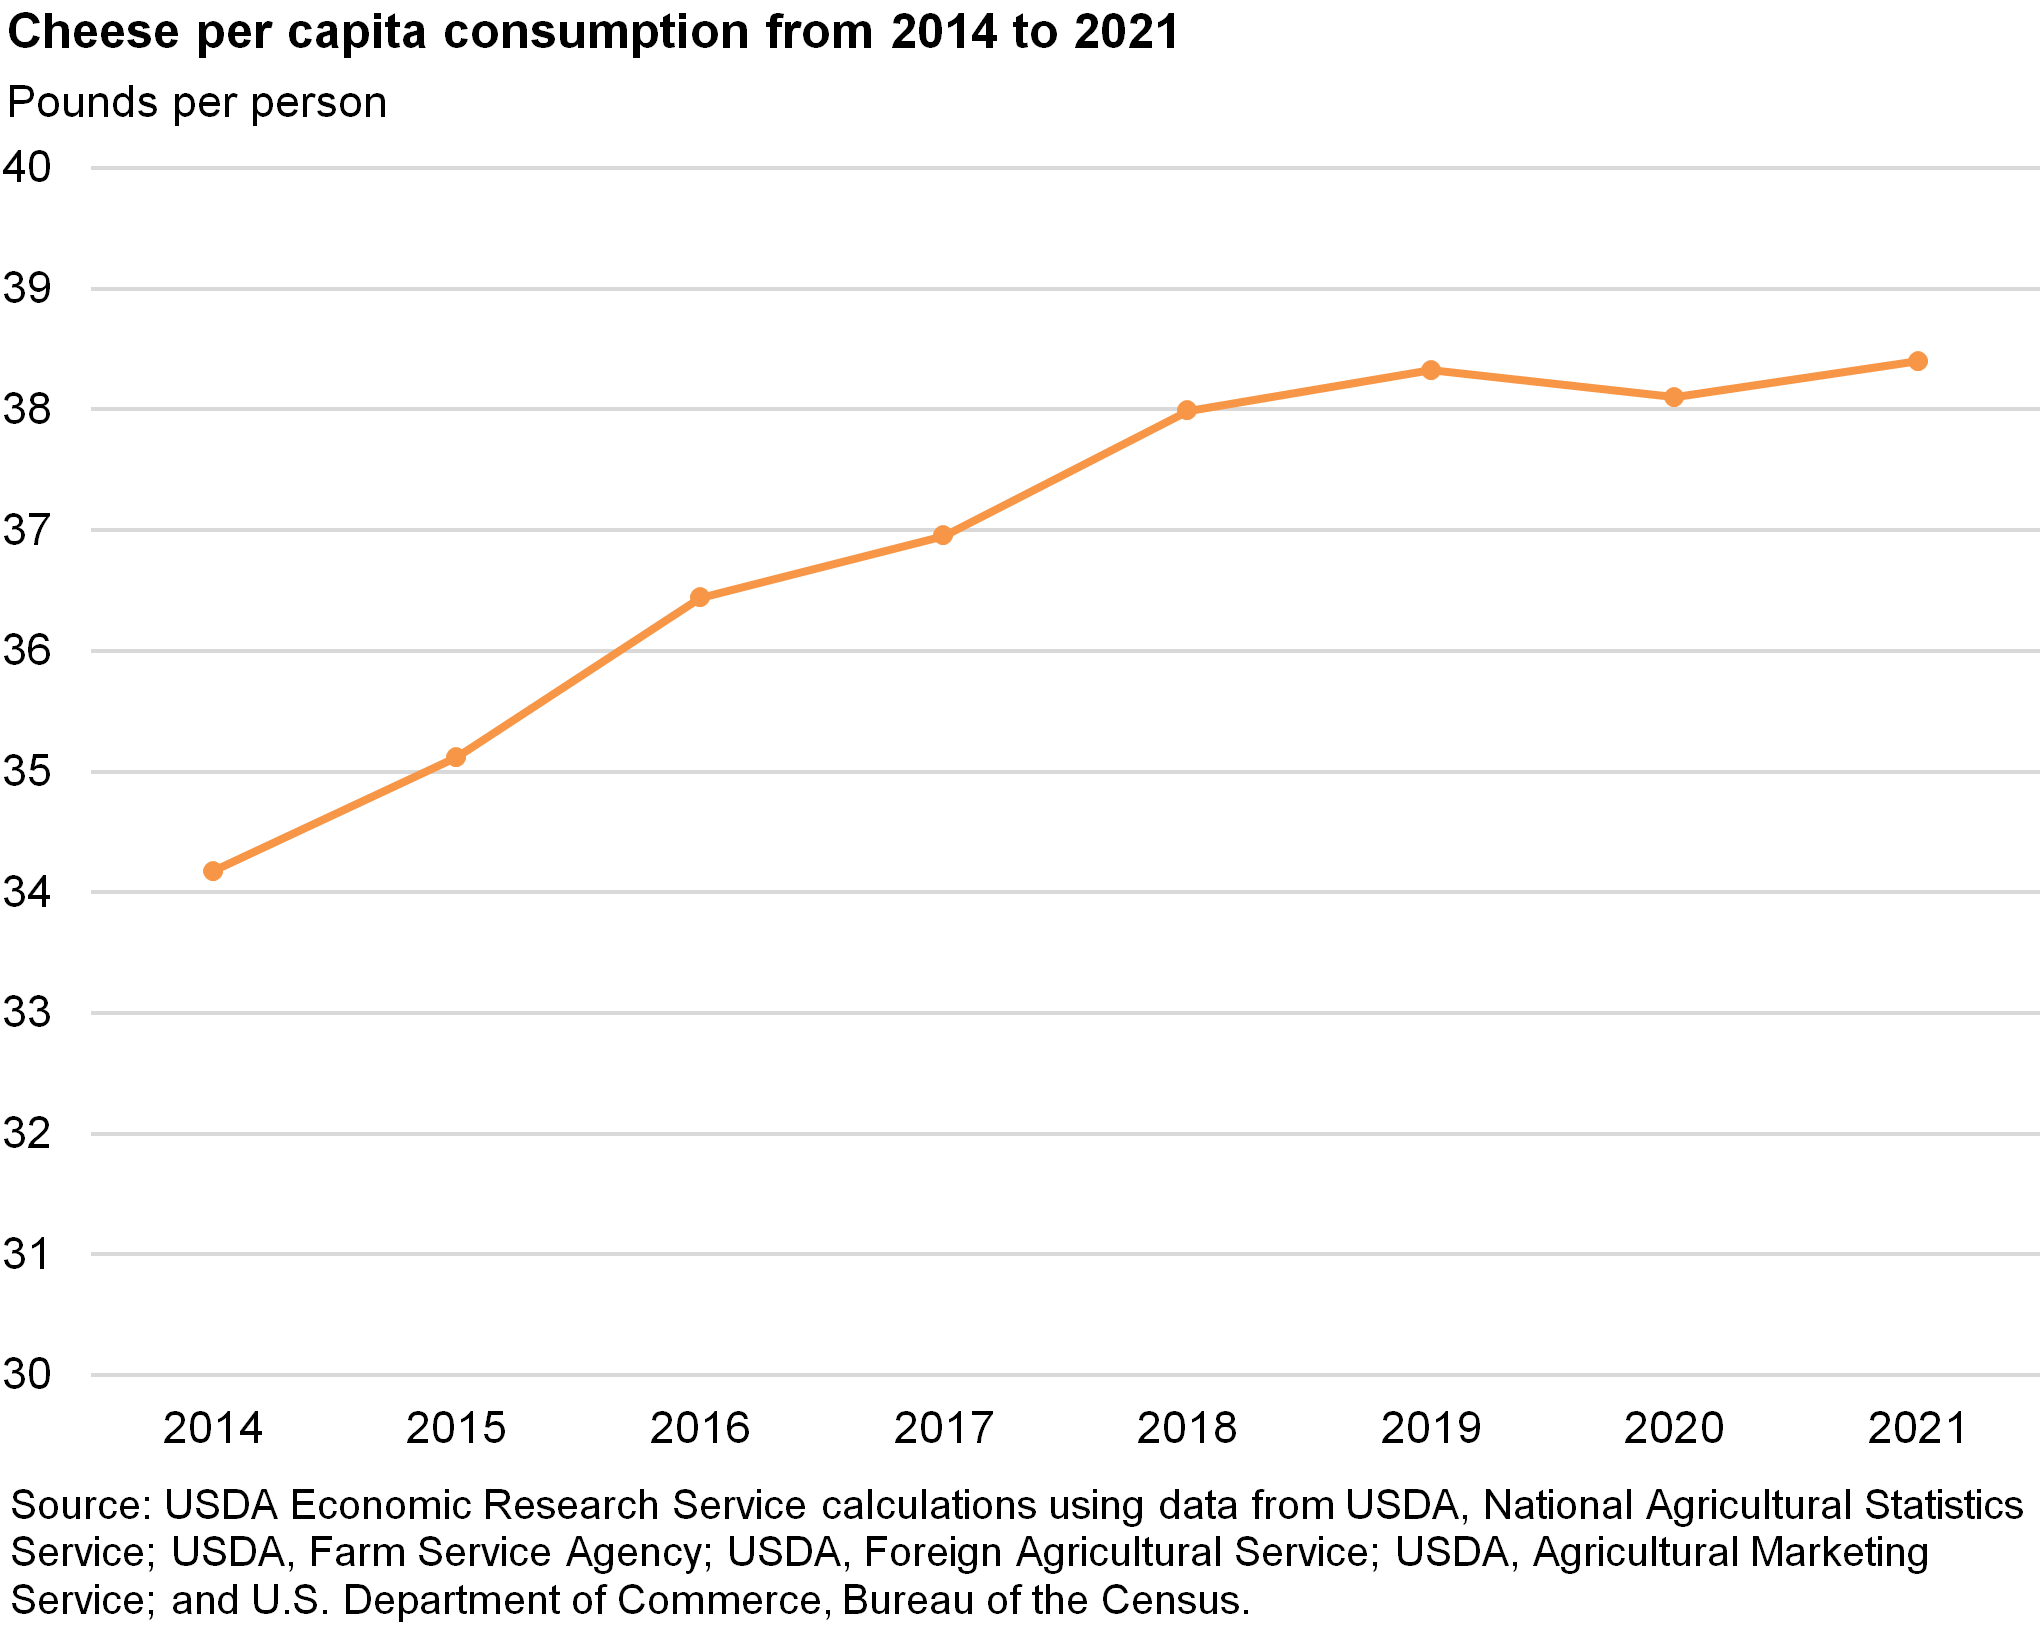
Cheese per capita consumption from 2014 to 2021
- by Angel Terán
- 4/27/2023
Official websites use .gov
A .gov website belongs to an official government organization in the United States.
Secure .gov websites use HTTPS
A lock (
) or https:// means you’ve safely connected to the .gov website. Share sensitive information only on official, secure websites.