
Cheese and yogurt popularity grew over last four decades
- by Andrzej Blazejczyk
- 2/9/2023
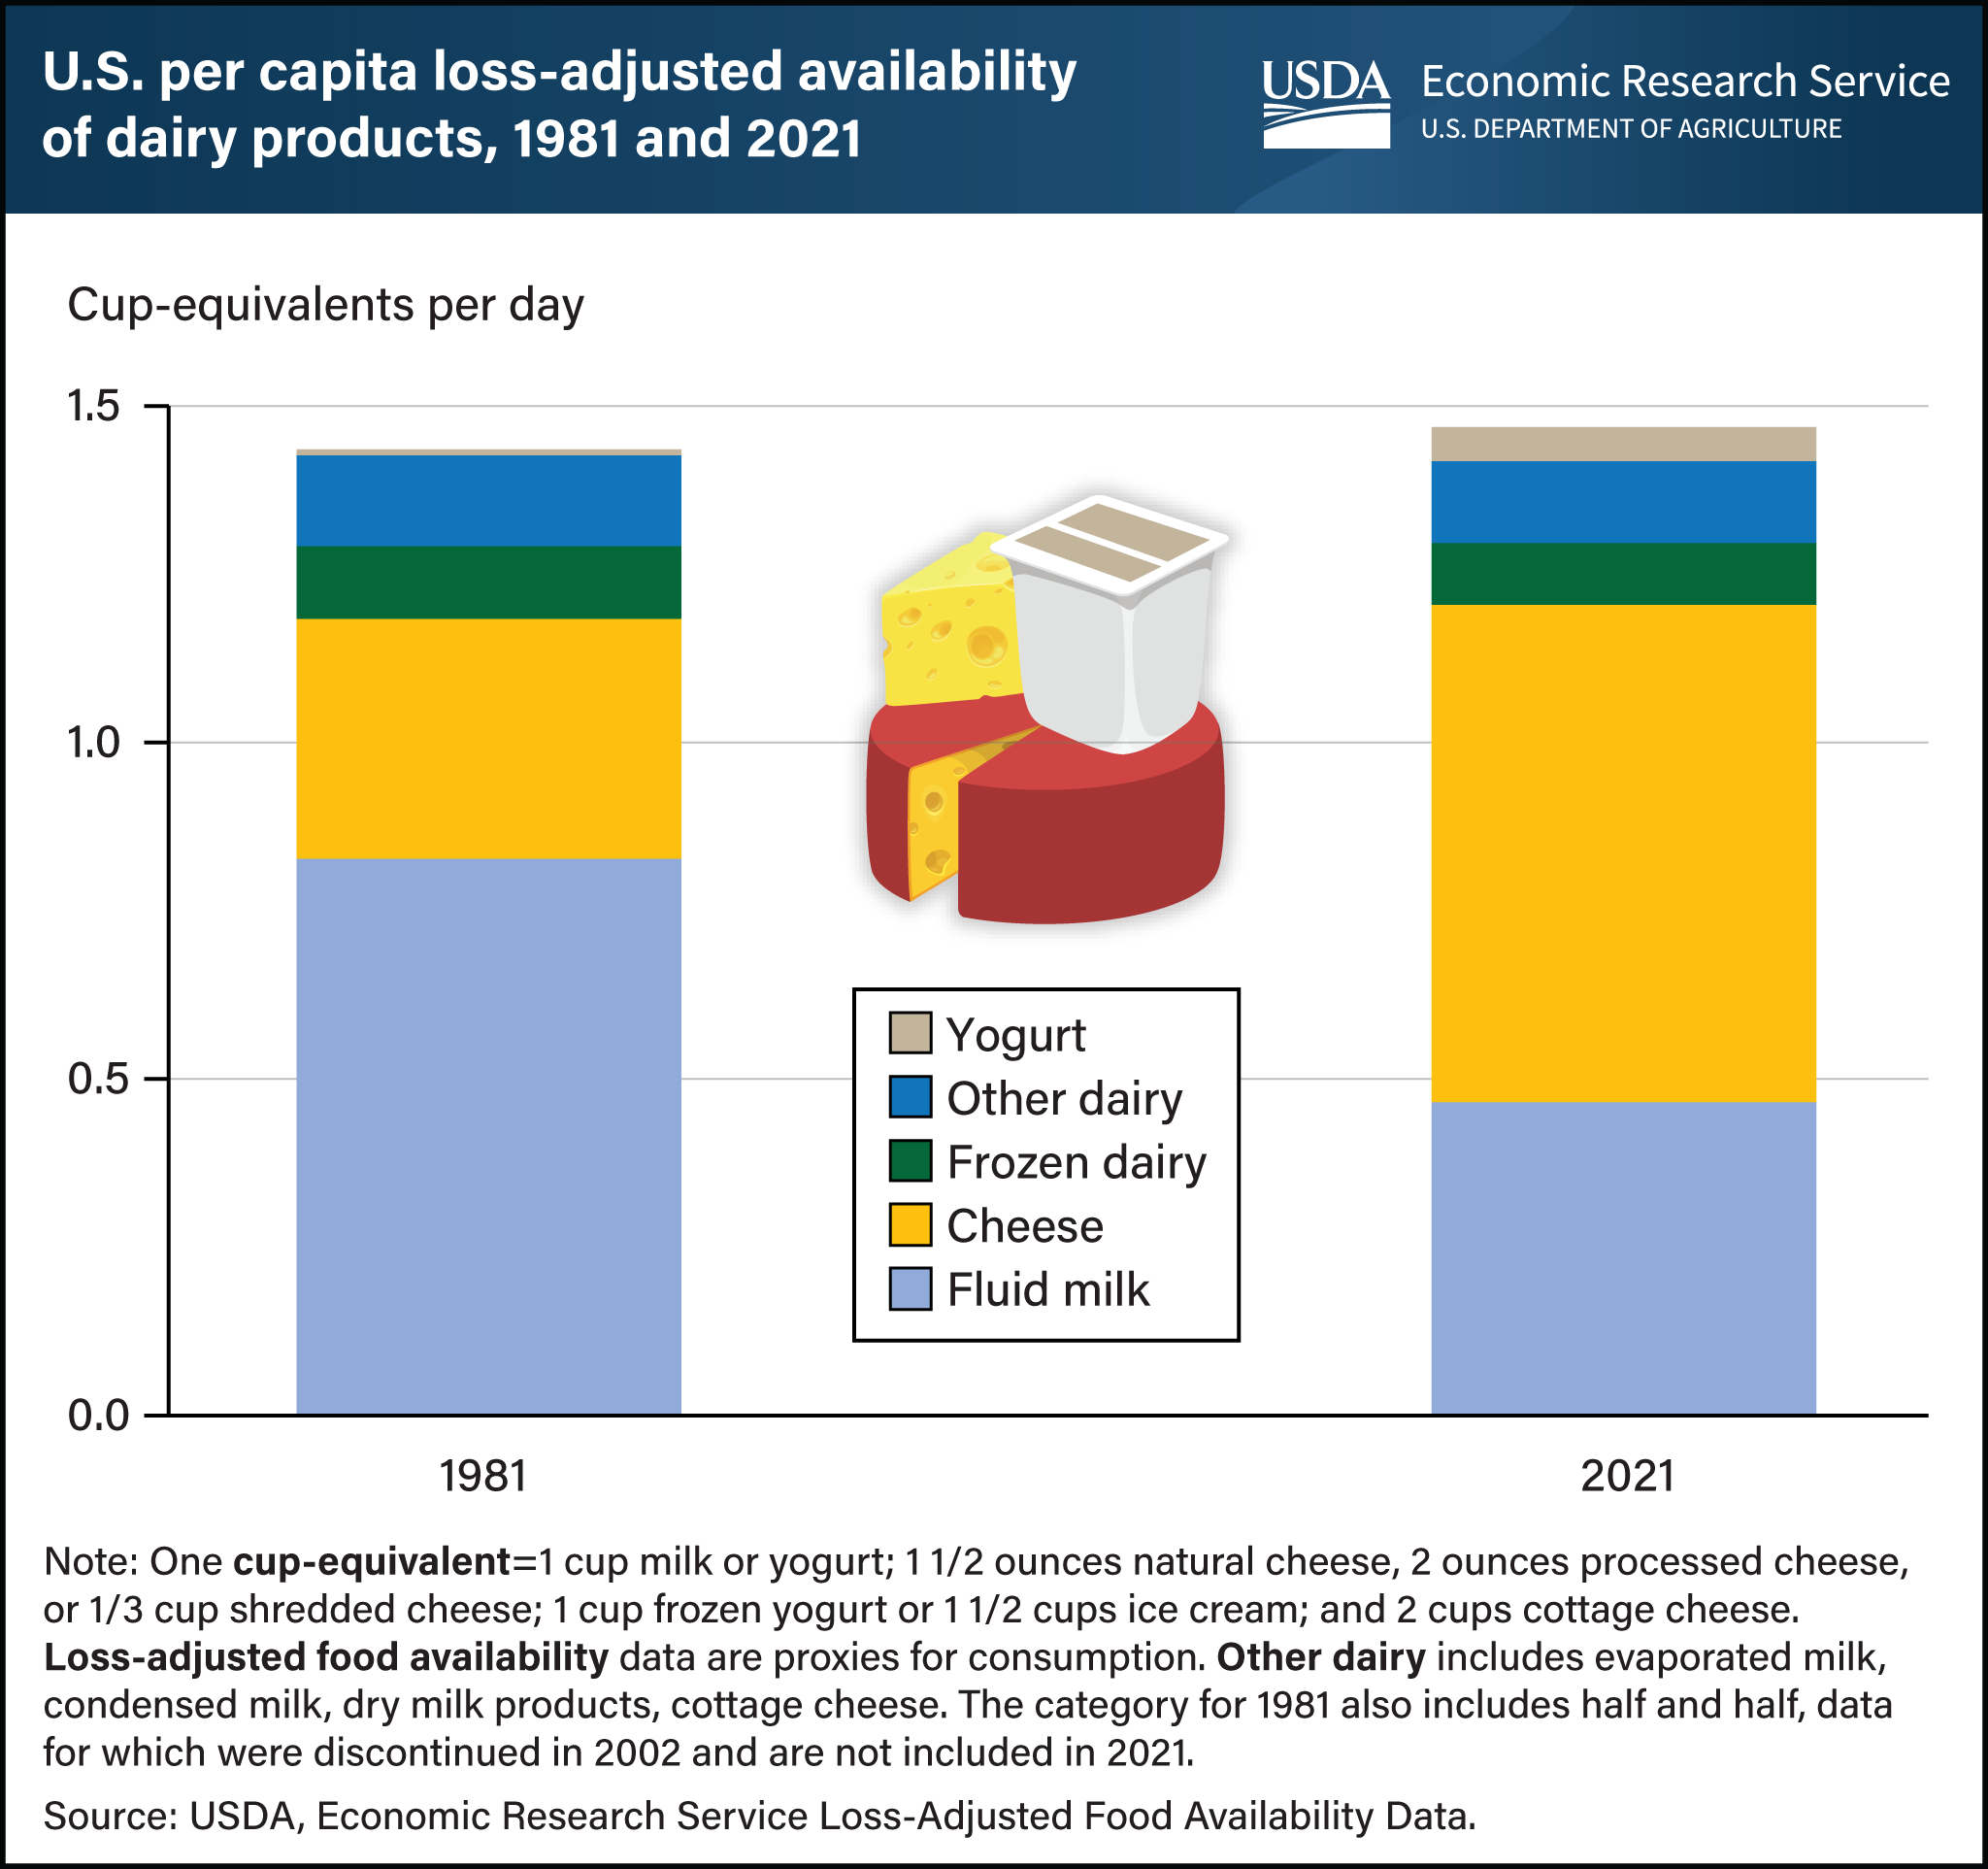
Overall U.S. dairy consumption rose slightly from 1981 to 2021, but daily cheese consumption more than doubled and consumption of yogurt grew fivefold, according to loss-adjusted food availability data from the USDA, Economic Research Service (ERS). In the data, ERS adjusts the amount of basic commodities available in the food supply by taking into account food spoilage, plate waste, and other losses to more closely approximate actual consumption. Overall loss-adjusted dairy availability totaled 1.5 cup-equivalents per person per day in 2021—half the recommended amount for a 2,000-calorie-per-day diet based on the 2020–2025 Dietary Guidelines for Americans. Daily cheese consumption grew to 0.74 cup-equivalents per person in 2021 from 0.36 cup-equivalents per person in 1981. Yogurt consumption increased to 0.05 cup-equivalents per person from nearly 0.01 cup-equivalents. Fluid milk consumption fell to 0.5 cup-equivalents per person in 2021 from 0.8 cup-equivalents per person in 1981. Several factors contributed to this decline, including competition from alternative beverages, an aging population with differing preferences across generations, and changing consumer attitudes regarding milk fats. This chart is from ERS’s Ag and Food Statistics: Charting the Essentials, updated December 2022.