
Food-at-home prices experienced year-over-year increases as high as 13.5 percent in August 2022
- by Megan Sweitzer, Matthew MacLachlan and Gianna Short
- 2/14/2023
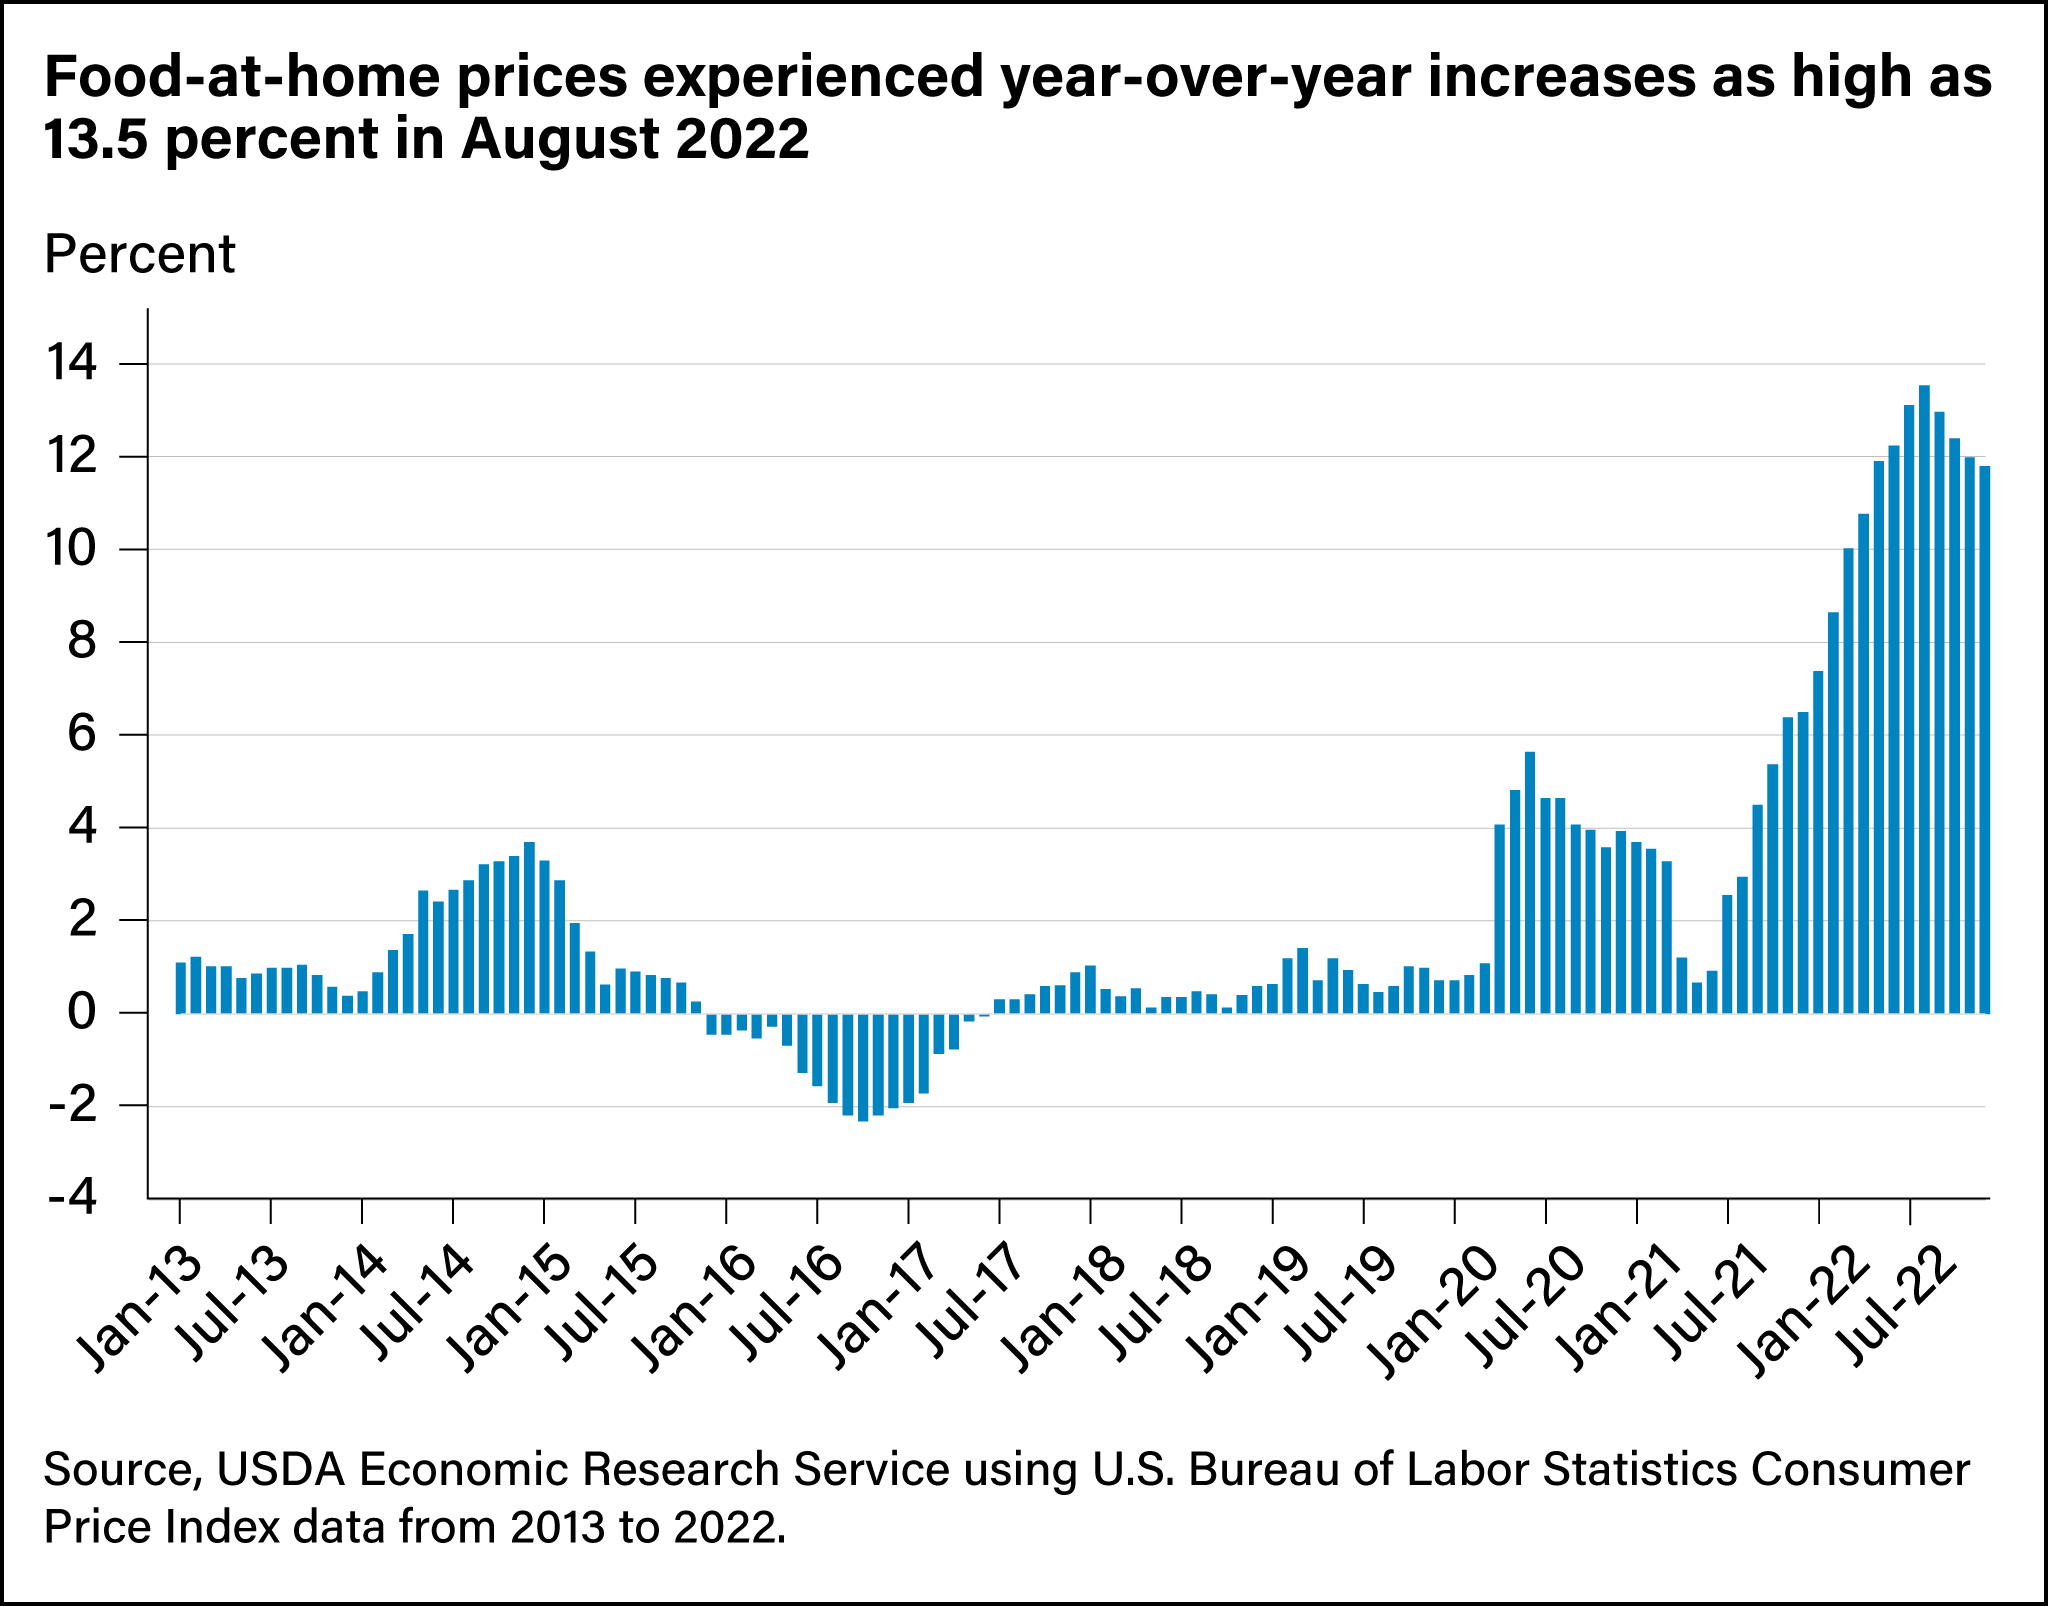
Bar chart showing food-at-home price changes, by percent, from January 2013 to December 2022.