
Population growth in Africa has outpaced commodity supply growth
- by Michael E. Johnson, Stephen Morgan and Jarrad Farris
- 2/6/2023
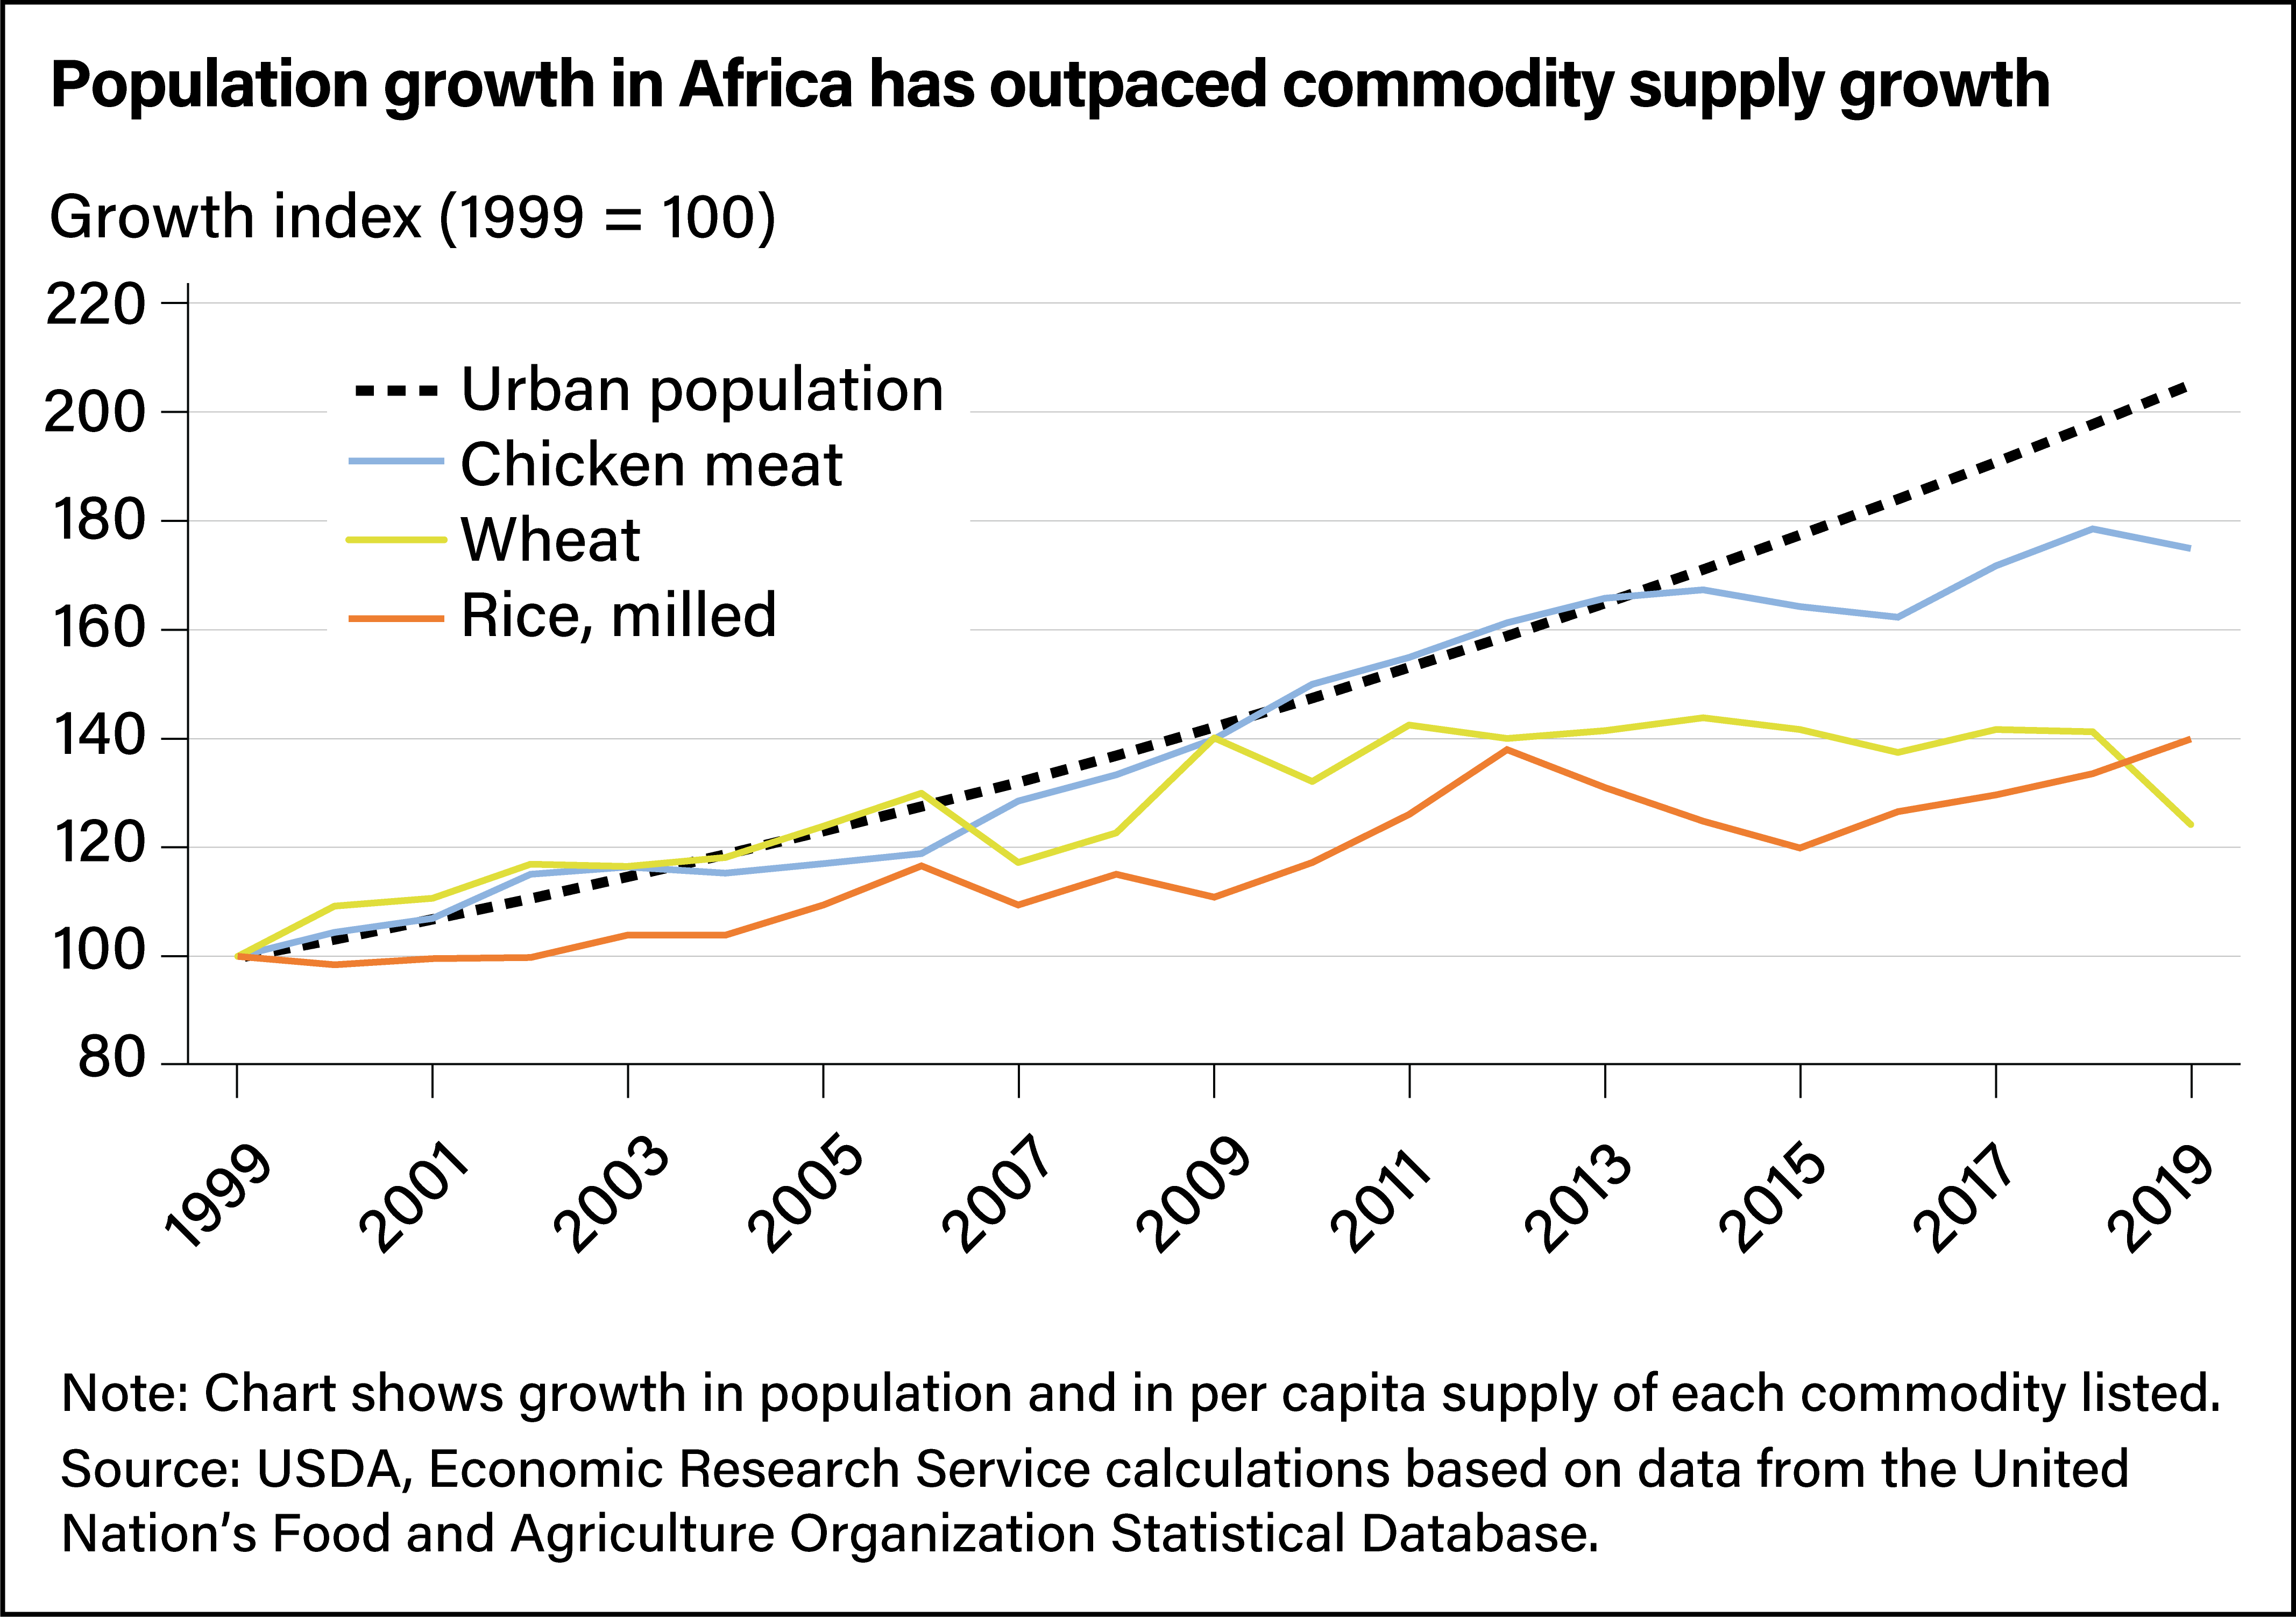
Line chart comparing urban population growth in Africa to the growth of chicken, wheat, and rice supplies from 1999 to 2019.