
Food retailing market concentration increased more at national level than county level over past three decades
- by Eliana Zeballos
- 1/25/2023
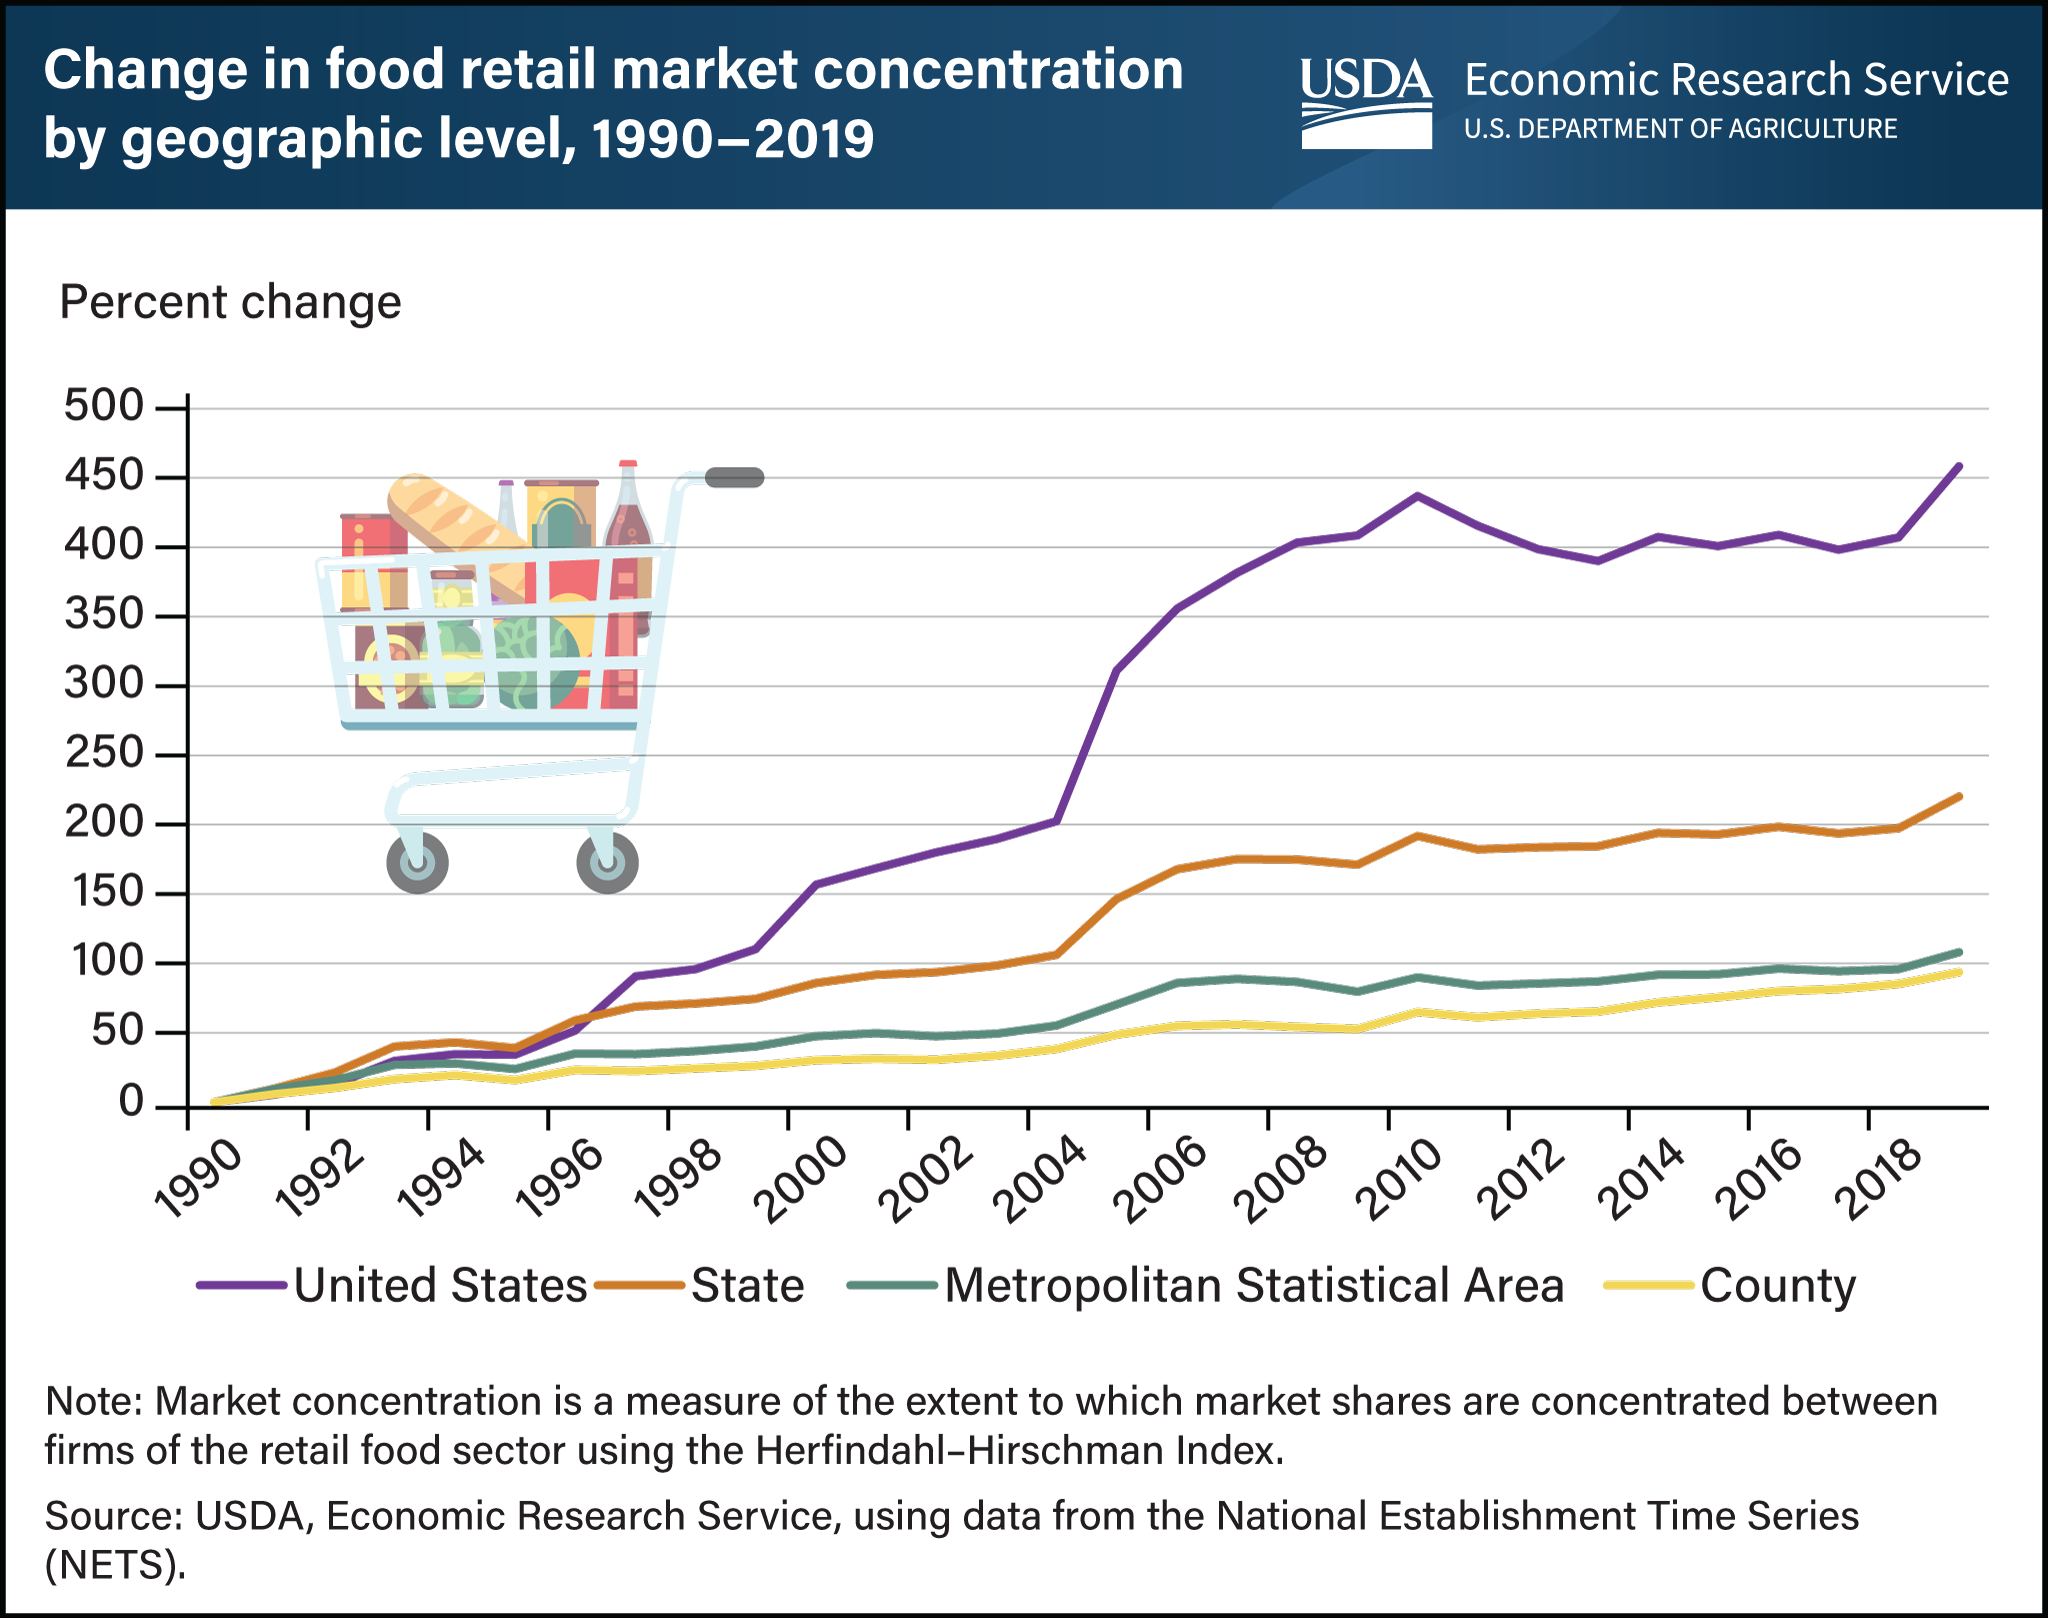
The U.S. food retail sector experienced substantial consolidation and structural change over the last three decades. Market concentration, as measured by the Herfindahl-Hirschman Index (HHI), is a measure of the extent to which market shares are concentrated between firms of the retail food sector at the national, State, Metropolitan Statistical Area, and county levels in the United States. This analysis includes all establishments with a significant portion of food sales that are likely substitutes for each other: supermarkets and other grocery (except convenience) and warehouse clubs and supercenters. Although the national market is less concentrated than the average State level, according to the HHI, national market concentration increased substantially between 1990 and 2019 (458 percent). In comparison, average county-level market concentration has remained relatively constant over the past 30 years, increasing only 94 percent. While national measures provide information about larger trends, trends in localized markets are likely more relevant for consumers, food-retail competitors, and policymakers. This chart was drawn from the USDA, Economic Research Service economic research report A Disaggregated View of Market Concentration in the Food Retail Industry, which uses data from the National Establishment Time Series (NETS) to calculate and examine the market conditions of food retailing from 1990 to 2019. The report published in January 2023.