
Share of working-age population in nonmetro areas declined from 2010 to 2020
- by James C. Davis, Anil Rupasingha, John Cromartie and Austin Sanders
- 11/16/2022
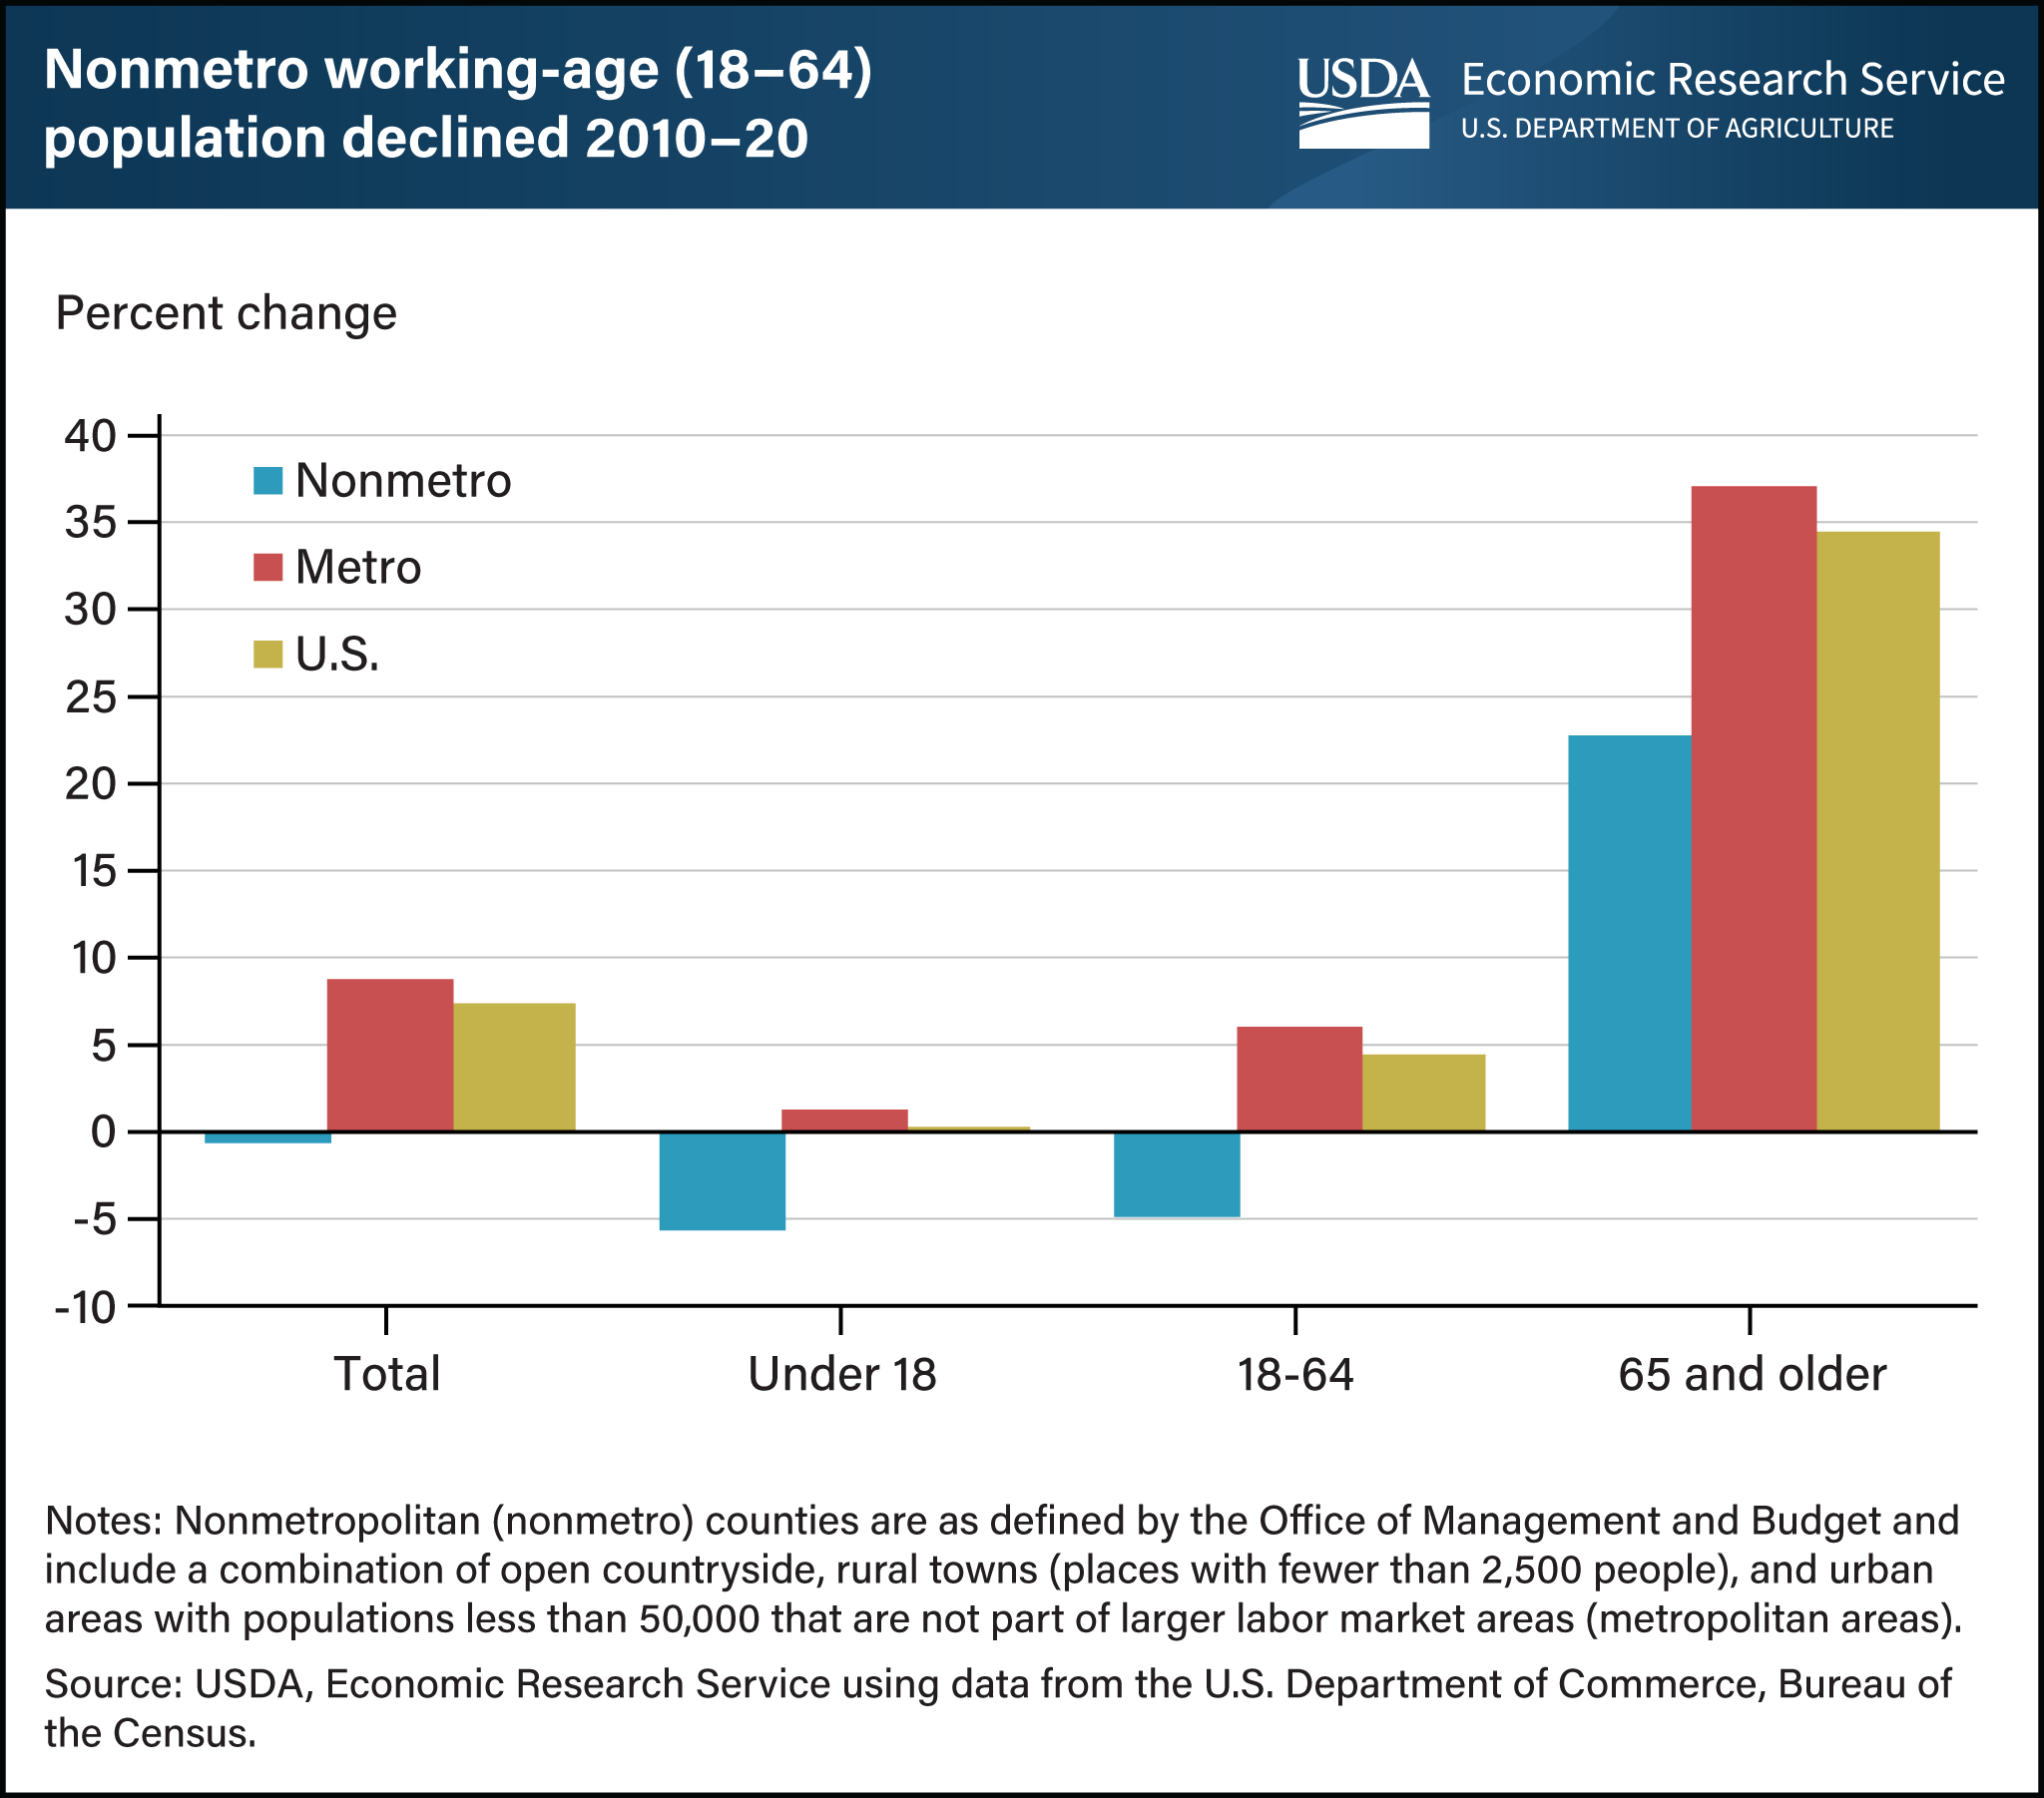
In nonmetro areas from 2010 to 2020, the working-age population (ages 18 to 64) declined by 4.9 percent, and the population under age 18 declined by 5.7 percent. At the same time, the population of those 65 years and older grew by 22 percent. In metro areas, the working-age population increased by 6 percent during the 2010s; however, this growth was overshadowed by the 37 percent growth in the 65 and older population. Nationwide, the overall U.S. population has aged as the baby boomer generation entered their 60s and 70s. Nonmetro areas, in addition to having an aging population, also face population decline. Between 2010 and 2020, U.S. Census data show the population in nonmetro counties declined by 0.6 percent, the first decade of overall nonmetro population decline in U.S. census history. Nonmetro population subsequently increased in the first year and a half of the Coronavirus (COVID-19) pandemic from 2020 to 2021 which saw people move out of metro areas into rural places. However, population gains due to COVID-19 were not enough to offset a decade-long slide in the share of the population that is of working-age nor to reduce the share of the rural population that was 65 or older during this period. Overall, population decline and an increase in average age in rural areas will affect the makeup and availability of the rural labor force. This chart appears in the USDA, Economic Research Service report Rural America at a Glance: 2022 edition, published on November 15, 2022.