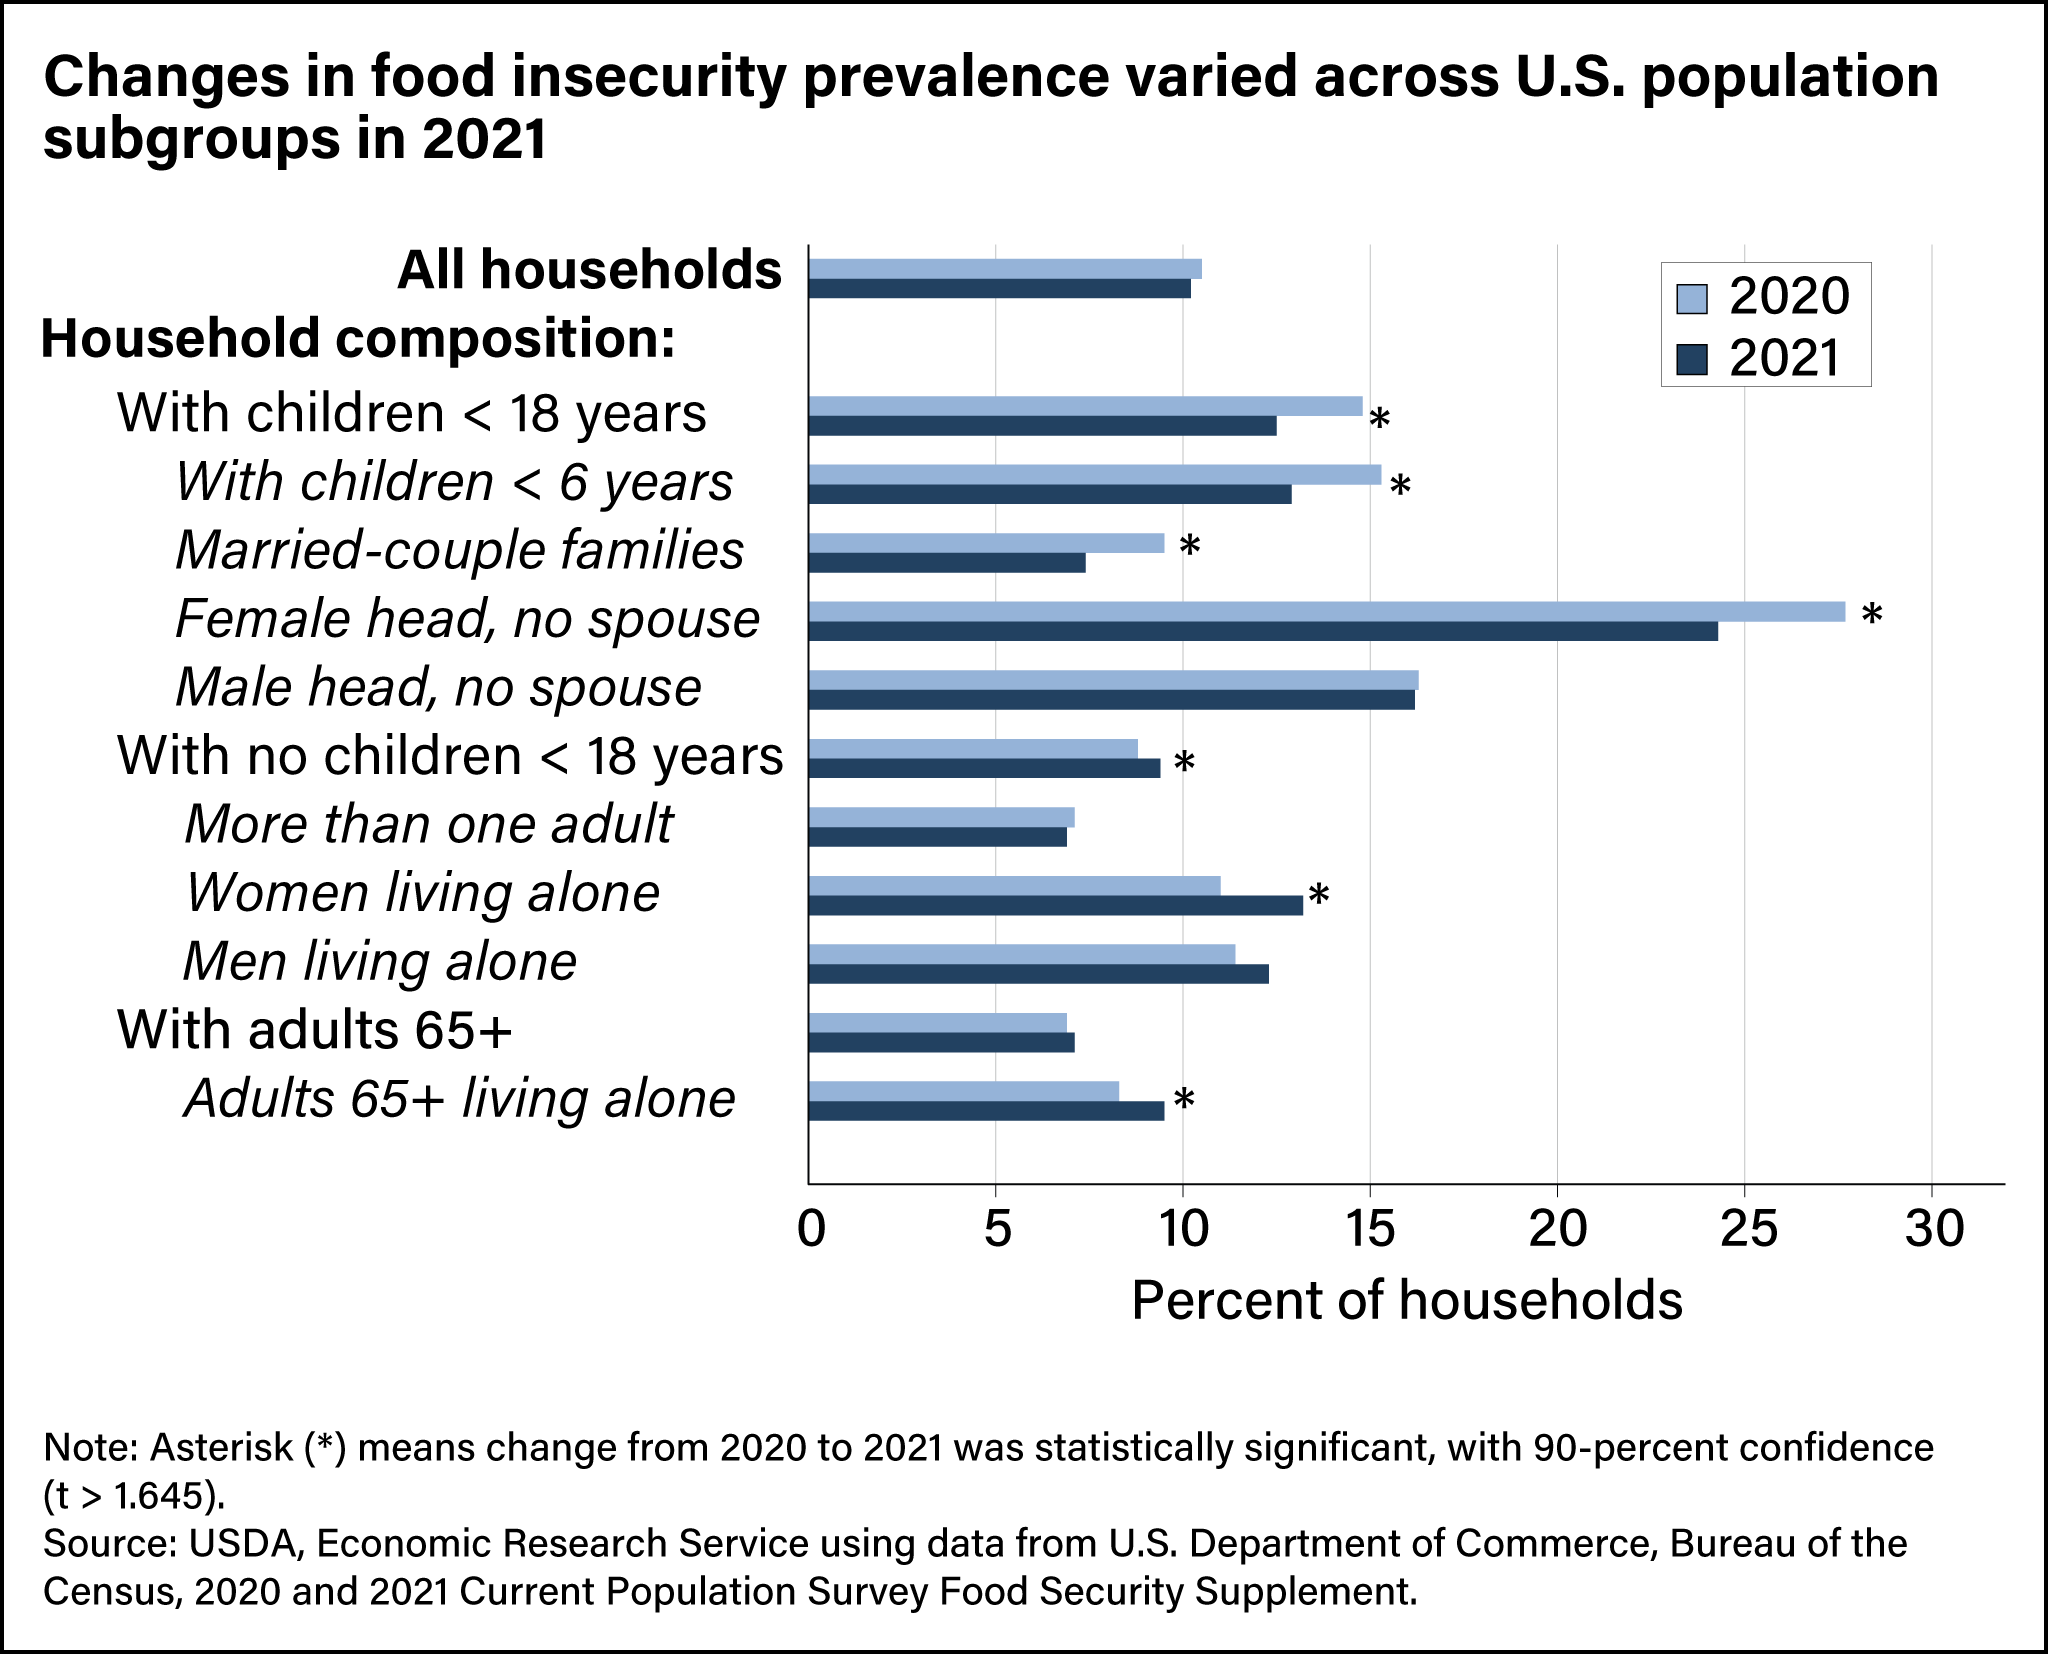
Changes in food insecurity prevalence varied across U.S. population subgroups in 2021
- by Laura J. Hales and Alisha Coleman-Jensen
- 11/7/2022

Horizontal bar chart showing the percent of households that were food insecure in 2020 and 2021, with subgroups of household composition broken out.
