
Global oil prices influence GDP per capita in Africa’s top two oil-producing nations
- by Adam Gerval and James Hansen
- 9/26/2022
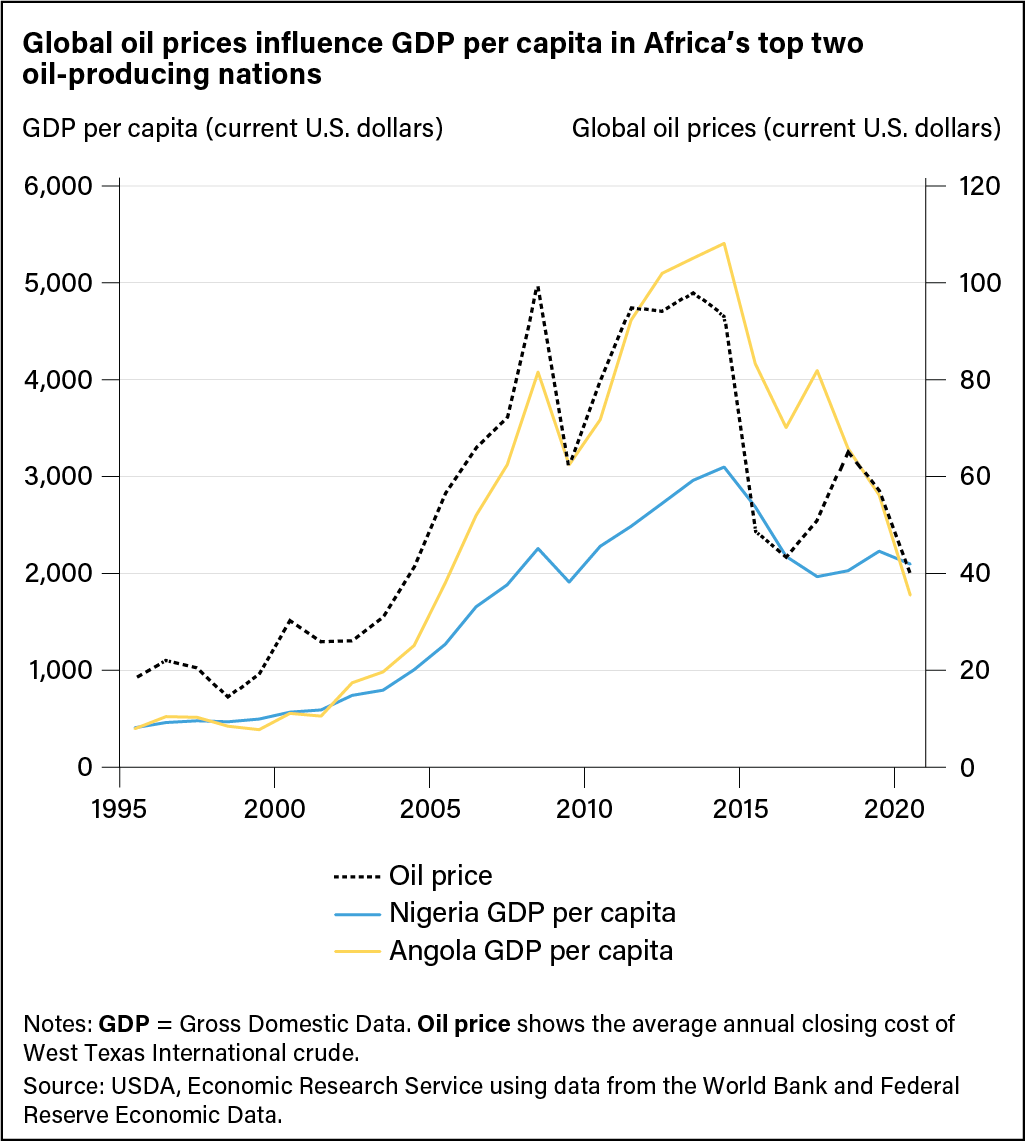
Line chart showing trends in GDP per capita for Nigeria and for Angola, as well as trends in global oil prices, from 1995 to 2020.