
U.S. consumers spent more money on food away from home than food at home in 2021, returning to pre-pandemic trend
- by Eliana Zeballos and Wilson Sinclair
- 6/13/2022
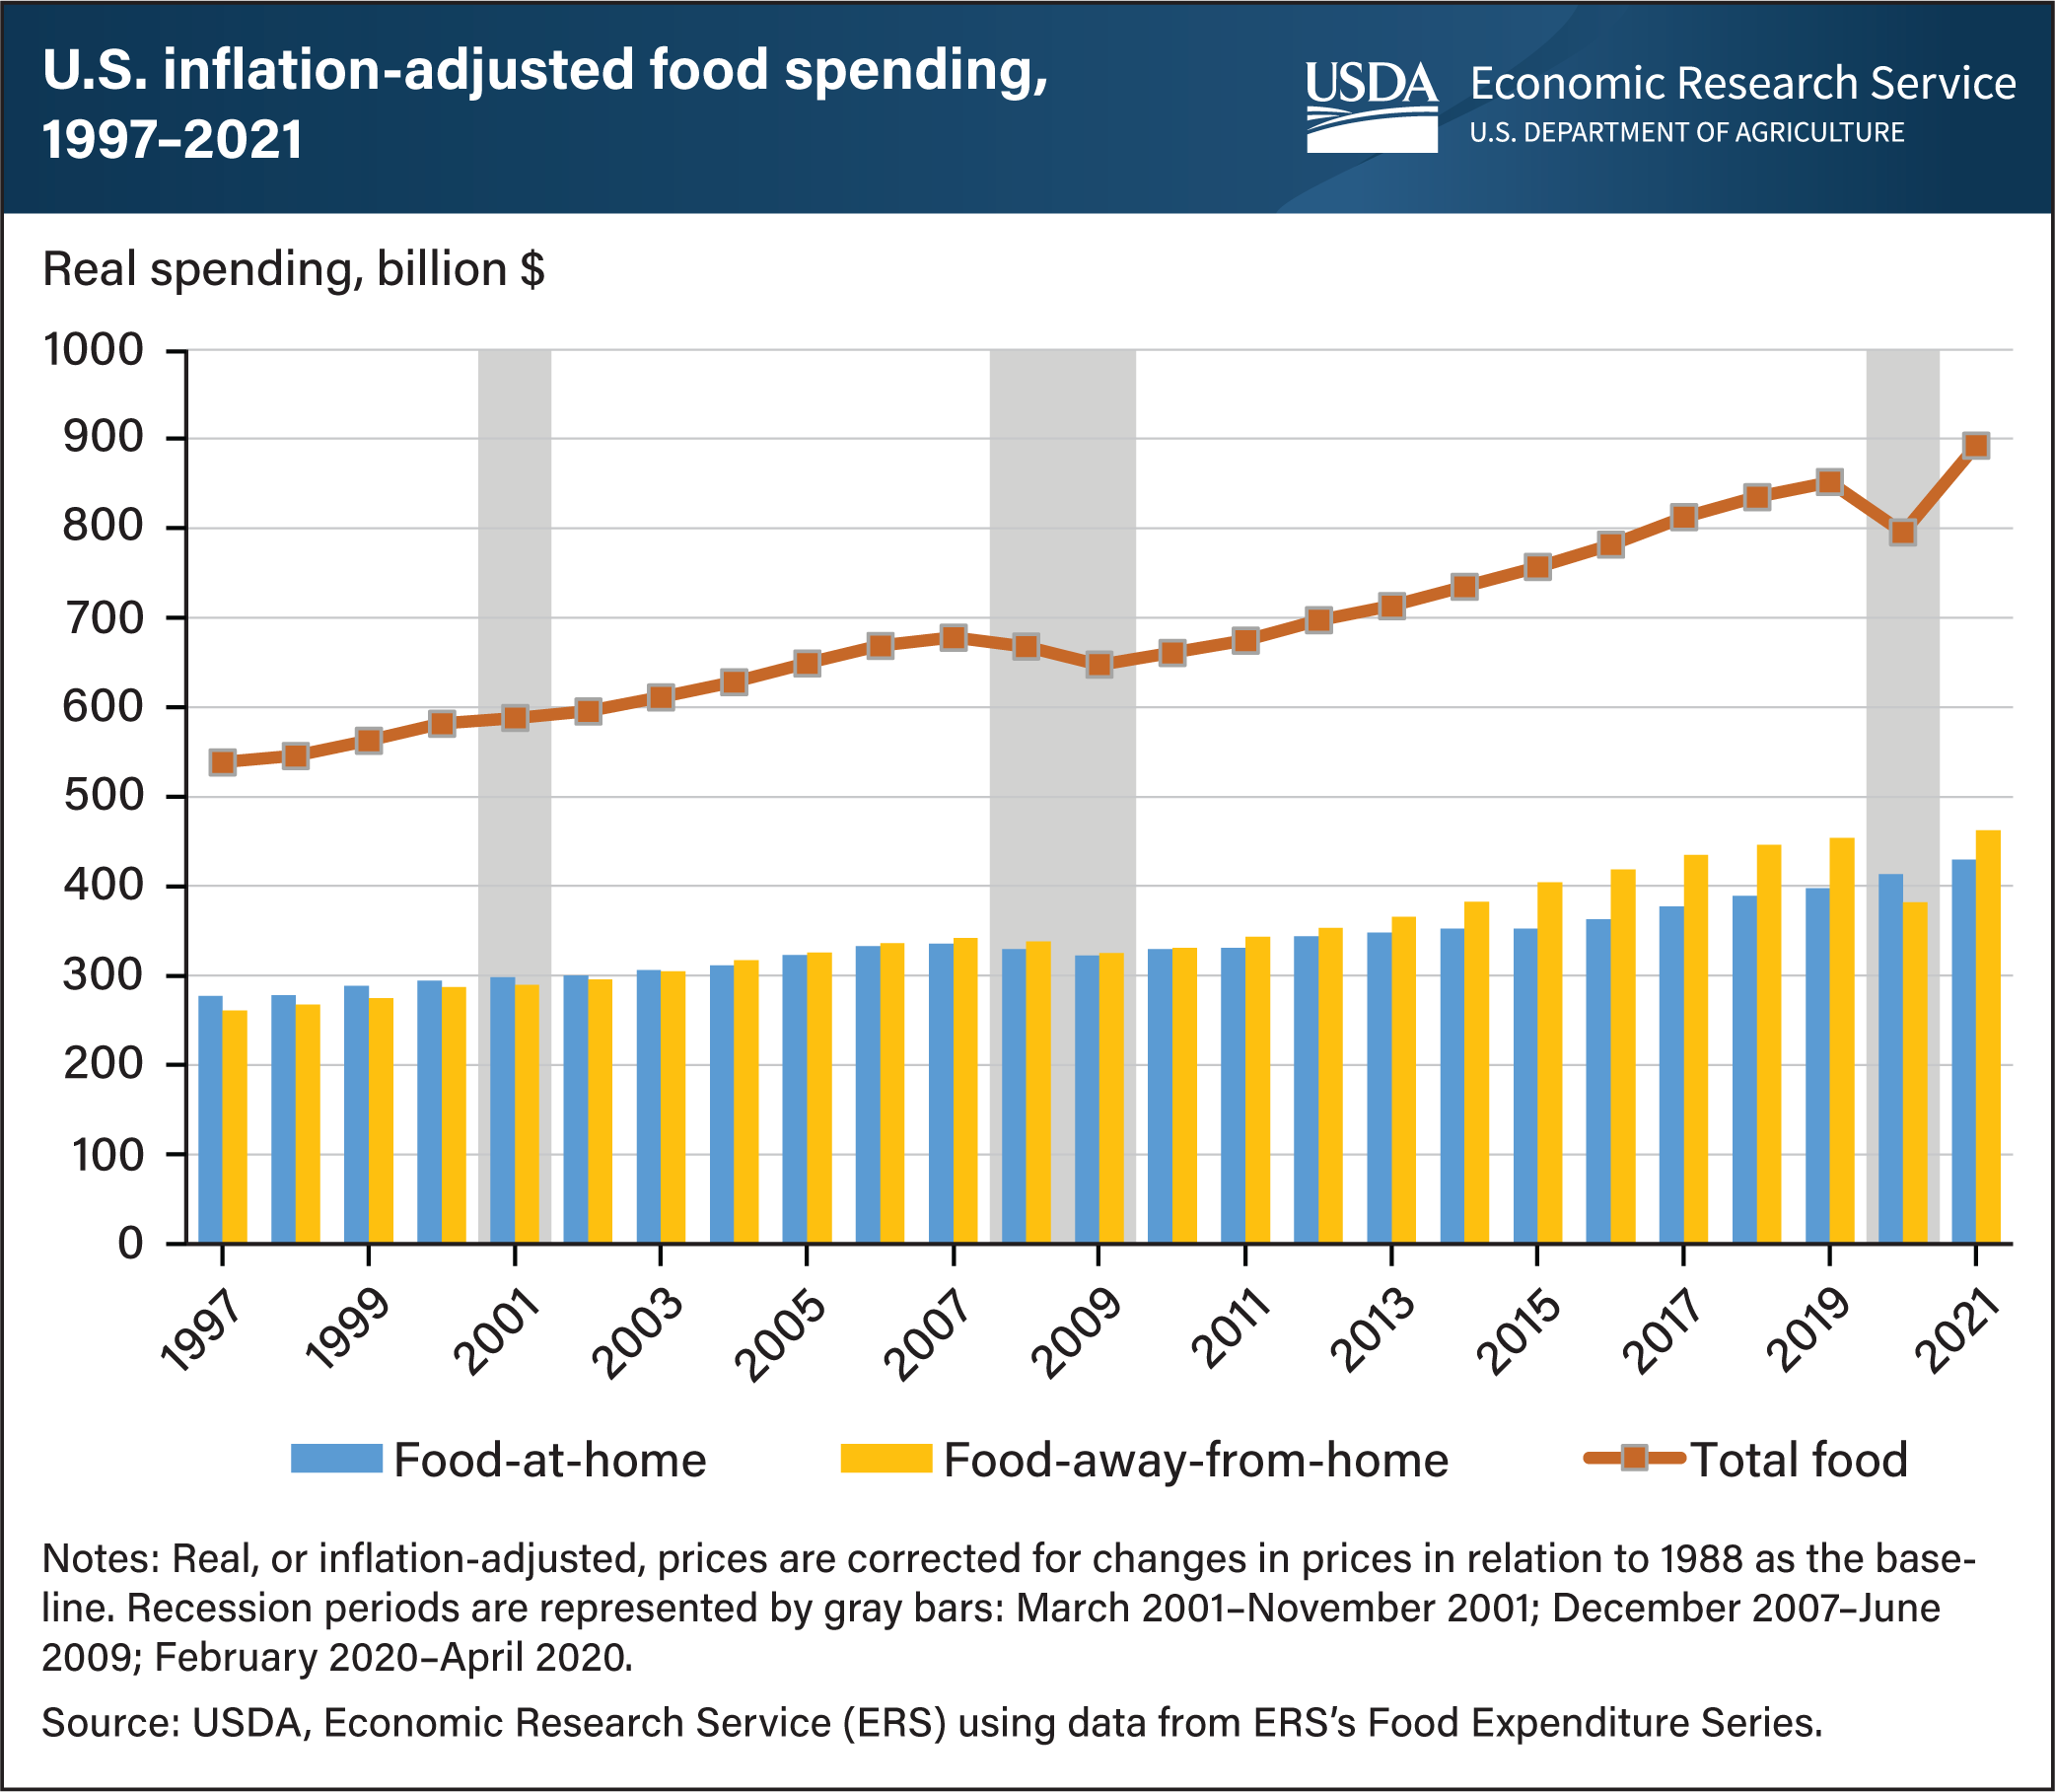
Real, or inflation-adjusted, annual food spending in the United States has increased every year since 1997 except in 2008, 2009, and 2020. Sales increased from 1997 to 2019 for both food at home (FAH), food intended for off-premise consumption from retailers such as grocery stores, and food away from home (FAFH), food consumed at outlets such as restaurants or cafeterias. Over this period, real FAH spending increased at a slower rate (43.5 percent) than for FAFH (73.9 percent). In 2020, during the Coronavirus (COVID-19) pandemic, real total food expenditures fell 6.6 percent from 2019. U.S. consumers’ food-spending patterns changed as efforts were made to limit the spread of COVID-19, which included stay-at-home orders. FAFH spending decreased by 15.8 percent in 2020, while FAH spending increased by 3.9 percent. In 2021, real total food expenditures increased 12.2 percent from 2020. With increased household income during the economic recovery and relaxed safety measures around indoor dining and social distancing, FAFH spending increased by 21.1 percent in 2021 from the previous year and was the primary driver of the overall food spending increase. FAH spending increased by 4 percent. The data for this chart come from the ERS’s Food Expenditure Series data product.