
Contracts are common in animal and crop production
- by Christine Whitt
- 4/29/2022
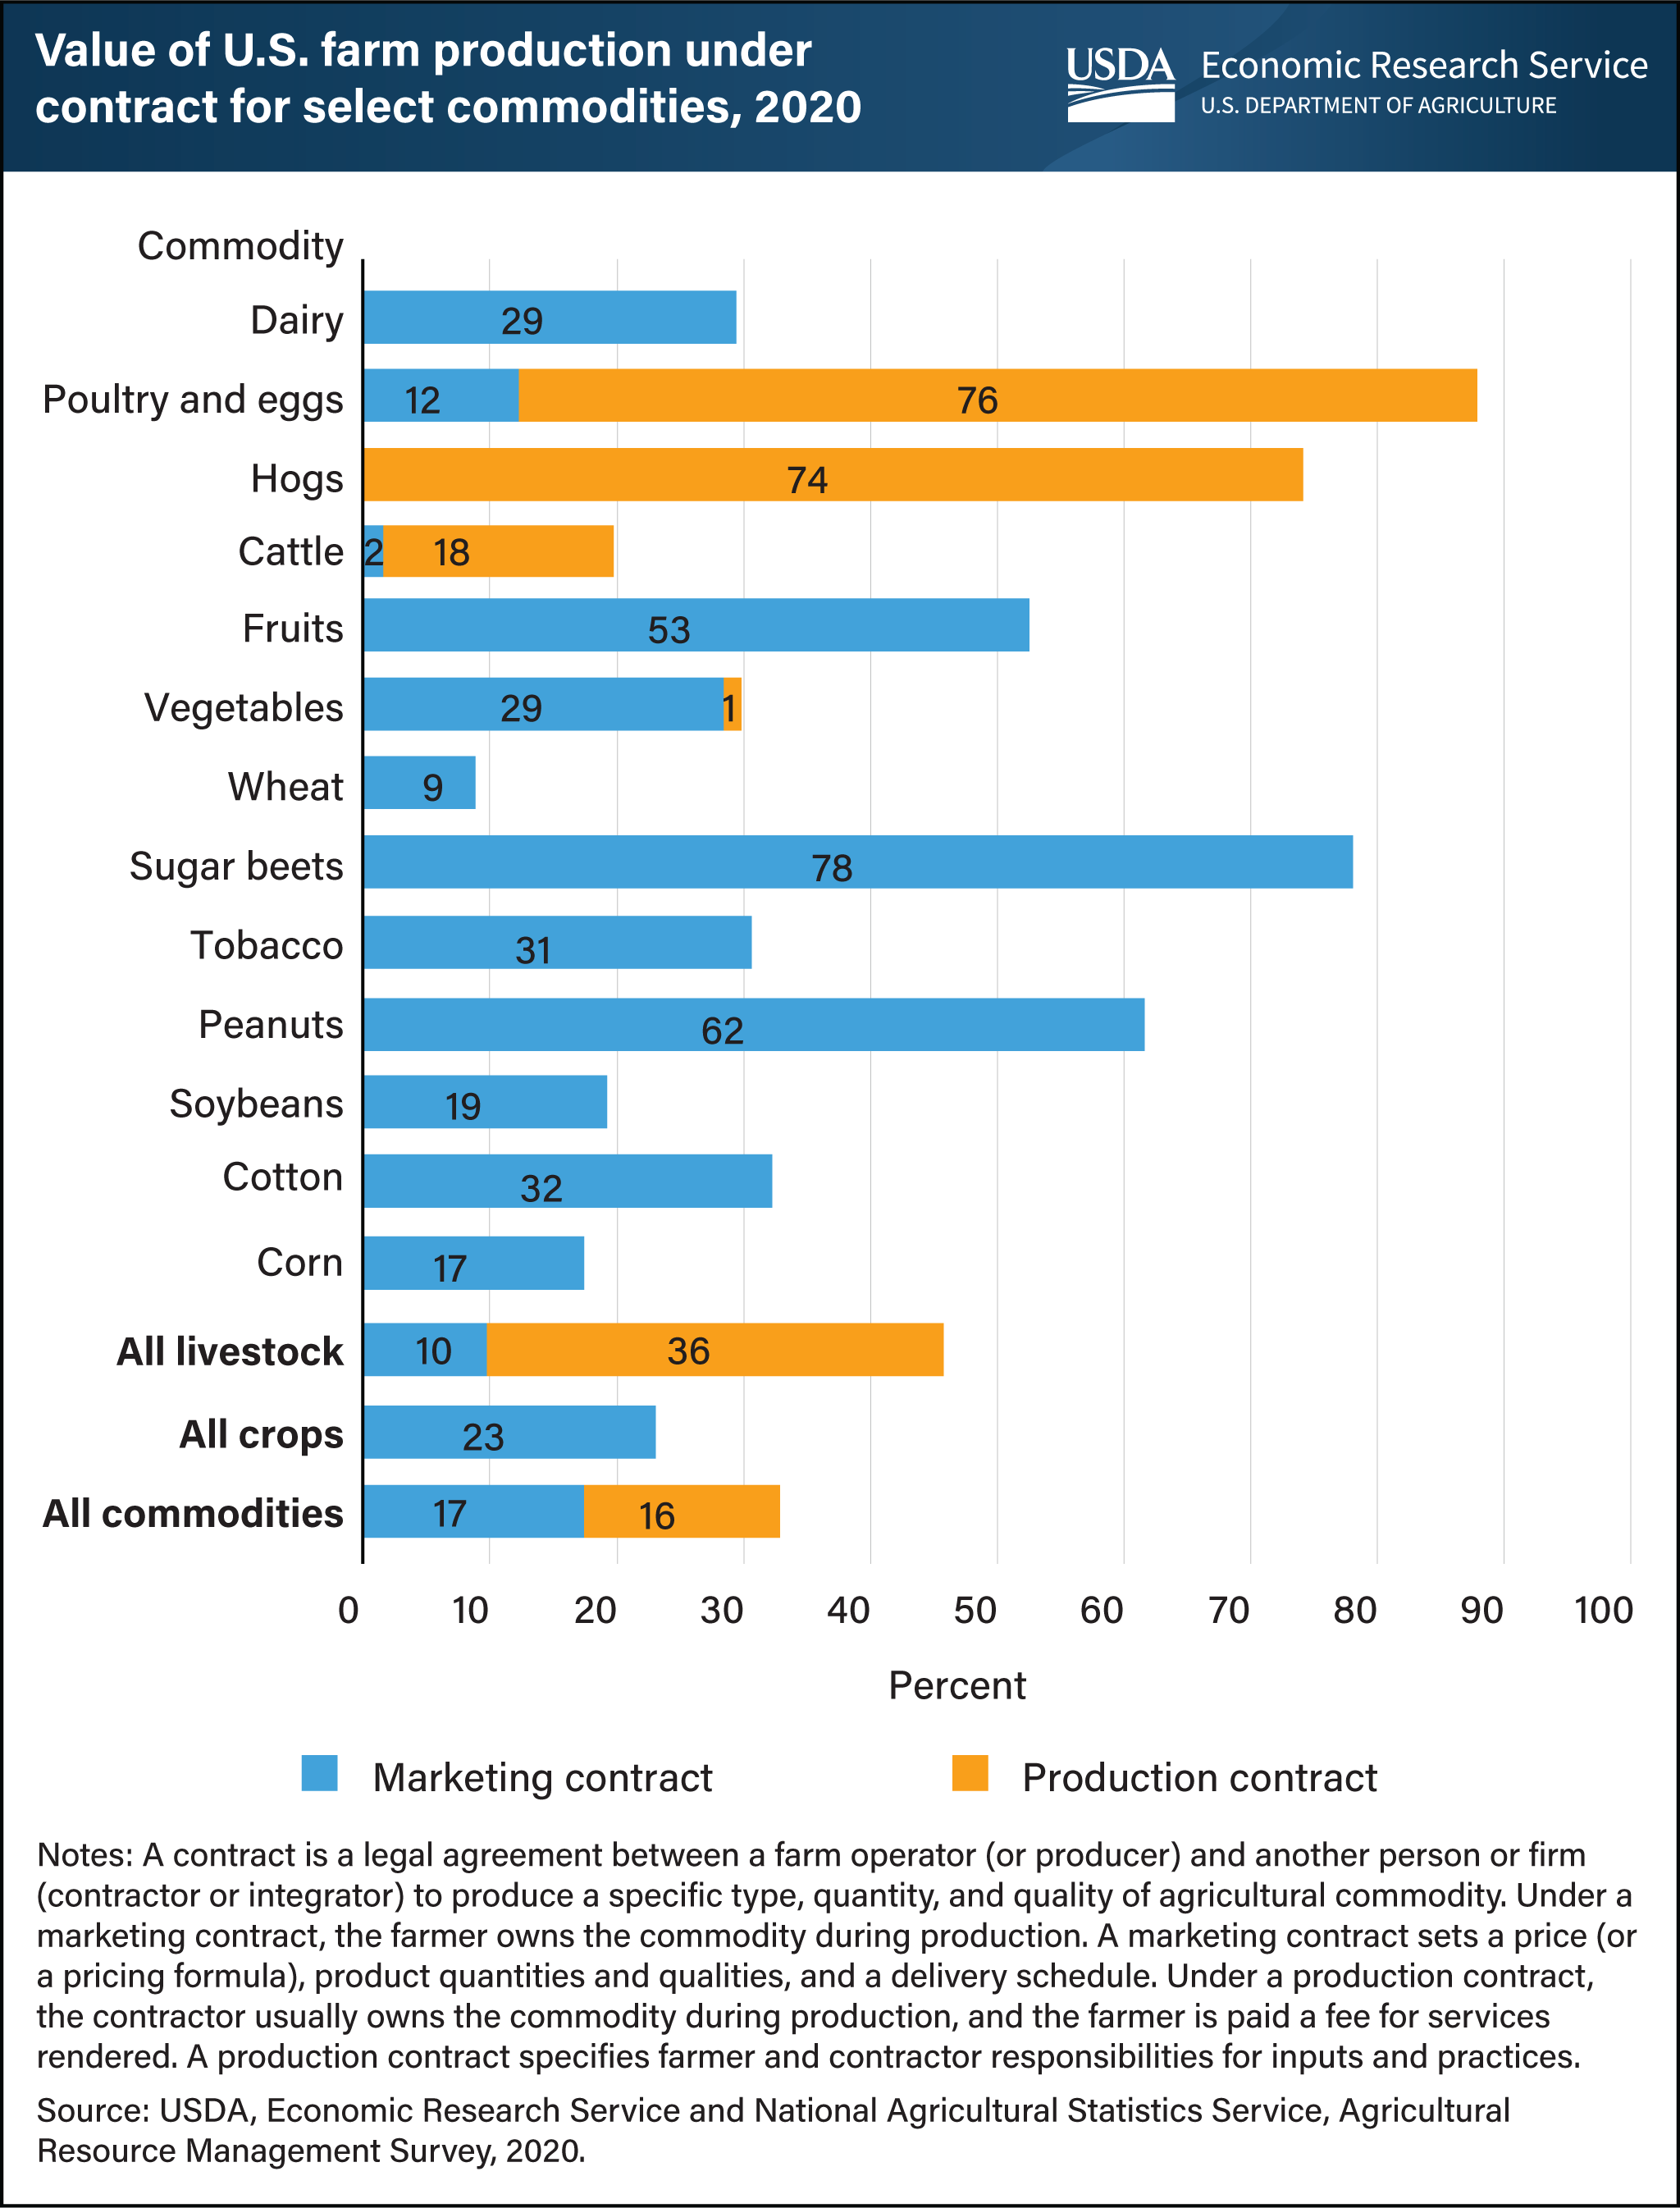
In 2020, agricultural contracts governed the production of about 33 percent, by value, of all U.S. farm commodities. A contract is a legal agreement between a farmer and another person or firm to produce a specific type, quantity, and quality of crops or livestock. Farmers use contracts, with set pricing (or a pricing formula) or fees, instead of traditional cash sales to manage income risks. USDA, Economic Research Service identifies two types of agricultural contracts: marketing and production. Under marketing contracts, the ownership of commodities stays with the farmer during production. The contracts set a price or a pricing formula, product quantities and qualities, and a delivery schedule. Under production contracts, the contractor generally owns the commodity and provides inputs, services, production guidelines, and technical advice to the farmer. Relative to overall commodity production, marketing contracts and production contracts are equally used. However, crop farmers are more likely to use marketing contracts and livestock producers typically use production contracts. Marketing contracts represented 23 percent of all crop production in 2020. More than half the value of production of sugar beets, peanuts, and fruits was produced under marketing contracts in 2020, and less than 20 percent of soybeans, corn, and wheat production fell under marketing contracts. Production contracts represented 36 percent of all livestock production, including 76 percent of poultry and egg production, and 74 percent of hog production. Although marketing contracts are mostly used for crop production, a small percentage of poultry and eggs was produced using marketing contracts. Likewise, a small percentage of vegetable production occurred under production contracts even though most production contracts cover livestock. This chart was drawn from the Farm Structure and Contracting topic page, updated March 2022.