
U.S. milk output per cow rose steadily from 2000-20, while the total number of milk cows fluctuated
- by Eric Njuki
- 3/22/2022
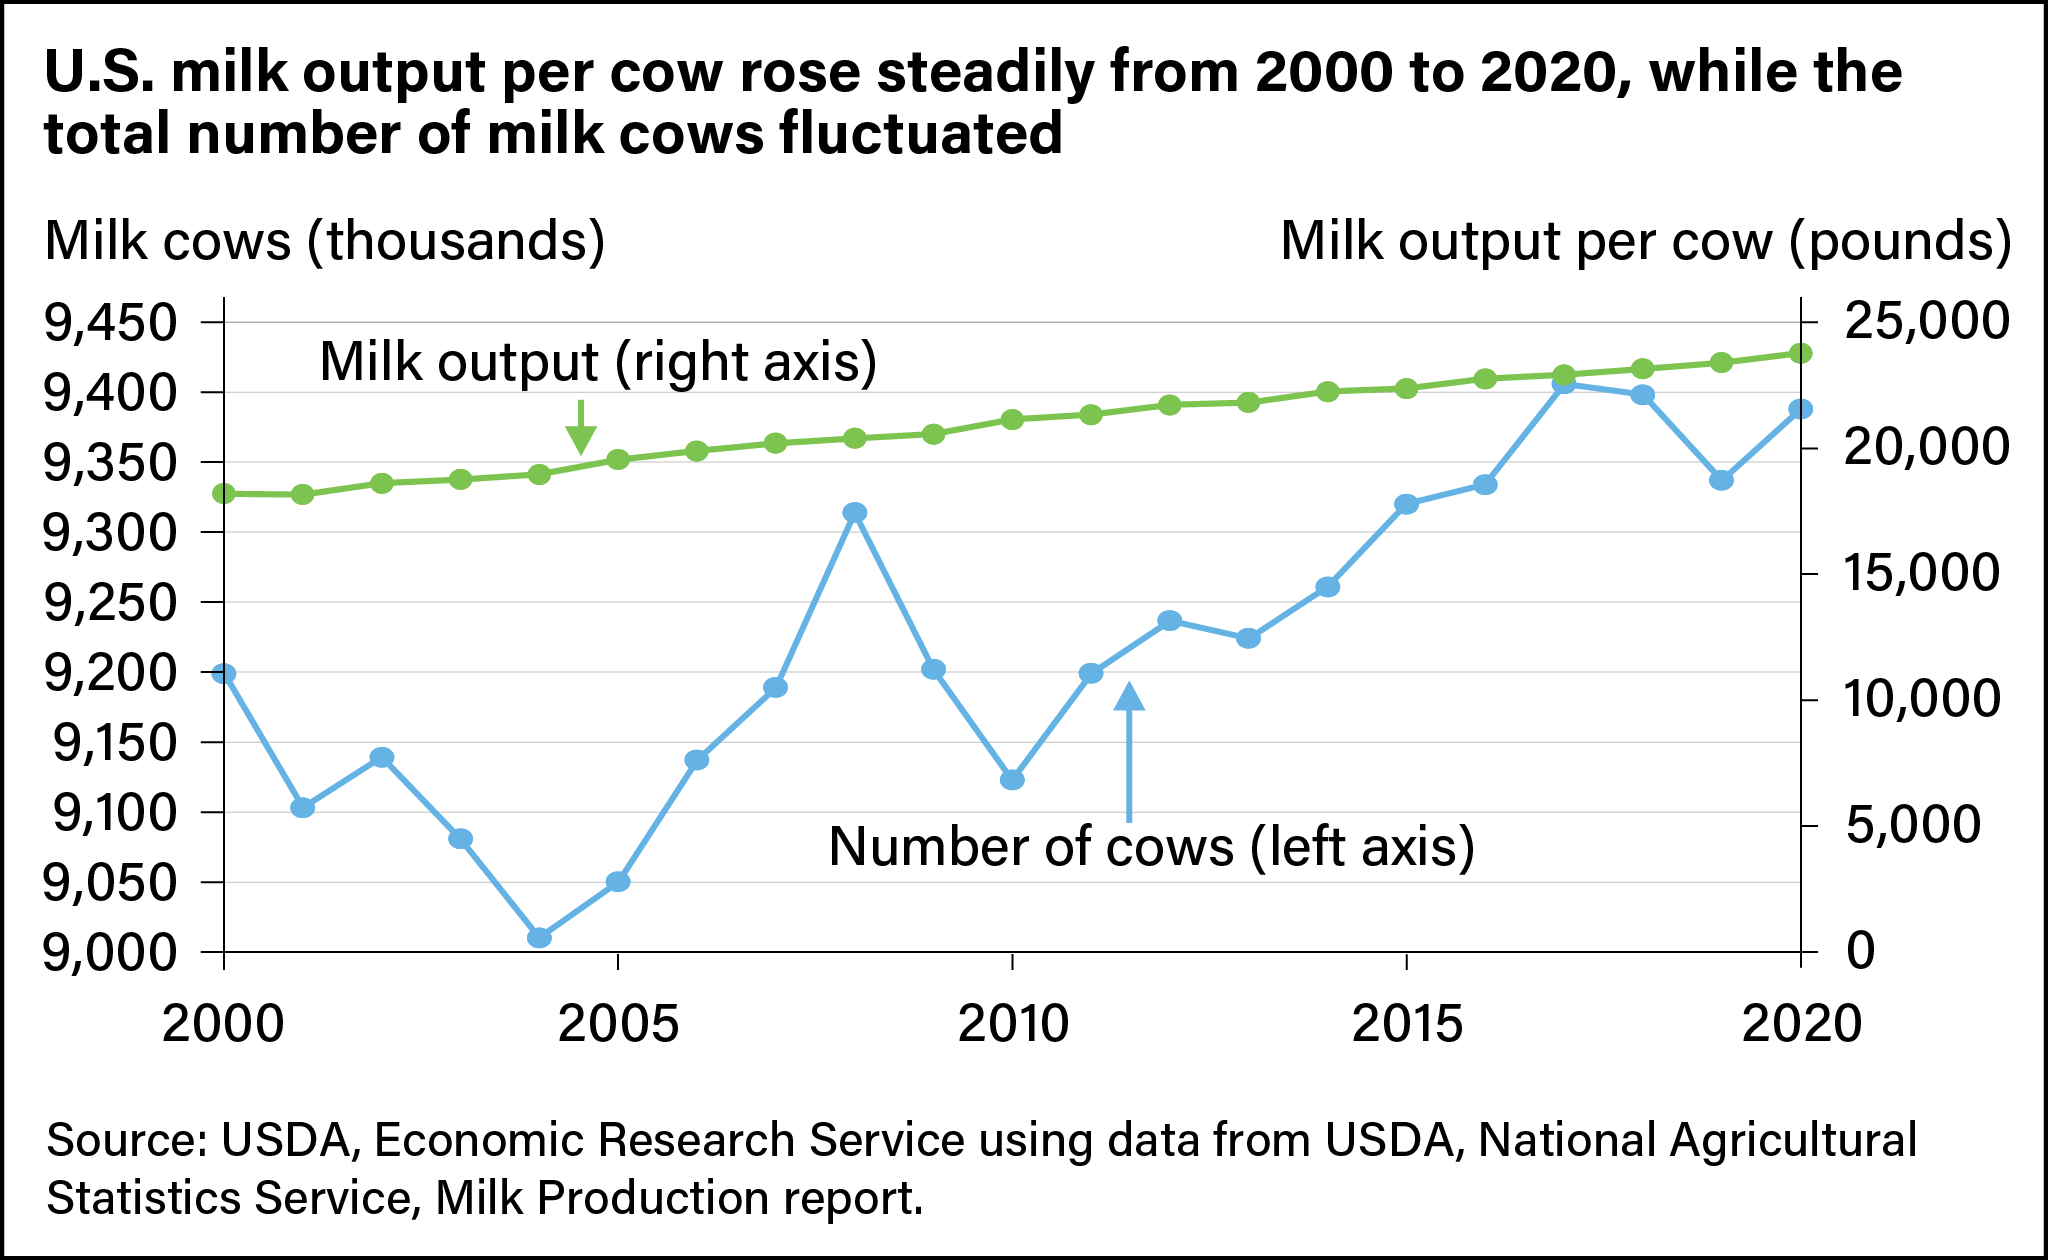
Line chart indicating number of U.S. milk cows (in the thousands) and milk output (in pounds) from 2000 to 2020.