
Expenditure shares of chicken products labeled “raised without antibiotics” grew from 2012 to 2017
- by Kar Ho Lim and Elina T. Page
- 3/7/2022
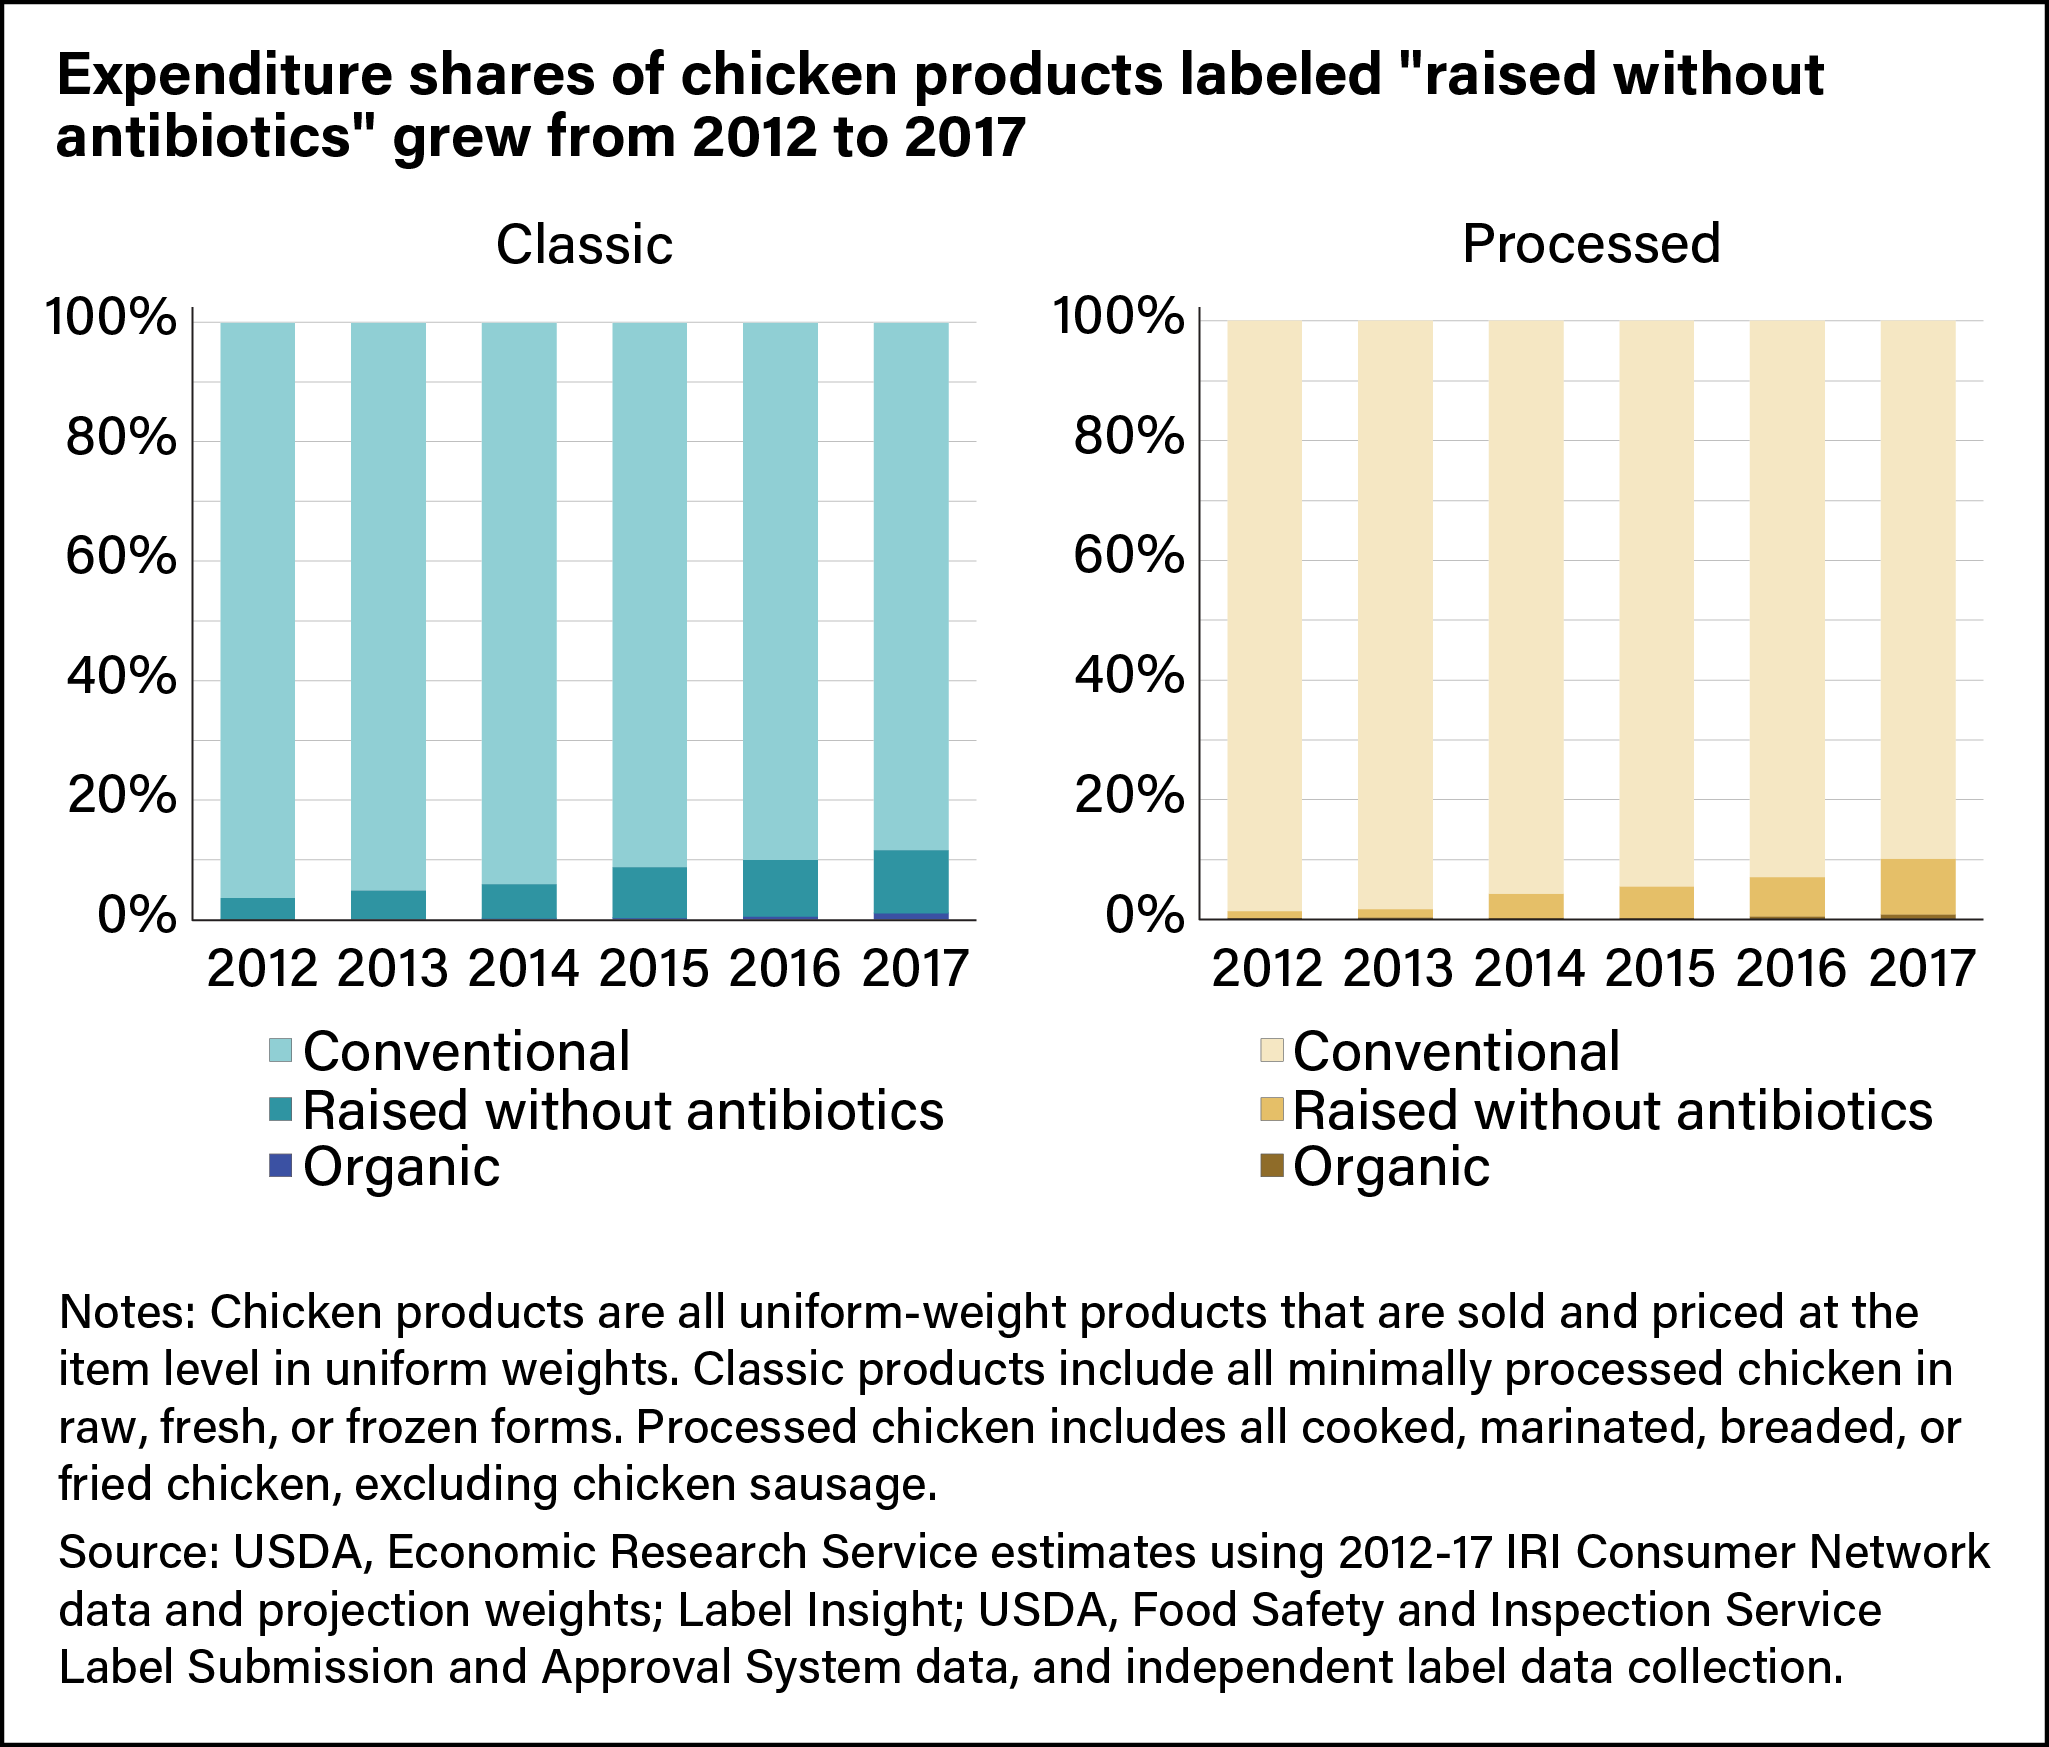
Two vertical bar charts showing data from 2012 to 2017. One shows percent of classic chicken labeled conventional, raised without antibiotics, and organic. The second shows processed chicken labeled conventional, raised without antibiotics, and organic.