
U.S. Consumers in 18 States faced grocery taxes in 2019
- by Hayden Stewart and Diansheng Dong
- 12/7/2021
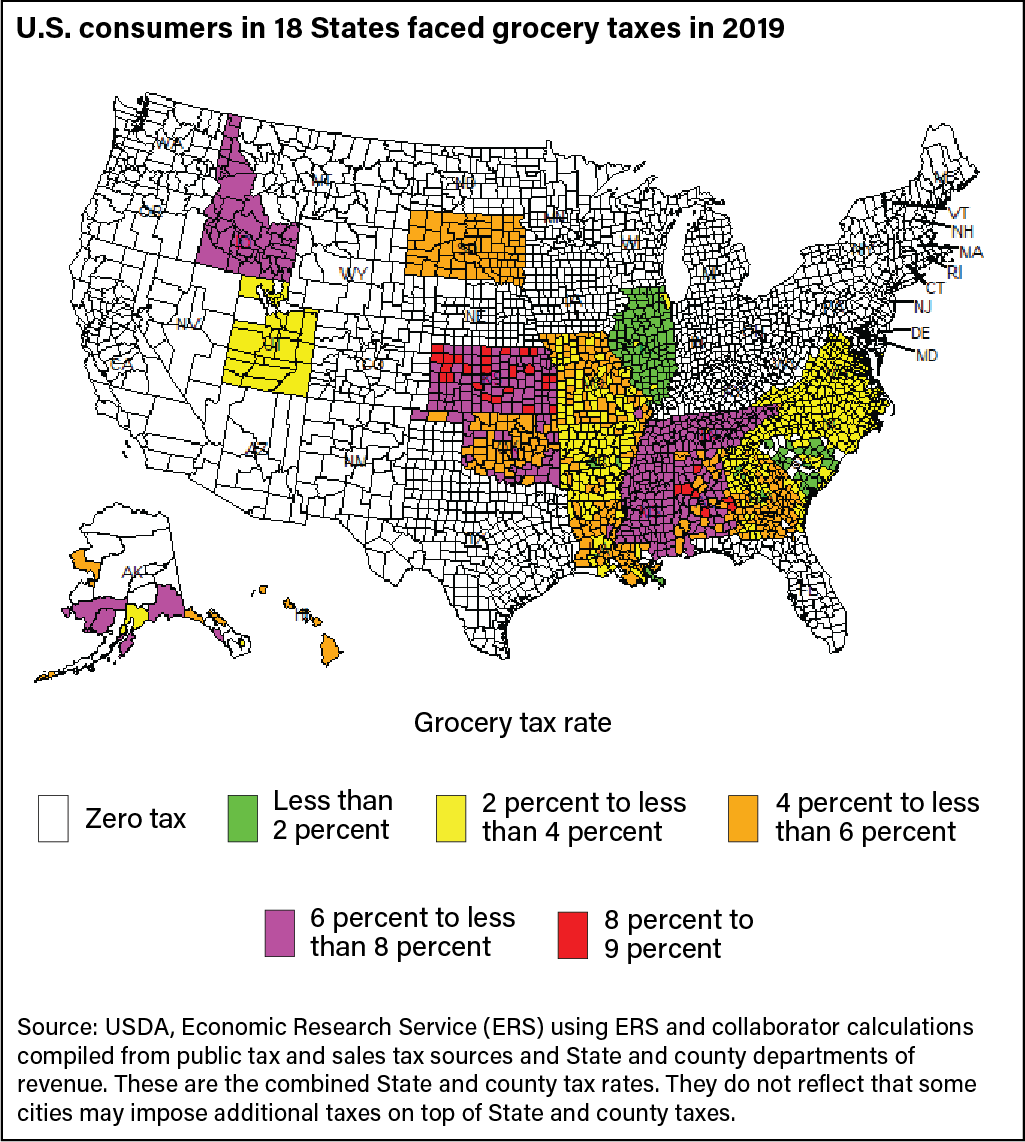
A map of the United States showing States and counties that tax groceries by tax rate in 2019.
Official websites use .gov
A .gov website belongs to an official government organization in the United States.
Secure .gov websites use HTTPS
A lock (
) or https:// means you’ve safely connected to the .gov website. Share sensitive information only on official, secure websites.
President Trump has made it clear he wants to keep the government open and support those who feed, fuel, and clothe the American people.
A map of the United States showing States and counties that tax groceries by tax rate in 2019.