
China’s imports of wheat fluctuated from 2000 to 2020, always falling short of the tariff-rate quota
- by Fred Gale
- 12/7/2021
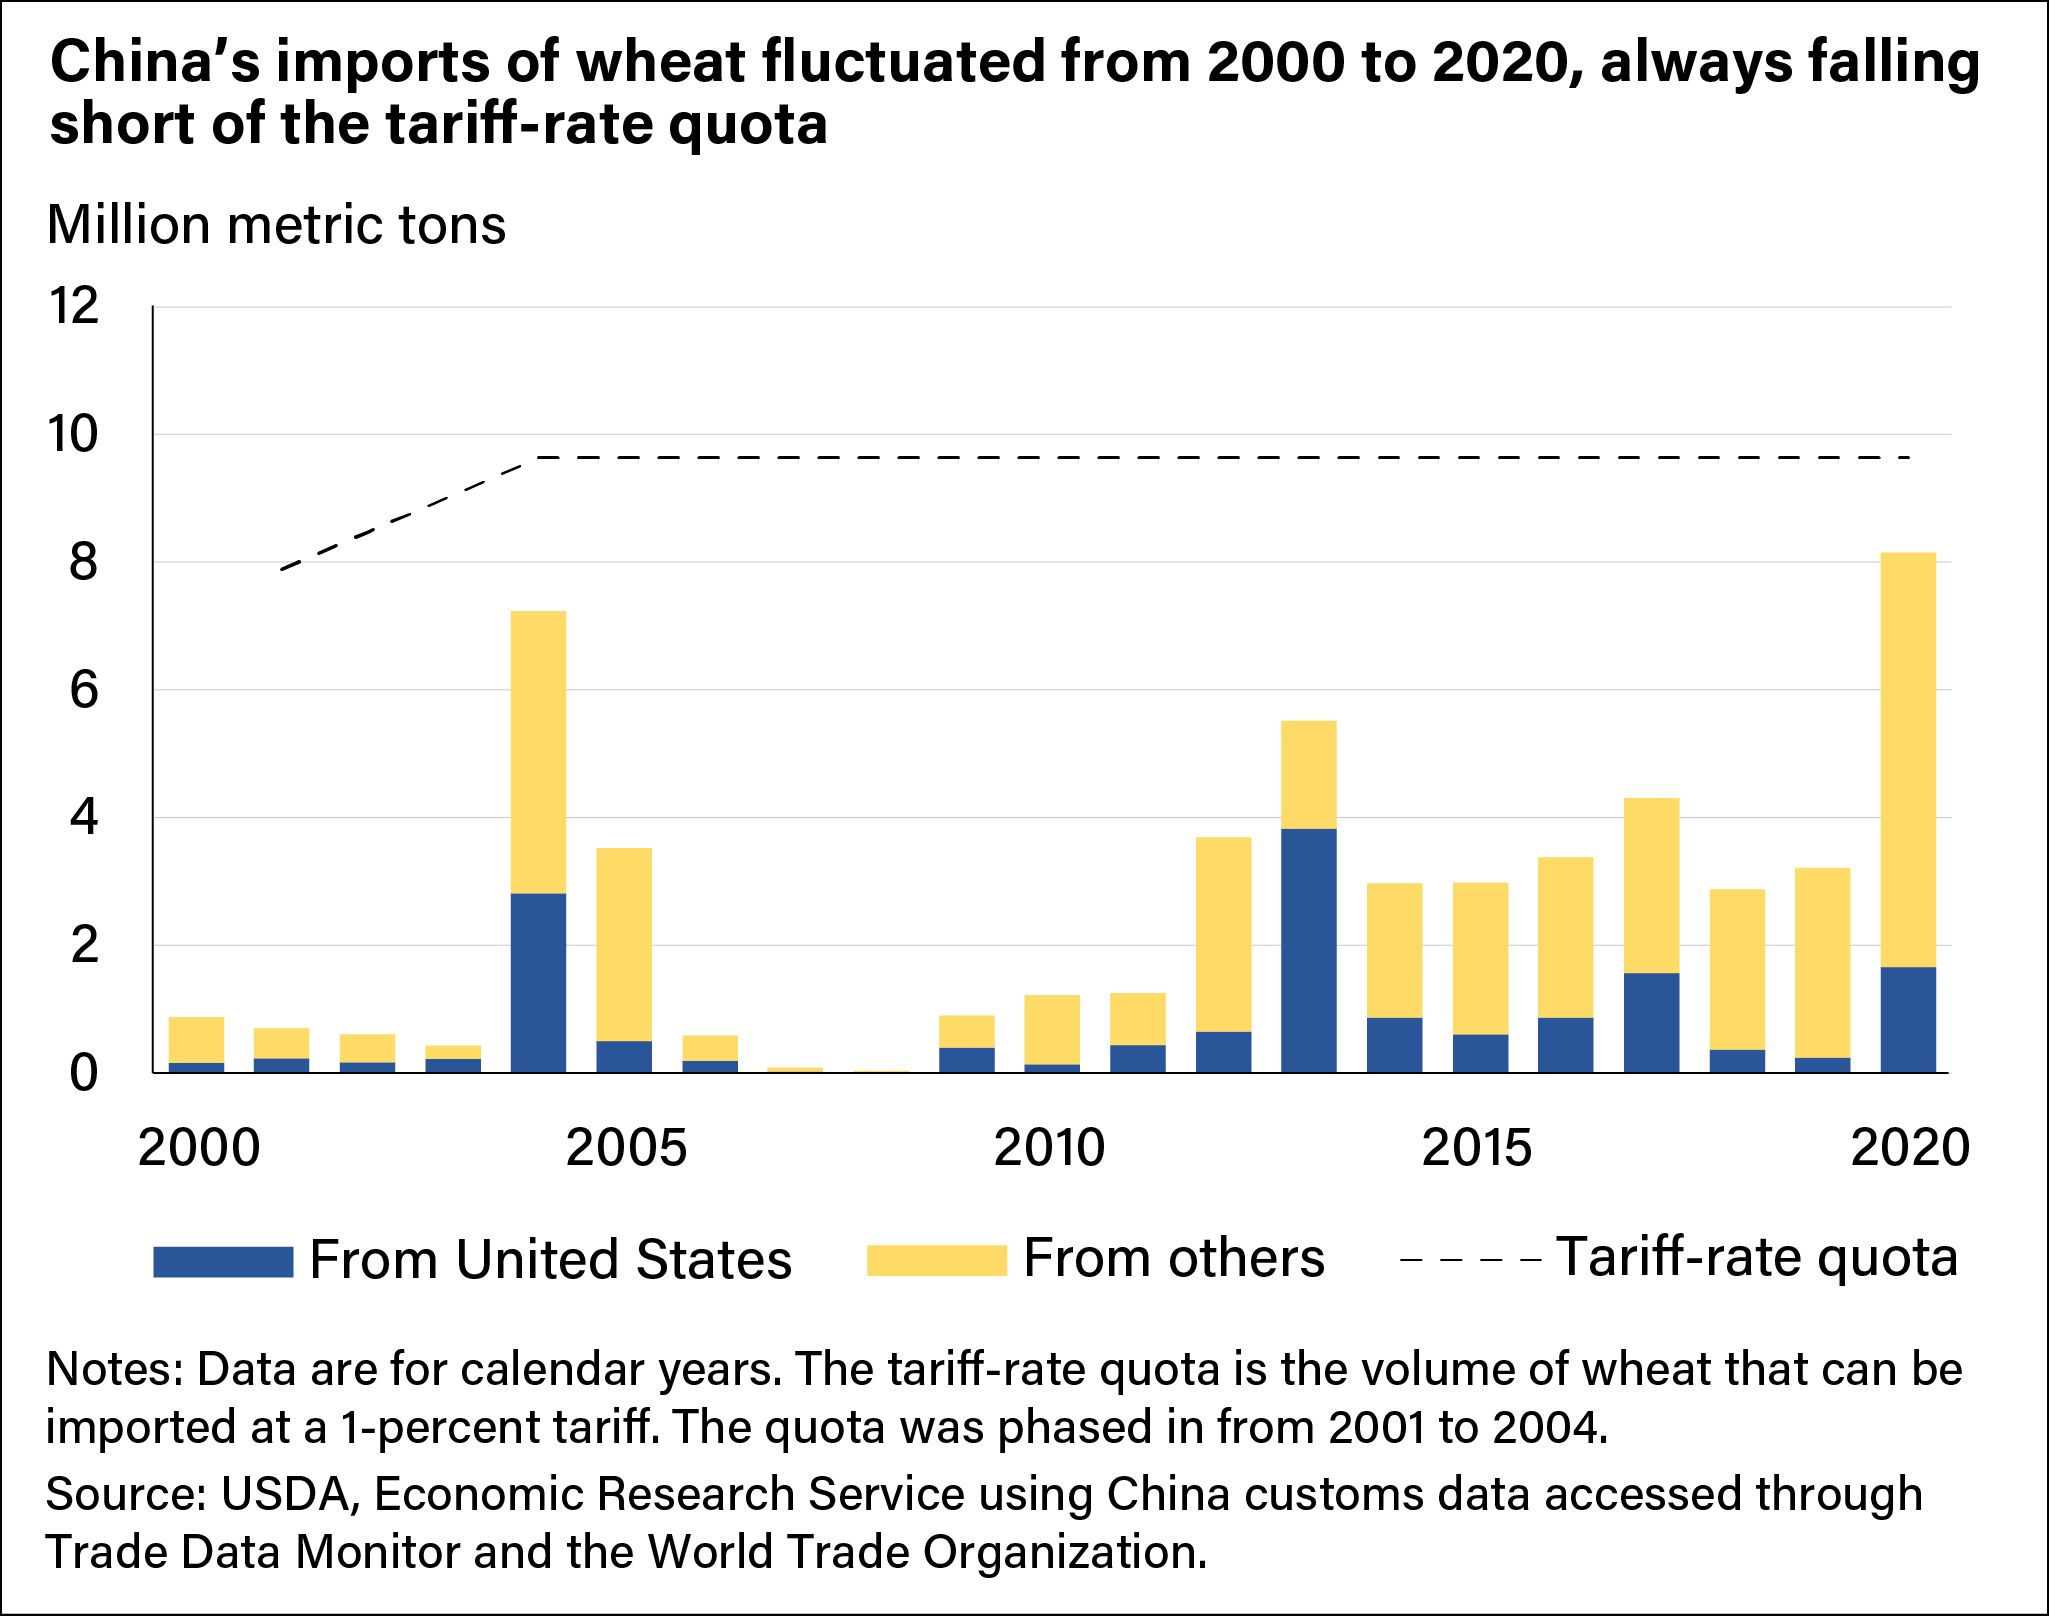
A stacked vertical bar chart showing how much wheat in million metric tons China imported from the United States and other countries from 2000 to 2020 compared to China’s tariff-rate quota.