
Nearly half of U.S. States lost population in rural areas in 2010-20, according to U.S. census data
- by Austin Sanders
- 11/15/2021
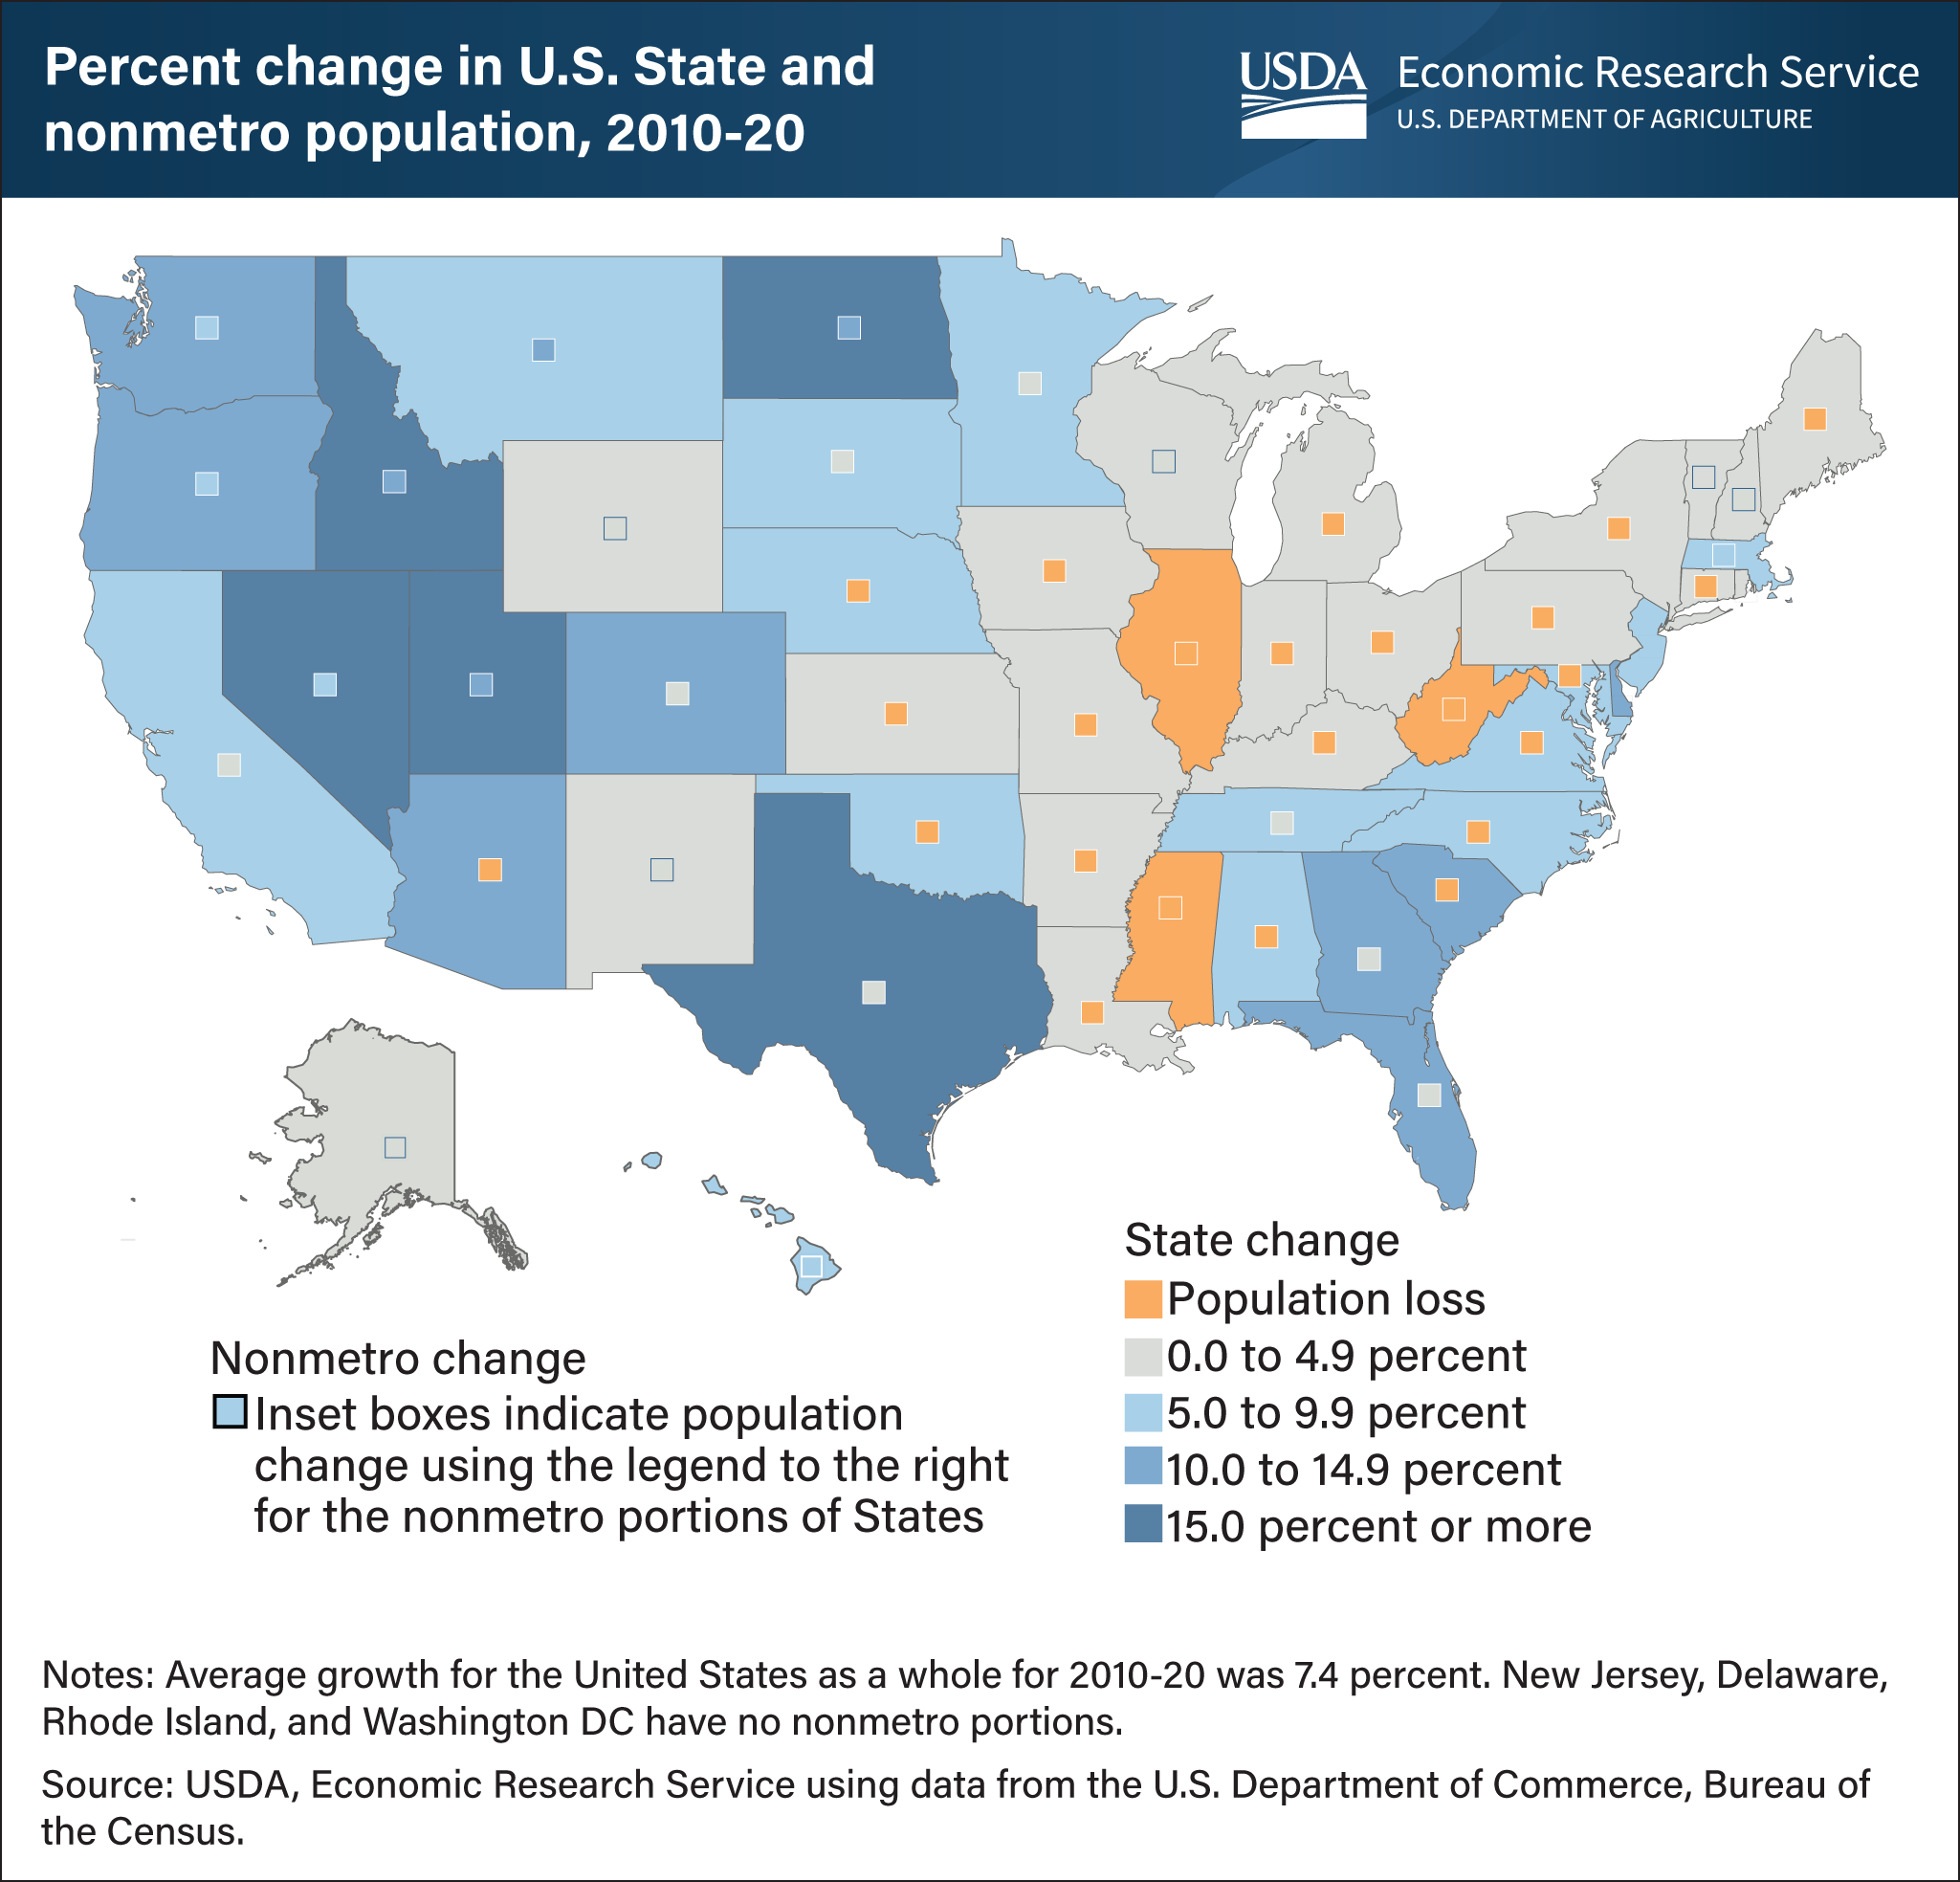
During the decade from 2010-20, 24 States lost population in nonmetropolitan, or rural areas, according to the 2020 U.S. census. Sixteen of those States lost population overall or showed slow population growth (less than 5 percent) during the period. Data from the 2020 census show the U.S. population grew 7.4 percent from 2010 to 2020, slower than the 9.7 percent growth in the previous decade. West Virginia, Mississippi, and Illinois lost population in the most recent decade, with the population declining the most in West Virginia at 3.2 percent. West Virginia also was the only State to lose population in metropolitan areas as well as in nonmetro areas. The highest-population growing State from 2010 to 2020 was Utah at 18.4 percent, and Idaho, Texas, North Dakota, and Nevada also showed population growth of 15 percent or more. This map uses data from the USDA, Economic Research Service’s State Fact Sheets data product, updated in November 2021.