
Share of food-away-from-home spending plunged in 2020
- by Eliana Zeballos and Wilson Sinclair
- 10/4/2021
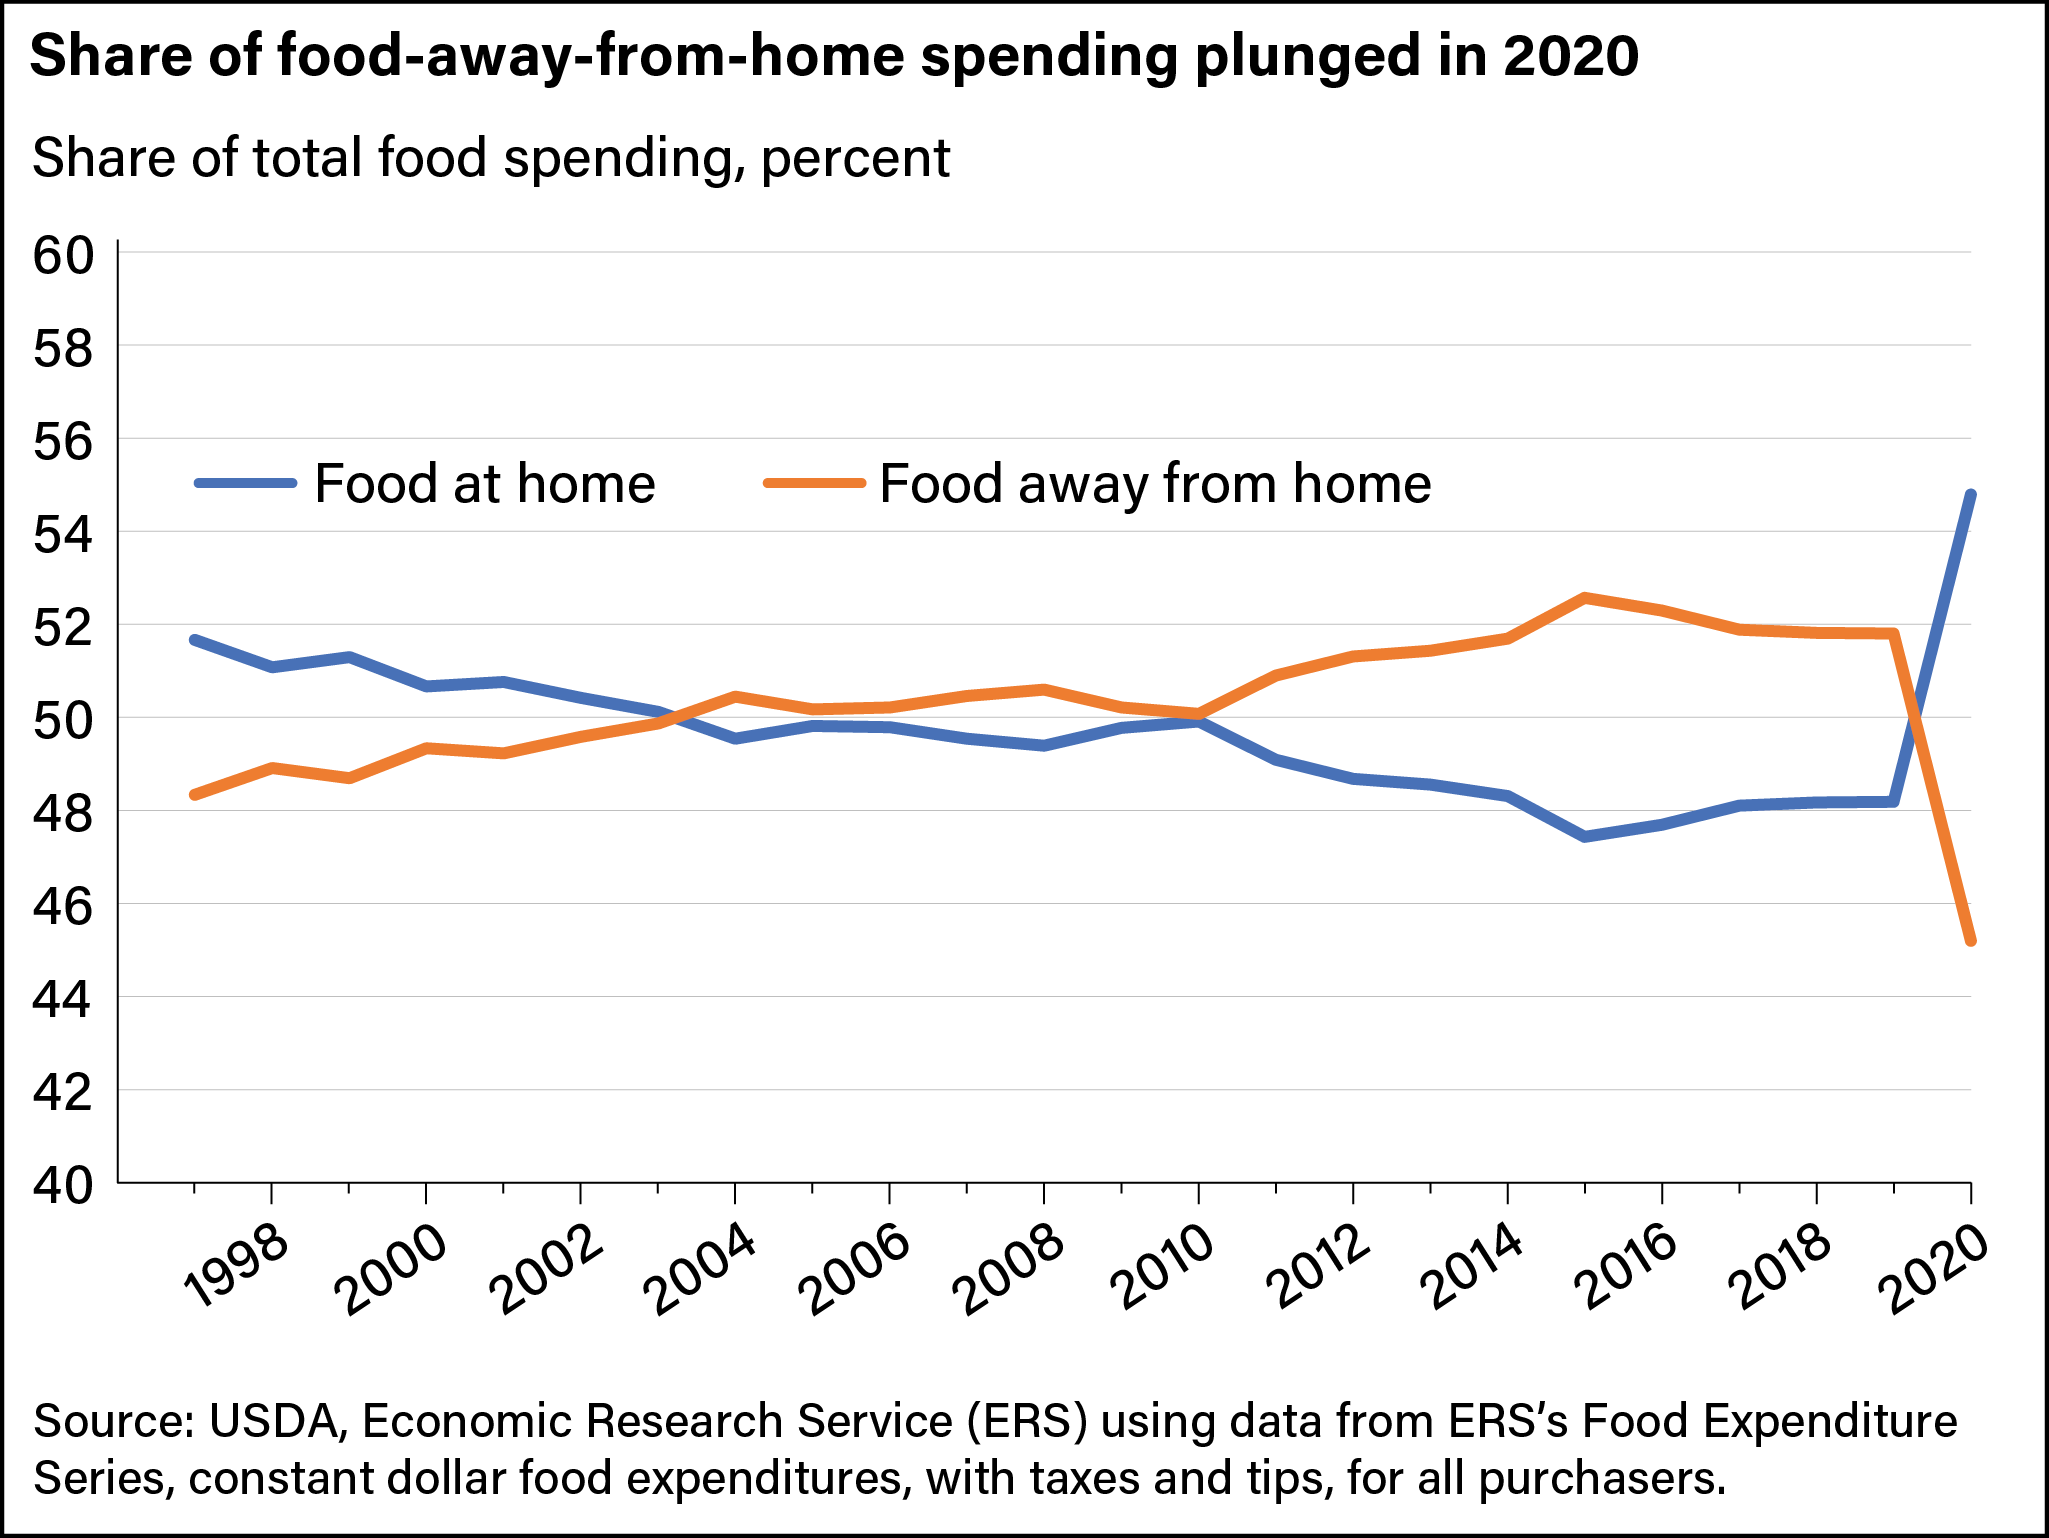
A line chart showing the percentage of food consumed at home compared with food consumed away from home from the years 1997 through 2020.