
Larger U.S. dairy farms tend to be more profitable than smaller dairy farms
- by James M. MacDonald
- 6/1/2021
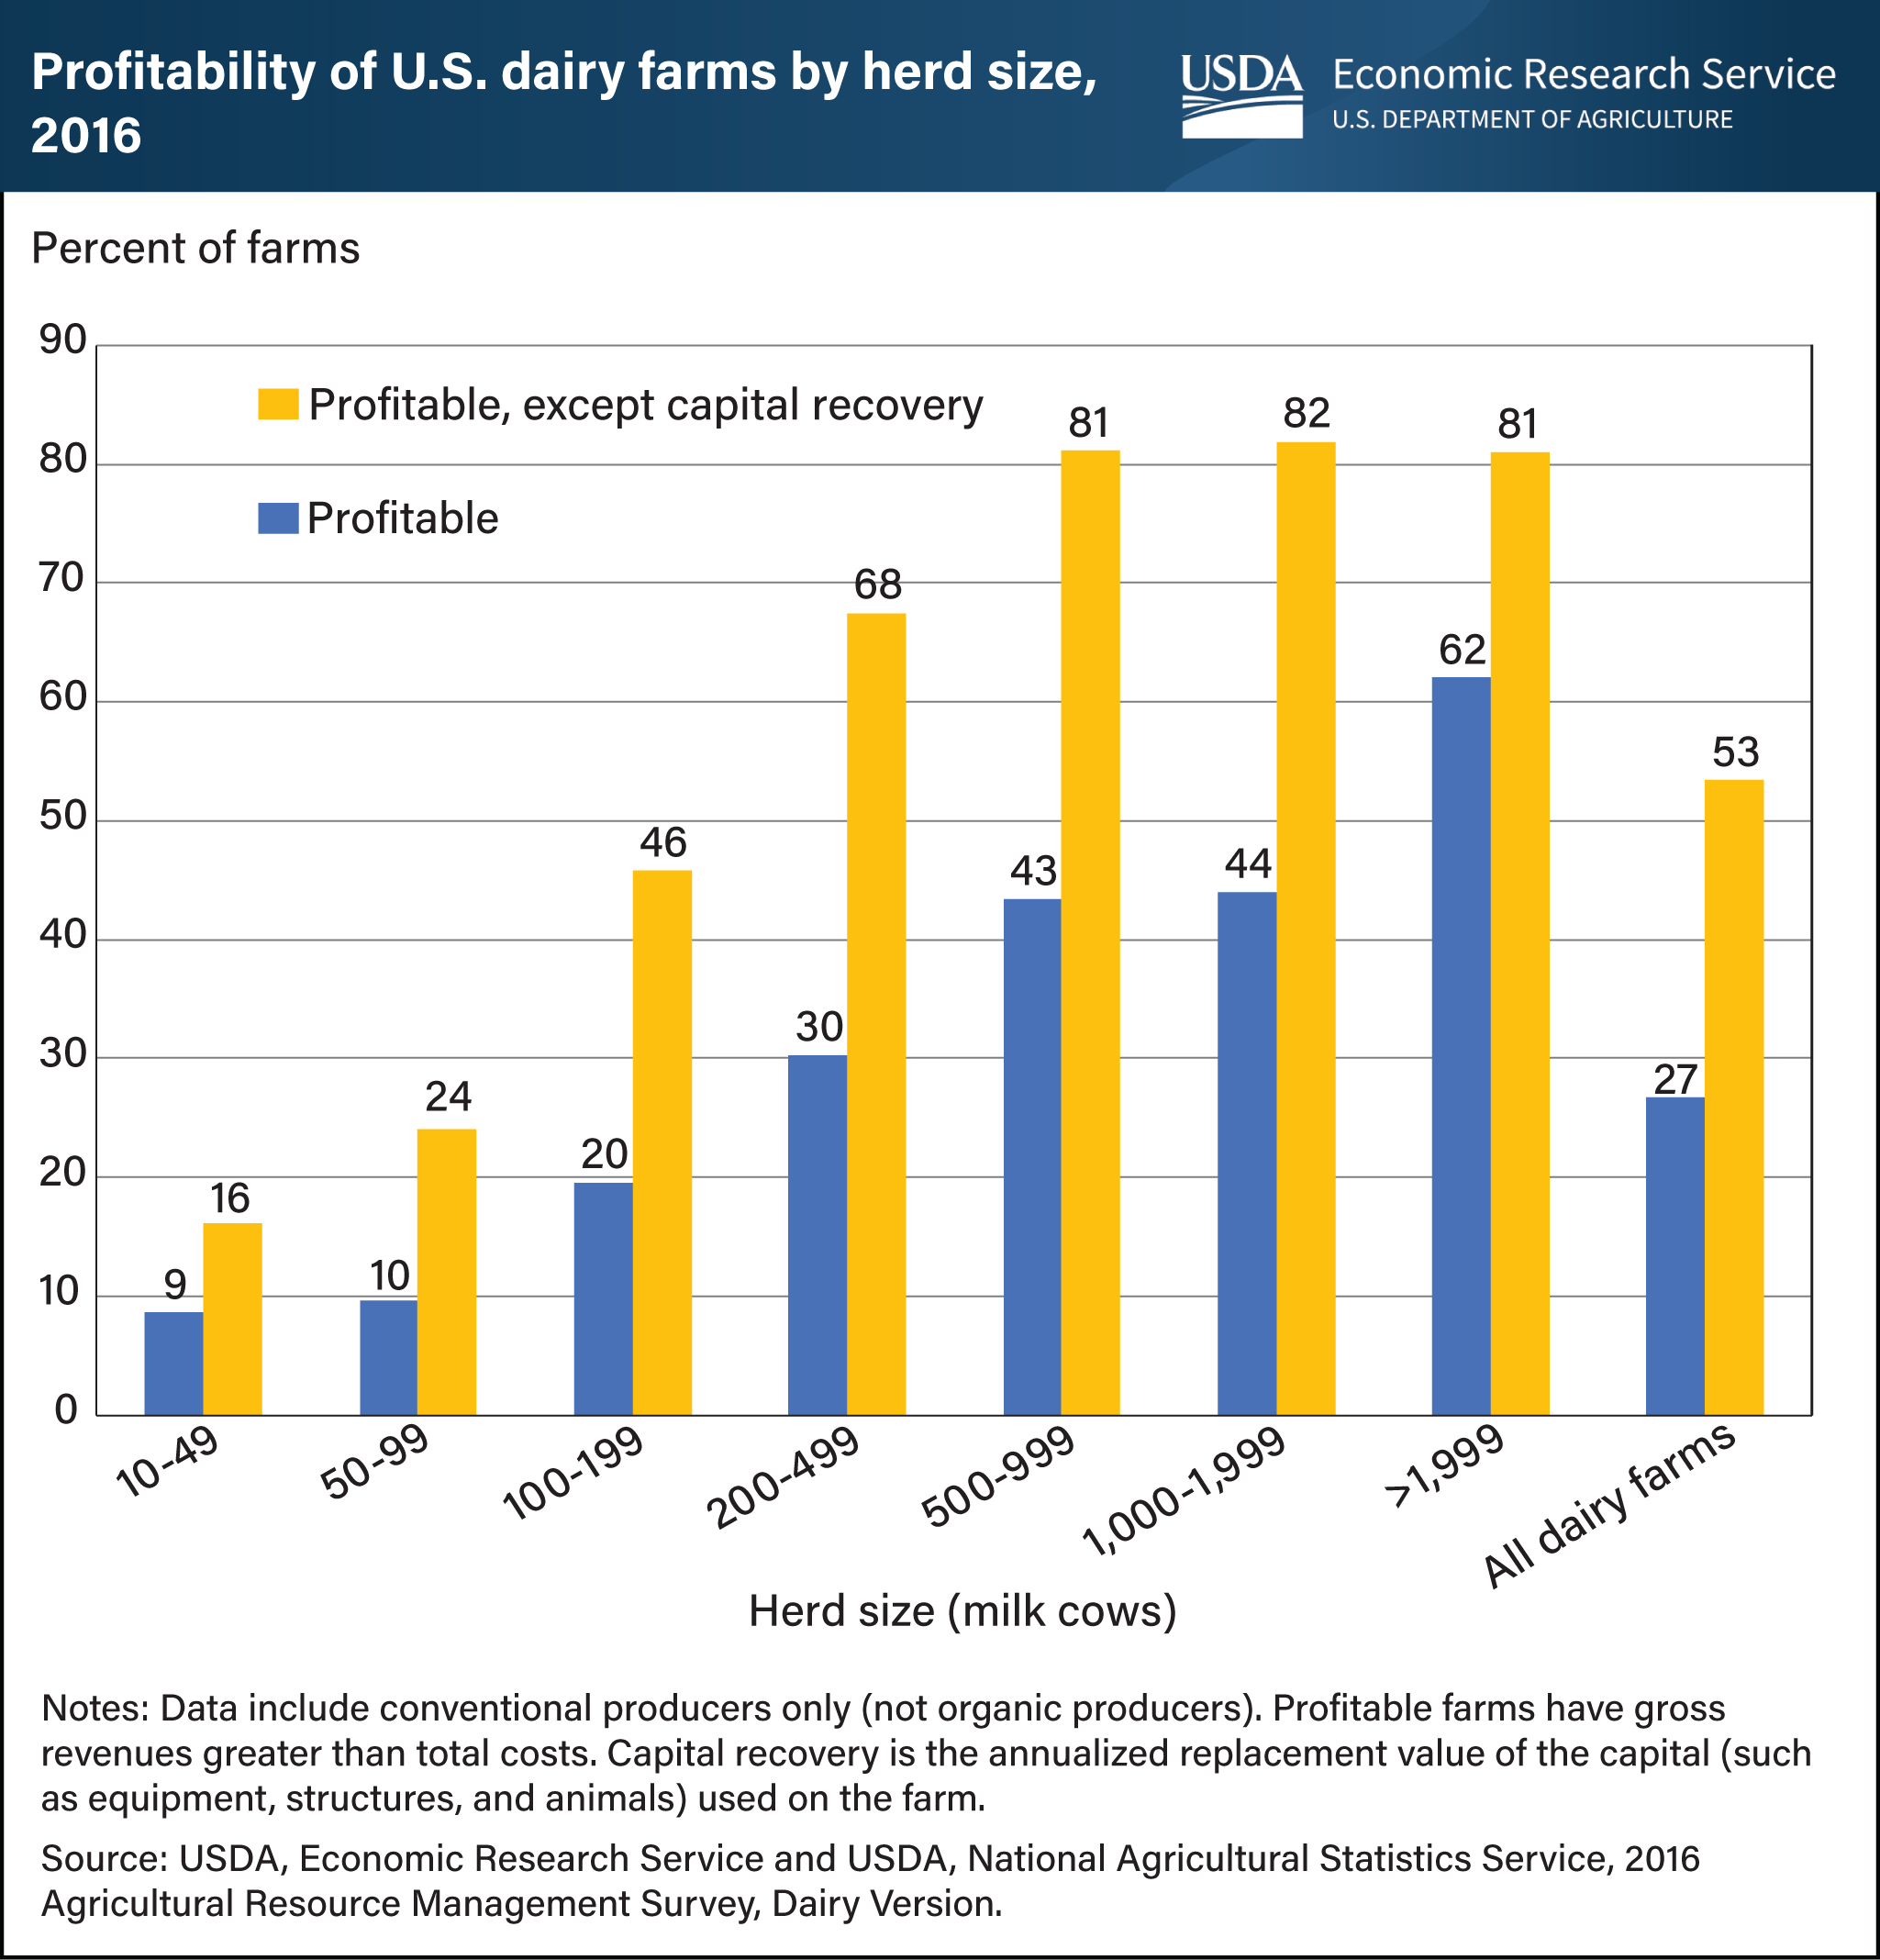
According to the most recently available data, in 2016, 62 percent of U.S. dairy farms with at least 2,000 cows generated gross returns that exceeded total costs, compared with 43 to 44 percent of farms in the two next-largest classes (500-999 cows and 1,000-1,999 cows). In the smallest classes (10-49 cows and 50-99 cows), less than 10 percent of farms generated positive net returns. Total costs include cash expenses such as those for feed, fuel, and hired labor, but they also include estimates of the costs of the farm’s capital and of the family labor provided to operate the dairy farm. A farm that does not cover total costs can continue to operate, and to provide a living for the family operating the farm, if it covers cash expenses and the costs of the family’s labor (total cost except capital recovery). For example, while about 20 percent of farms with 100-199 cows earned positive net returns in 2016, 46 percent earned enough to cover all cash expenses and to provide a living for the farm family. However, these farms did not earn enough to cover annual costs of capital recovery (the replacement value of the capital, such as equipment and structures, used on the farm). Continued operation makes financial sense for those farms until the cash expenses of maintaining an aging plant rise enough to cut into the family’s income from dairy farming. This chart appears in the Economic Research Service report Consolidation in U.S. Dairy Farming, released July 2020. It also appears in the August 2020 Amber Waves feature, Scale Economies Provide Advantages to Large Dairy Farms.