
Nonmetro areas faring better than metro areas in recovery from pandemic’s lowest employment levels
- by John Pender
- 5/28/2021
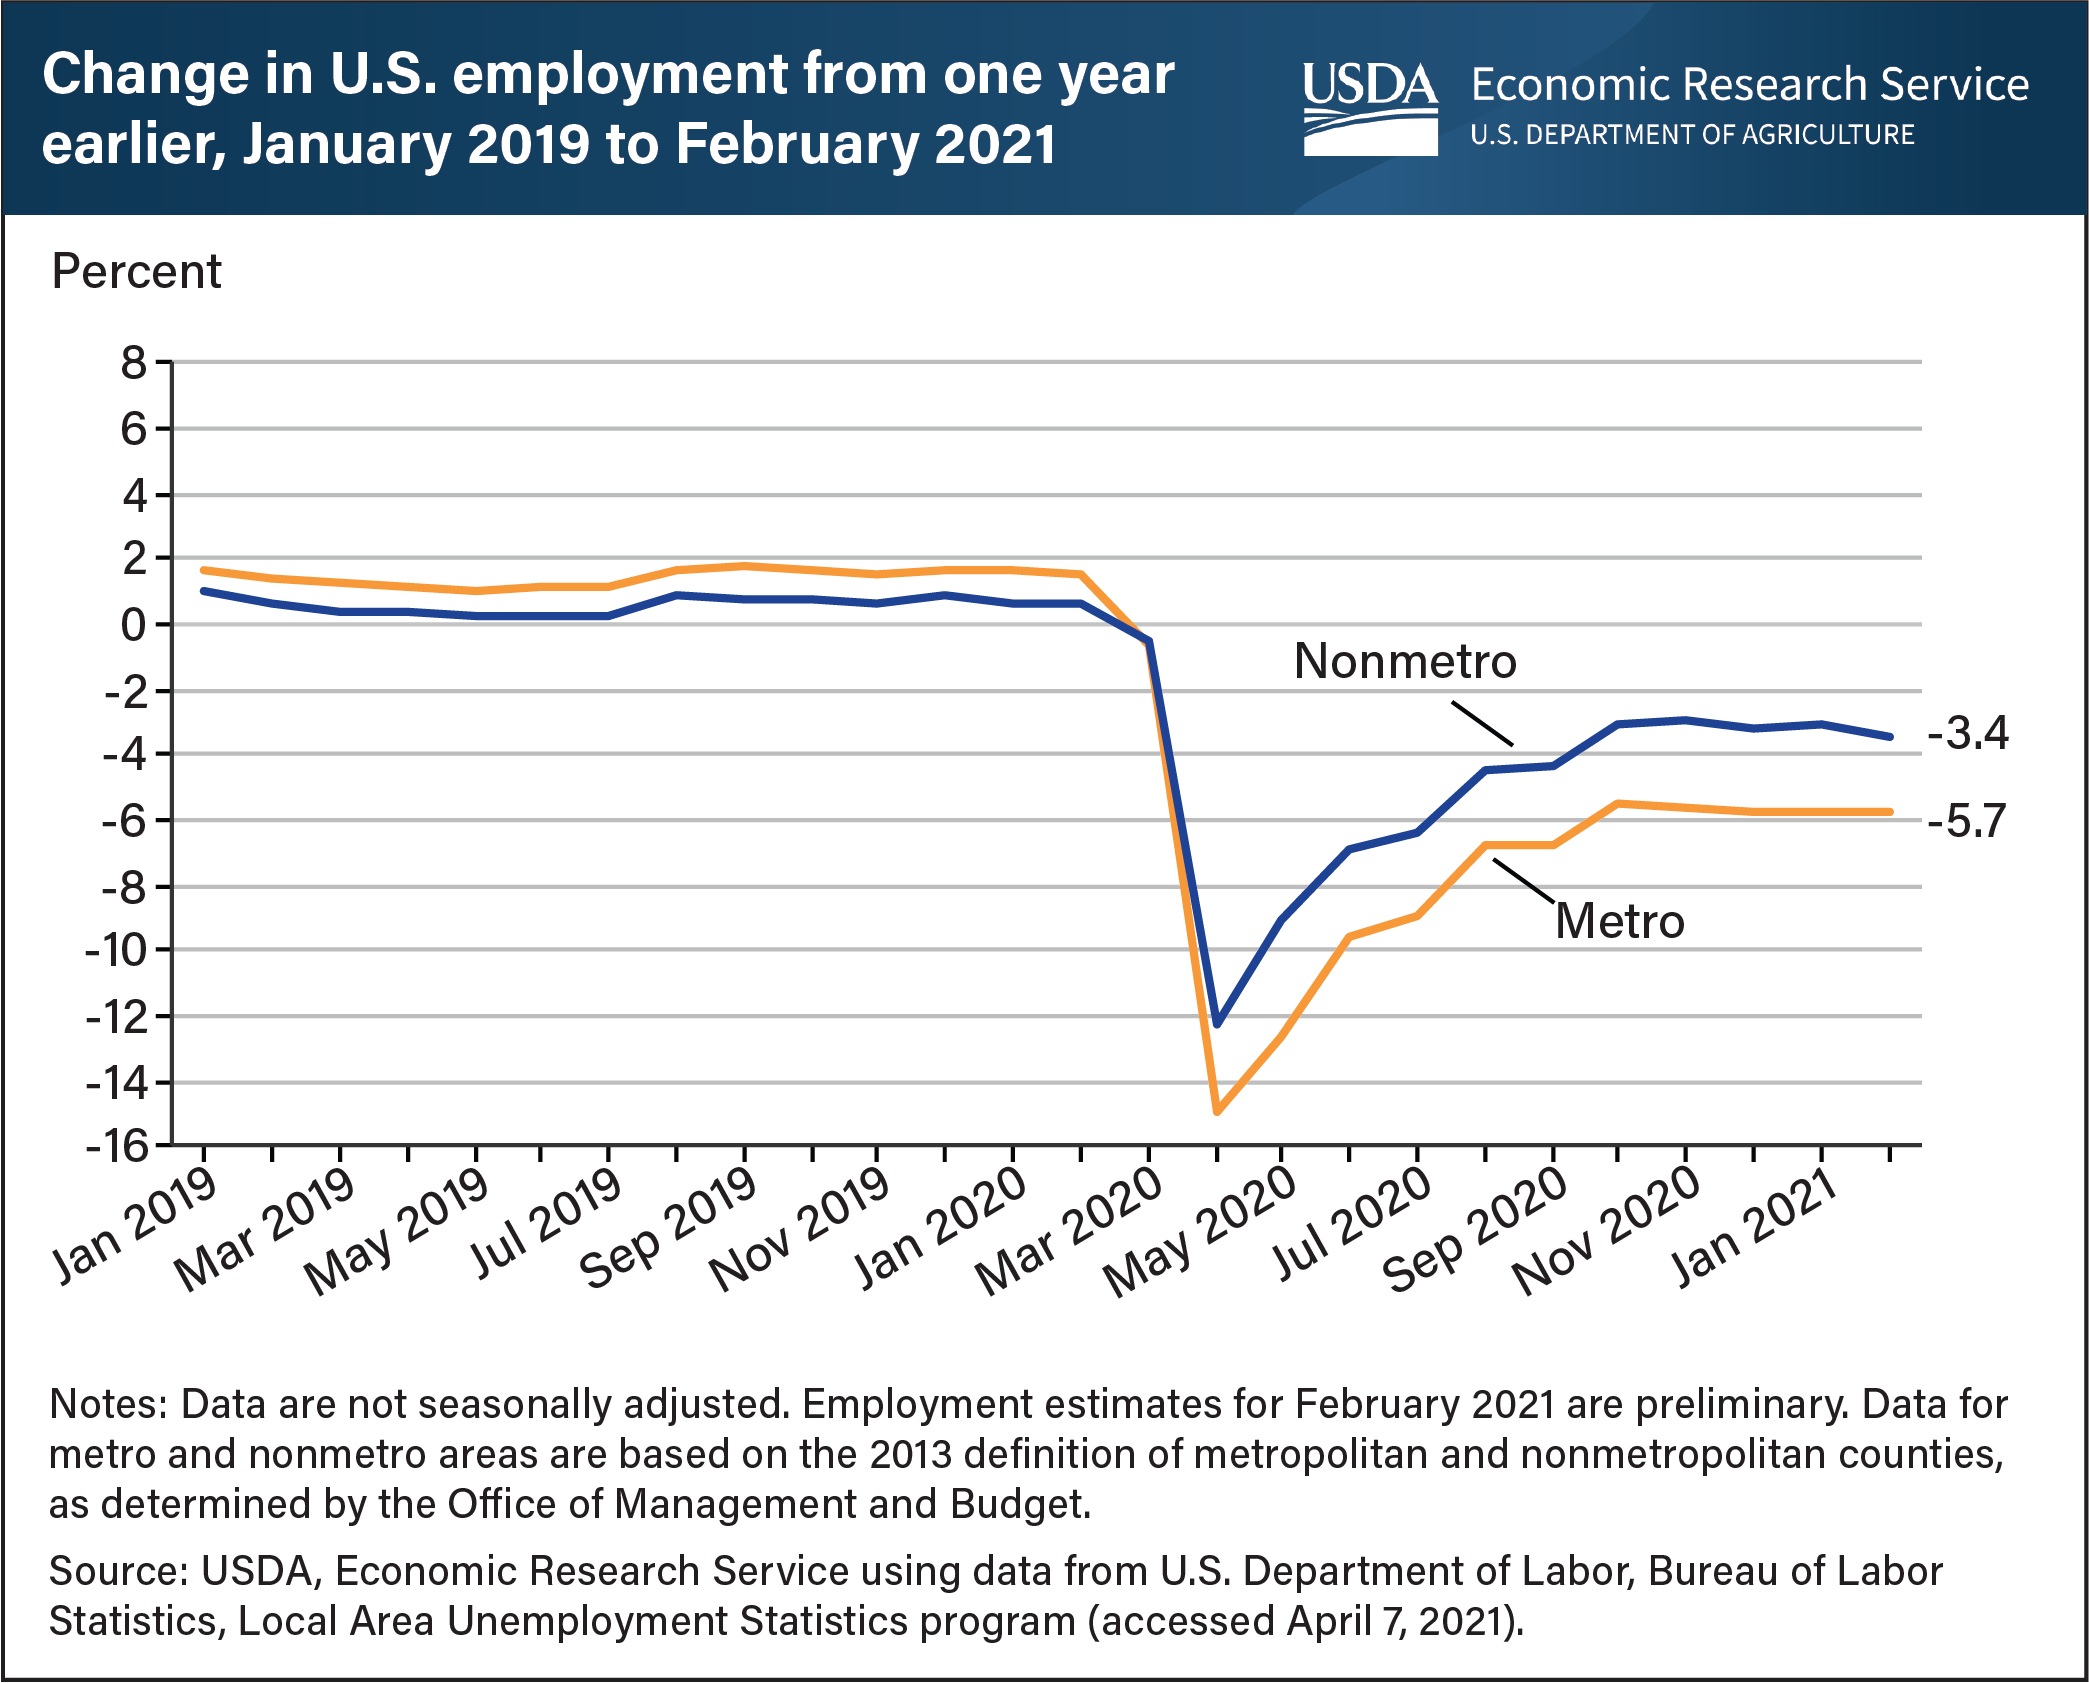
Early during the Coronavirus (COVID-19) pandemic, U.S. employment fell at rates not seen since the Great Depression, with the greatest declines occurring in metro areas. Before the pandemic, employment growth in metro areas had averaged 1.4 percent per year for the 12 months prior to March 2020, more than twice the rate in nonmetro areas (0.6 percent per year). After March 2020, the situation reversed. In April 2020, metro employment was 15.0 percent below 12 months earlier, while nonmetro employment was 12.2 percent lower. Employment has since largely recovered in both metro and nonmetro areas but remained lower in February 2021 than levels 12 months earlier. The extent to which employment was still depressed in February 2021 is greater in metro areas: Metro employment was 5.7 percent lower in February 2021 than in February 2020, while nonmetro employment was 3.4 percent lower. This chart appears in the Economic Research Service topic page, The COVID-19 Pandemic and Rural America, updated May 2021.