
Change in agricultural total factor productivity by State, 1960–2015
- by Sun Ling Wang
- 11/22/2024
Download chart image | Chart data
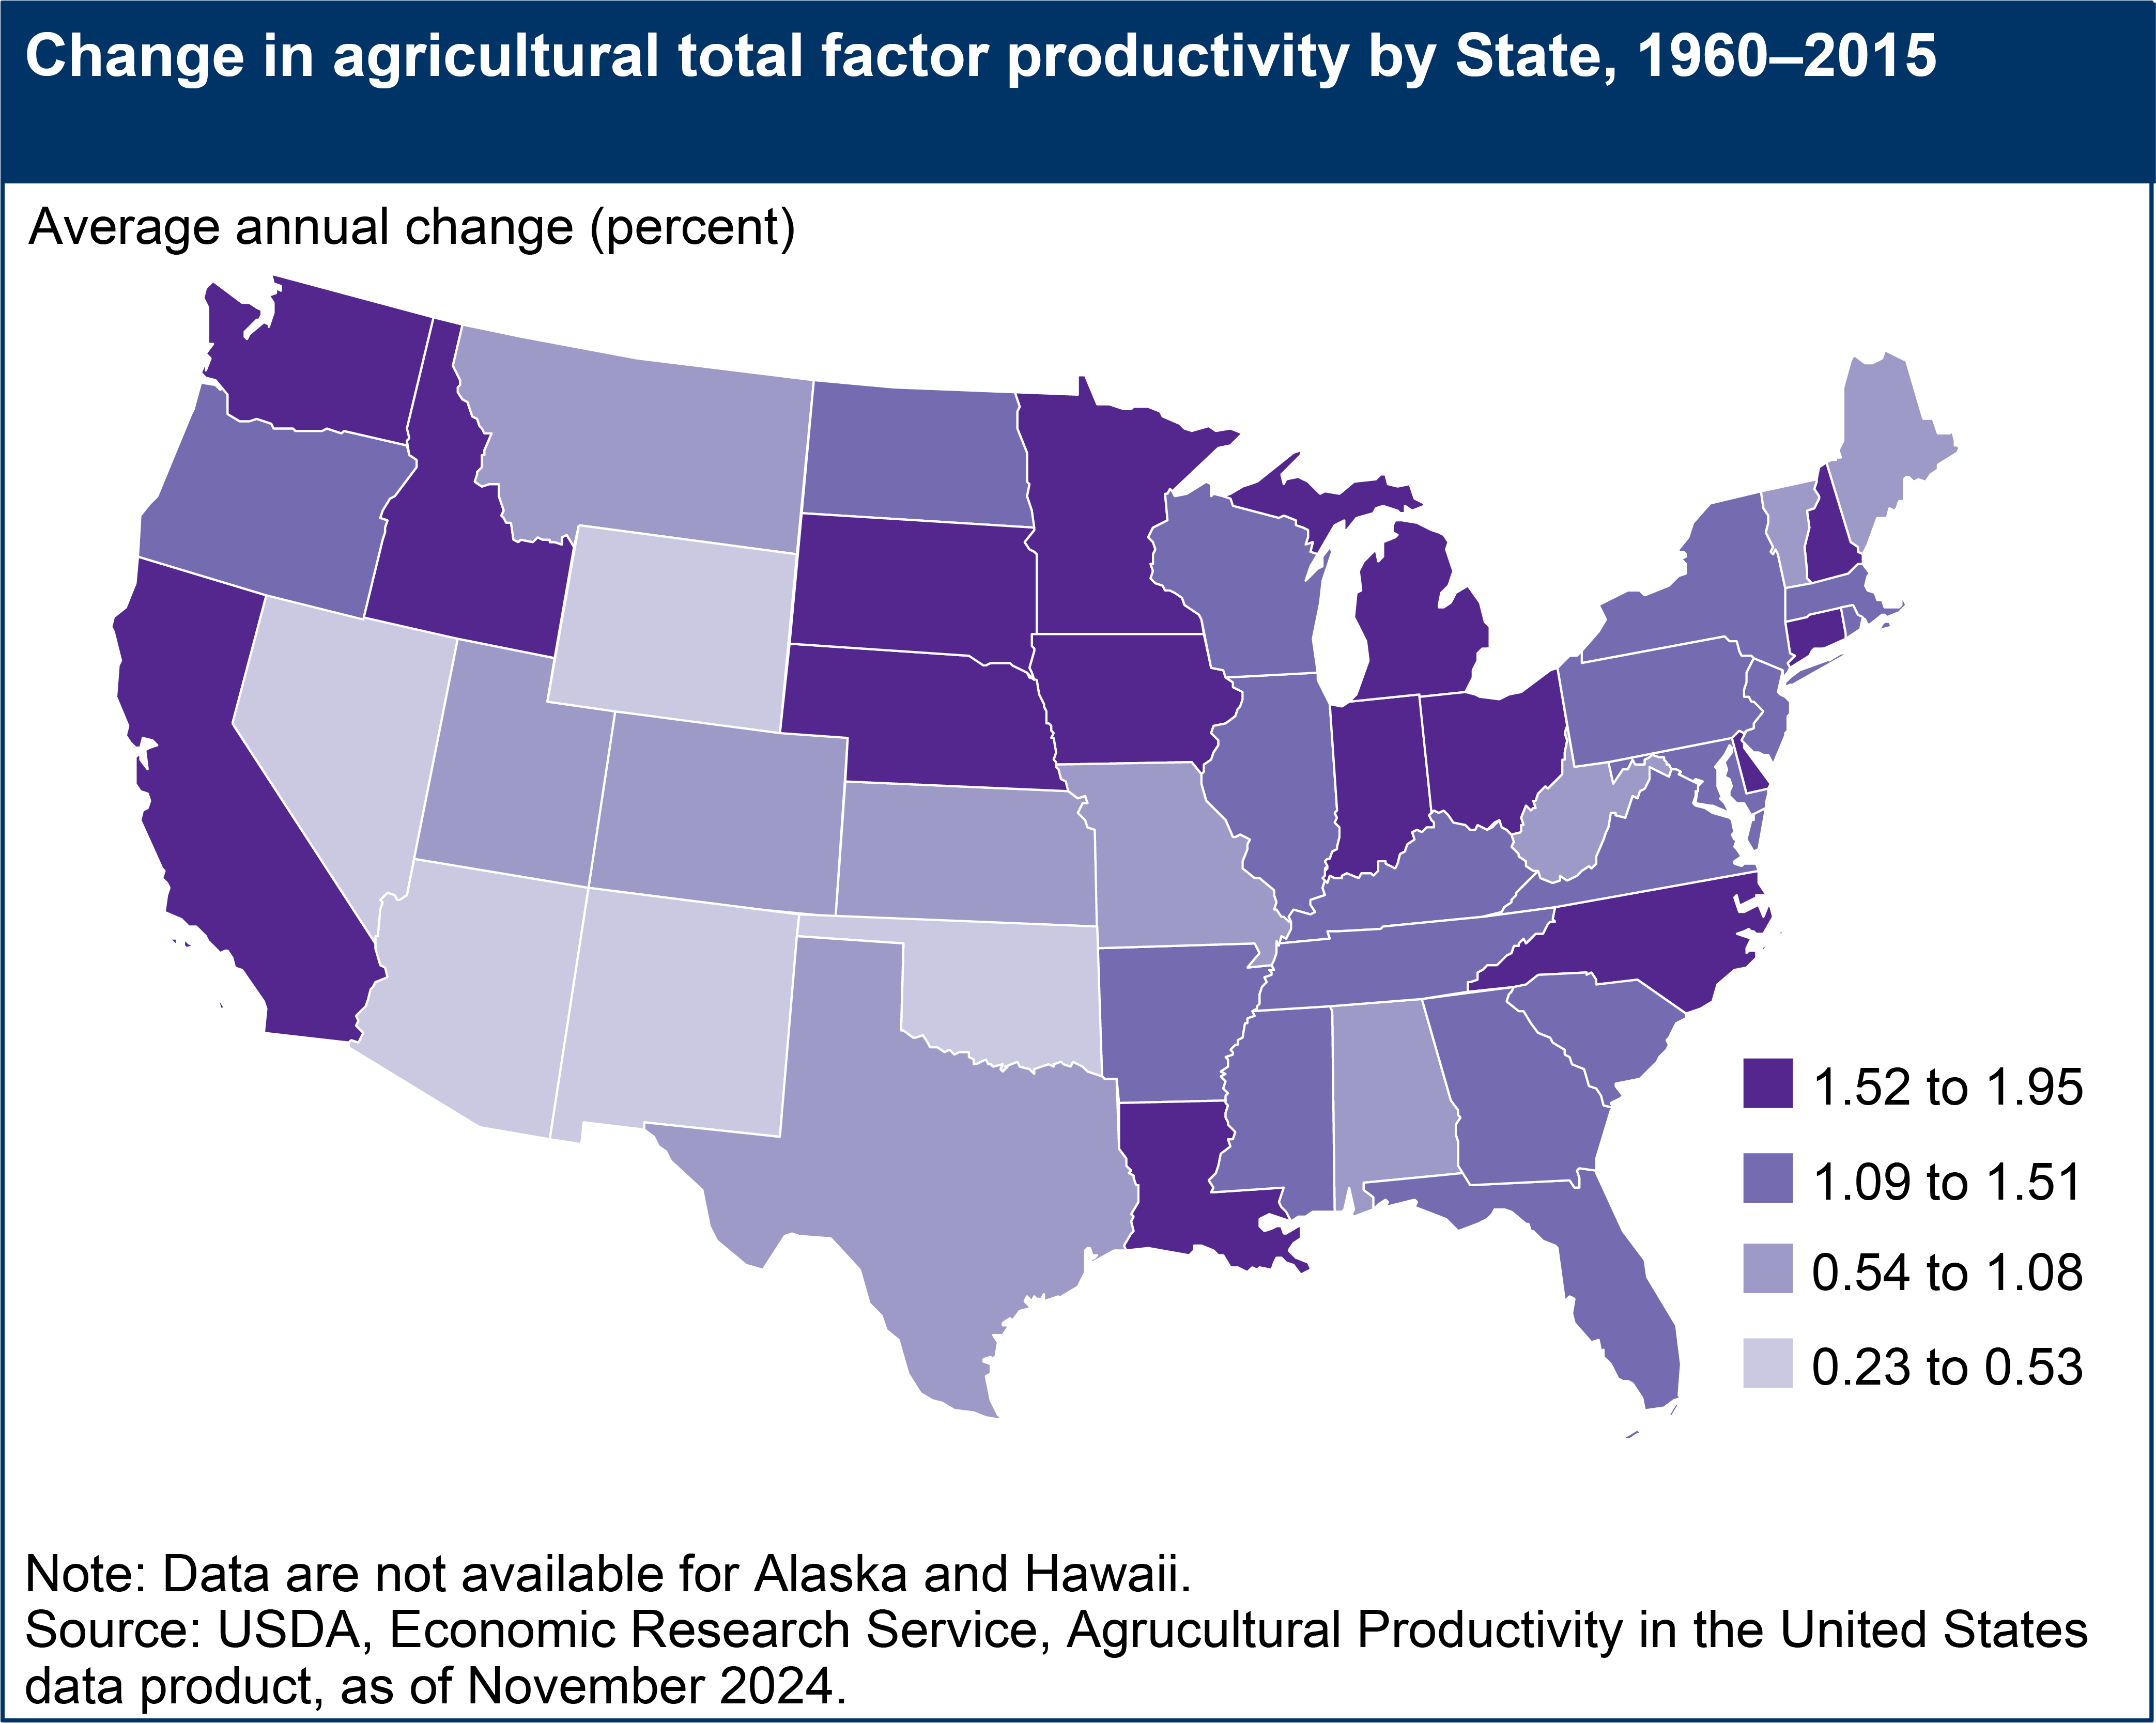
Change in agricultural total factor productivity by State, 1960–2015. Average annual change in agricultural total factor productivity ranges from 0.23 to 1.95 percent over the 1960 to 2015 period.