
The information here is excerpted or adapted from the August 2023 report, Characterizing Rugged Terrain in the United States (ERR-322).
- Background
- Data Sources
- Scope/Coverage of Data
- Methods
- Strengths and Limitations
- Additional Resources
- Recommended Citation
Background
Rugged terrain, defined here as any location with significant variation in elevation, is found in diverse forms across the United States. It is a critical landscape component that influences the economic vitality of communities in complex and often contradictory ways. The USDA, Economic Research Service’s (ERS) Area and Road Ruggedness Scales data product serves as a resource for researchers, Federal agencies, policymakers, and practitioners working to better understand and address issues of rural development, demographic change, and individual and community well-being related to rugged terrain. This data product builds upon USDA, ERS's longstanding work on geographic classifications.
Natural amenities have long been understood as critical place characteristics that draw new residents and jobs to specific rural areas and rugged terrain is one such aspect. Since 1993, USDA, ERS has included measures of mountainous terrain in different versions of a county-level natural amenities scale, along with measures of climate and access to bodies of water. The current USDA, ERS Natural Amenities Scale combines qualities of climate, access to bodies of water, and a measure called topographic variation (see the USDA, ERS report, Natural Amenities Drive Rural Population Change, AER-781, October 1999).
To create the measure, McGranahan (1999) drew on topographic data from a U.S. Department of the Interior, U.S. Geological Survey (USGS) map depicting landforms (e.g., plains, hills, and mountains) and an indicator of variability within each landform. Although delineated at a different scale (counties as opposed to census tracts), the underlying concept was similar to the concept of rugged terrain presented here, with the idea that "…the more variable the topography, the more appealing the setting" (McGranahan, 1999).
Understanding the role of rugged terrain as a hindrance to settlement and travel requires a different measure. First, the new indicator needs to be based on a more geographically detailed analysis of local-scale differences in elevation and able to depict rugged terrain in specific locales and along specific road networks. Second, the new indicator needs to be flexible, allowing for it to be aggregated to larger geographic units (e.g., census tracts) that are used in definitions of rurality (e.g., USDA, ERS's Rural-Urban Commuting Area codes). Third, the new indicator needs to be statistically consistent, using a methodology that ensures local variation in elevation is measured consistently in all locations.
The Area Ruggedness Scale (ARS), Road Ruggedness Scale (RRS), and the grid-cell-level Terrain Ruggedness Indices (TRIs) that underlie them meet these requirements. Together they provide robust indicators of the characteristics of landscape that benefit communities, as well as those that present an impediment to settlement and travel and, therefore, accessibility to services for people residing in mountainous areas.
Data Sources
The ARS and RRS are calculated using two data sources. The first is the 7.5 arc-second resolution, Global Multi-resolution Terrain Elevation Data 2010 (GMTED2010) from U.S. Department of the Interior, U.S. Geological Survey and U.S. Department of Defense, National Geospatial-Intelligence Agency. The second is the vintage 2010 census tract TIGER (Topographically Integrated Geographic Encoding and Referencing)/Line boundary files from the U.S. Department of Commerce, Bureau of the Census. Additionally, ESRI’s ArcGIS StreetMap Premium 2021, North American Q3 road network data were used when creating the RRS. All road types in the dataset were used, including highways, arterial, collector, local, and semi-private roads. Finally, population, population density, land area, and rurality data for vintage 2010 census tracts are from USDA, ERS's Rural-Urban Commuting Area Codes data product.
Scope/Coverage of Data
Data are available for the vintage 2010 census tracts within the 50 States and Washington, DC.
Methods
Creating the Area Ruggedness Scale (ARS) and Road Ruggedness Scale (RRS) was a three-step process.
Step 1: Computing a Grid Cell Terrain Ruggedness Index
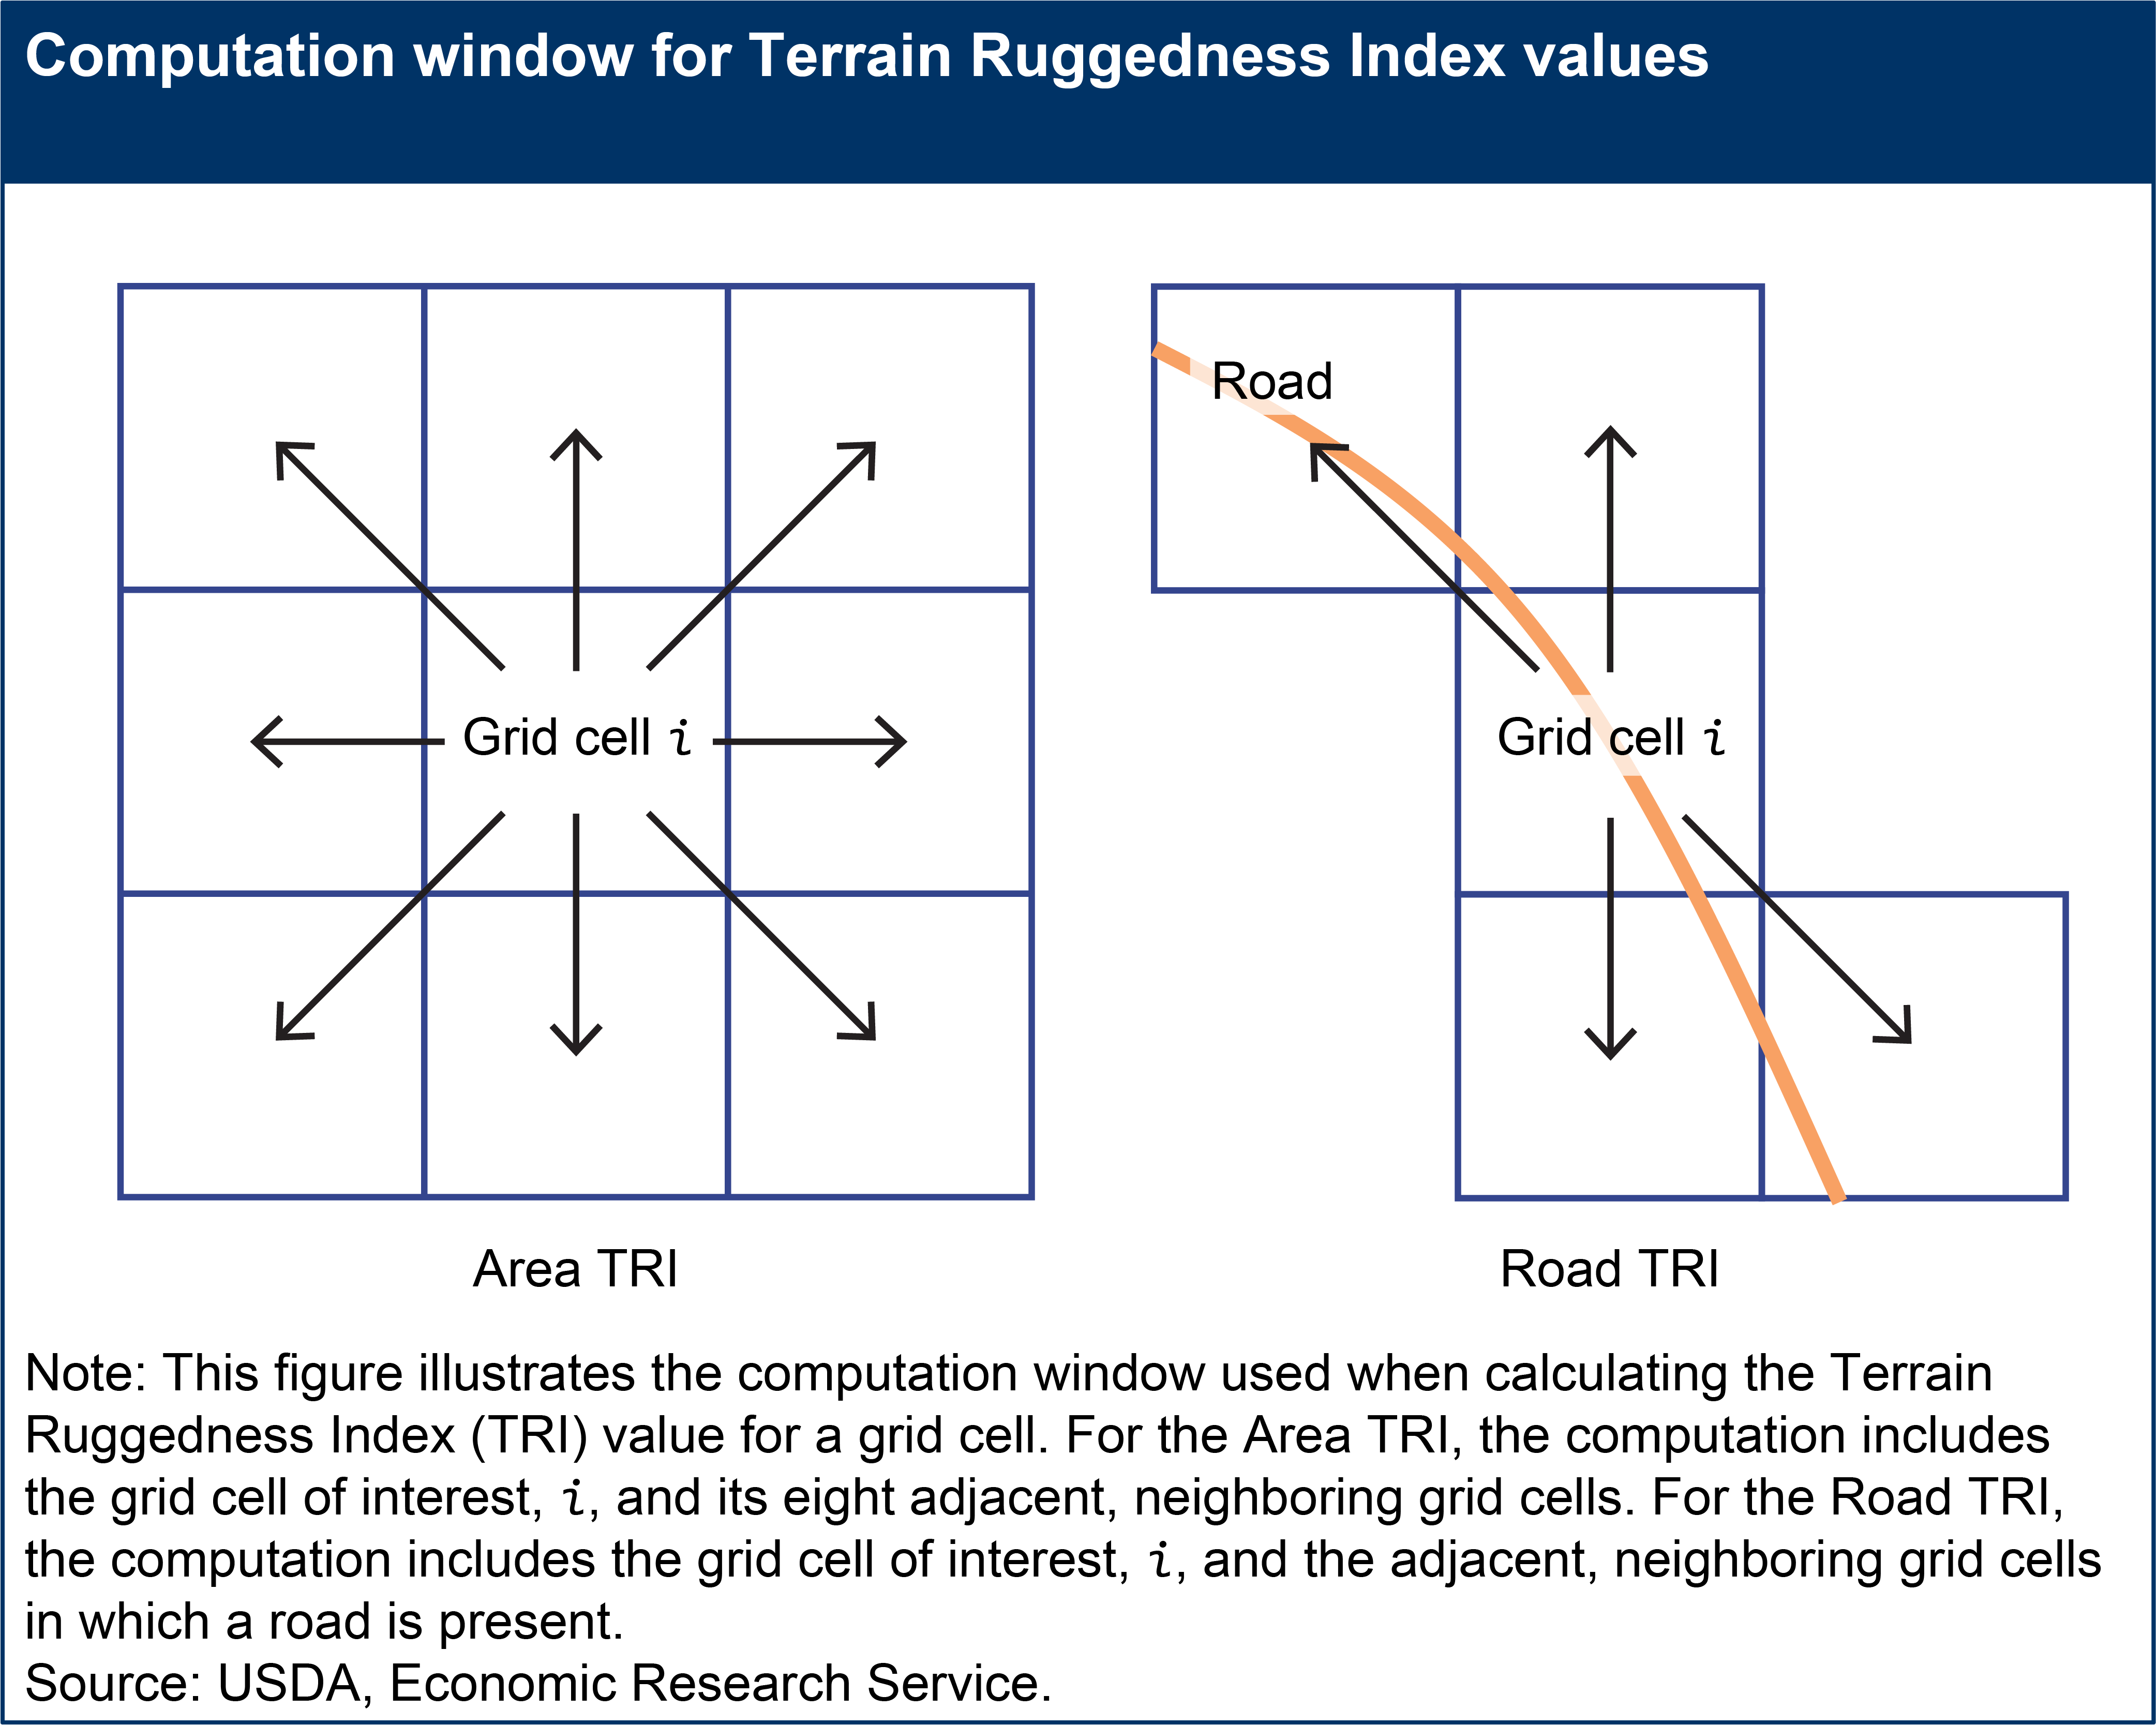
The ruggedness measures are based on the Terrain Ruggedness Index (TRI) developed by the Riley et al. (1999) article, A Terrain Ruggedness Index that Quantifies Topographic Heterogeneity. The TRI is calculated using data from a digital elevation model (DEM), a detailed representation of the Earth’s terrain at the scale of small, regularly spaced grid cells. A TRI value is computed for each grid cell by calculating "the sum change in elevation between [the given] grid cell and its eight neighbor cells," as illustrated below. Lower values indicate less change in elevation within the 3-by 3-grid-cell neighborhood, and higher values indicate areas with higher elevation differences.
Two sets of TRI values were calculated using grid cells that average 0.15 square miles in size, one including all territory (the Area TRI) and one including just those grid cells containing roads (the Road TRI). For the Area TRI, ruggedness values were calculated for all 263 million grid cells covering the United States. For the Roads TRI, ruggedness was measured using elevation data from the 47 million grid cells containing roads. Whereas the Area TRI value for a given grid cell was derived from a comparison with all eight neighbors (except on the edges of the grid), Road TRI values did not include values from a neighboring grid if that neighbor did not contain a road. We used all streets within the computation window, including highways, arterial, collector, local, and semi-private roads, when calculating the Road TRI, whether they intersect or not.
Step 2. Aggregating Grid Cells to Census Tracts
Although the grid-cell TRI values are helpful for research requiring detailed spatial information, many research and policy applications need values aggregated to larger geographic units, such as census tracts. Census tracts are the smallest geographic unit for which socioeconomic data are generally produced and provide a more accurate description of the variation in topography within an area than would larger geographic units, such as counties.
The Area and Road TRI values were aggregated to the 72,765 land-based vintage 2010 census tracts using the "Zonal Statistics as a Table" tool in ArcGIS Pro 2.9. This tool provided summary statistics based on the grid cells with centroids within the boundary of each census tract, as delineated by the 2010 census tract TIGER/Line shapefile.
The mean (average) was chosen as the most appropriate measure of ruggedness within a census tract to use when creating an ordinal scale as it accounts for the distribution of the grid-cell TRI values within each census tract, including very high (rugged) and very low (flat) TRI values. The mean Area TRI census tract values range from 0 to 243 meters and the mean Road TRI census tract values range from 0 to 135 meters. The Road TRI data have a lower maximum value because roads are constructed along paths of least resistance.
Step 3. Determining an Ordinal Scale of Ruggedness for Census Tracts
The aggregate census tract Area and Road TRI values are useful as continuous measures of variable topography. The detailed information they provide may be the preferred measure for certain types of research, such as regression analysis. However, classifying the census tract TRI values into a limited number of categories allows for easier statistical comparisons and mapping and, thus, a more comprehensible understanding of the degree of ruggedness as it varies across locations.
The method chosen to classify a continuous measure into a categorical scale should reflect the distribution of the underlying data rather than distort it. The mean Area and Road TRI measures have similar distributions across census tracts, pictured below. The distributions have many census tracts concentrated in a narrow range of lower TRI values (the "head" of the distribution) and far fewer census tracts falling in a wider range of higher TRI values (the "tail"). Put another way, there are many more census tracts that are relatively flat on average than those that are more rugged, with the more-rugged census tracts spanning a much larger range of values. Therefore, relatively more categories are needed across the higher range of values in the tail to distinguish among different levels of ruggedness. To create the categorical ARS and RRS, we employed the head/tail breaks classification method introduced by Jiang (Head/tail Breaks: A New Classification Scheme for Data with A Heavy-Tailed Distribution, 2013) for use with this specific type of distribution.

The head/tail breaks method uses an iterative process that first partitions data into two groups based on the mean, creating one group with a large number of low values below the mean and a second group of high values found above the mean, or in the tail. The method then partitions the tail into two groups around the mean value of this second group. It continues partitioning the remaining tail in this manner until the remaining set of values is no longer considered a heavy-tailed distribution (i.e., until the mean is more centrally located among the data values). Because partitioning depends on the underlying distribution of data values, the number of categories and range of values in each category are different for each dataset that is calculated using head/tail breaks. The resulting scales place more emphasis on differentiating among high values.
The Area Ruggedness Scale (ARS) is the categorization of the census tract Area TRI using the head/tail breaks method, while the Road Ruggedness Scale (RRS) is the categorization of the census tract Road TRI. The head/tail breaks method was ideal for categorizing the mean census tract Area and Road TRI values into ruggedness scales, as it allowed us to model and analyze differing levels of ruggedness. The thresholds for the census tract Area and Road TRI values were calculated using the "ClassInt" package in R (for more information, see Bivand et al.'s Choose univariate class intervals, 2020).
Though they contain similar categorical descriptions, the ARS and RRS are not directly comparable because they are calculated from two different underlying distributions. However, the mean Area TRI and mean Road TRI values could be used to make comparisons between the two measures.
Strengths and Limitations
Building on USDA, ERS's longstanding work on geographic classifications, the Area and Road Ruggedness Scales data product serves as a resource for researchers, Federal agencies, policymakers, and practitioners working to better understand and address issues of rural development, demographic change, and individual and community well-being. To our knowledge, these are the first ruggedness measures with full nationwide coverage for the United States and the first to provide a roads-only version to help study the impact of rugged terrain on travel by car.
The Area and Road Ruggedness Scales data product is a multifaceted tool that can be used to understand the unique role of rugged terrain as both a benefit and hindrance. The ARS and the accompanying Area TRI summary statistics provide measures of the overall ruggedness of an area, a more traditional way of measuring topography that is frequently used when studying ruggedness as a potential amenity. On the other hand, the RRS and the accompanying Road TRI summary statistics provide robust indicators of the landscape characteristics that present an impediment to settlement and travel and, therefore, accessibility to services for people residing in rugged terrain.
Another strength of the Area and Road Ruggedness Scales data product is that it is available for census tracts. They provide a more accurate description of the variable topography within an area than would larger geographic units, such as counties. Census tracts are also the smallest geographic unit for which socioeconomic data are generally produced. USDA, ERS has several census-tract-level data products that could be used in conjunction with the Area and Road Ruggedness Scales data, including the Poverty Area Measures and Food Access Research Atlas.
One limitation of the data product is that anomalies may exist in the data sources that would then affect the calculation of the grid cell and aggregate TRI measures. For example, satellite measurements may have difficulty distinguishing between terrain and tall buildings. Although these anomalies may ultimately affect the categorization of census tracts, we do not possess the intimate local knowledge necessary to identify and correct anomalies within the data.
Although not a limitation of the data, an important aspect of the data to consider is that the highest categories of the ARS and RRS contain a wide range of values of the underlying TRI measures. They are also based on a single measure of ruggedness within census tracts (the mean). For this reason, the Area and Road TRI summary statistics are also included.
Additional Resources
The downloadable Excel data file includes a worksheet for the vintage 2010 census tract ruggedness measures as well as worksheets with documentation and a codebook.
Geographic identifiers are provided, which can be used for mapping applications and to explore various spatial categories, such as rurality and regions.
See appendix A of the report, Characterizing Rugged Terrain in the United States for more details on the data and methods used to create the TRI values, ARS, and RRS.
Recommended Citation
U.S. Department of Agriculture, Economic Research Service. Area and Road Ruggedness Scales, September 2023.