Rural areas are defined in a number of ways according to the economic or social outcome of interest. Rural economic and demographic changes are closely linked; both are essential to understanding whether diverse rural areas are prospering or in distress, and how underlying factors such as education affect the well-being of rural communities. These trends vary widely across rural America.
Rural Economy
- Updated: 1/8/2025
- Contact: Website Administrator
-
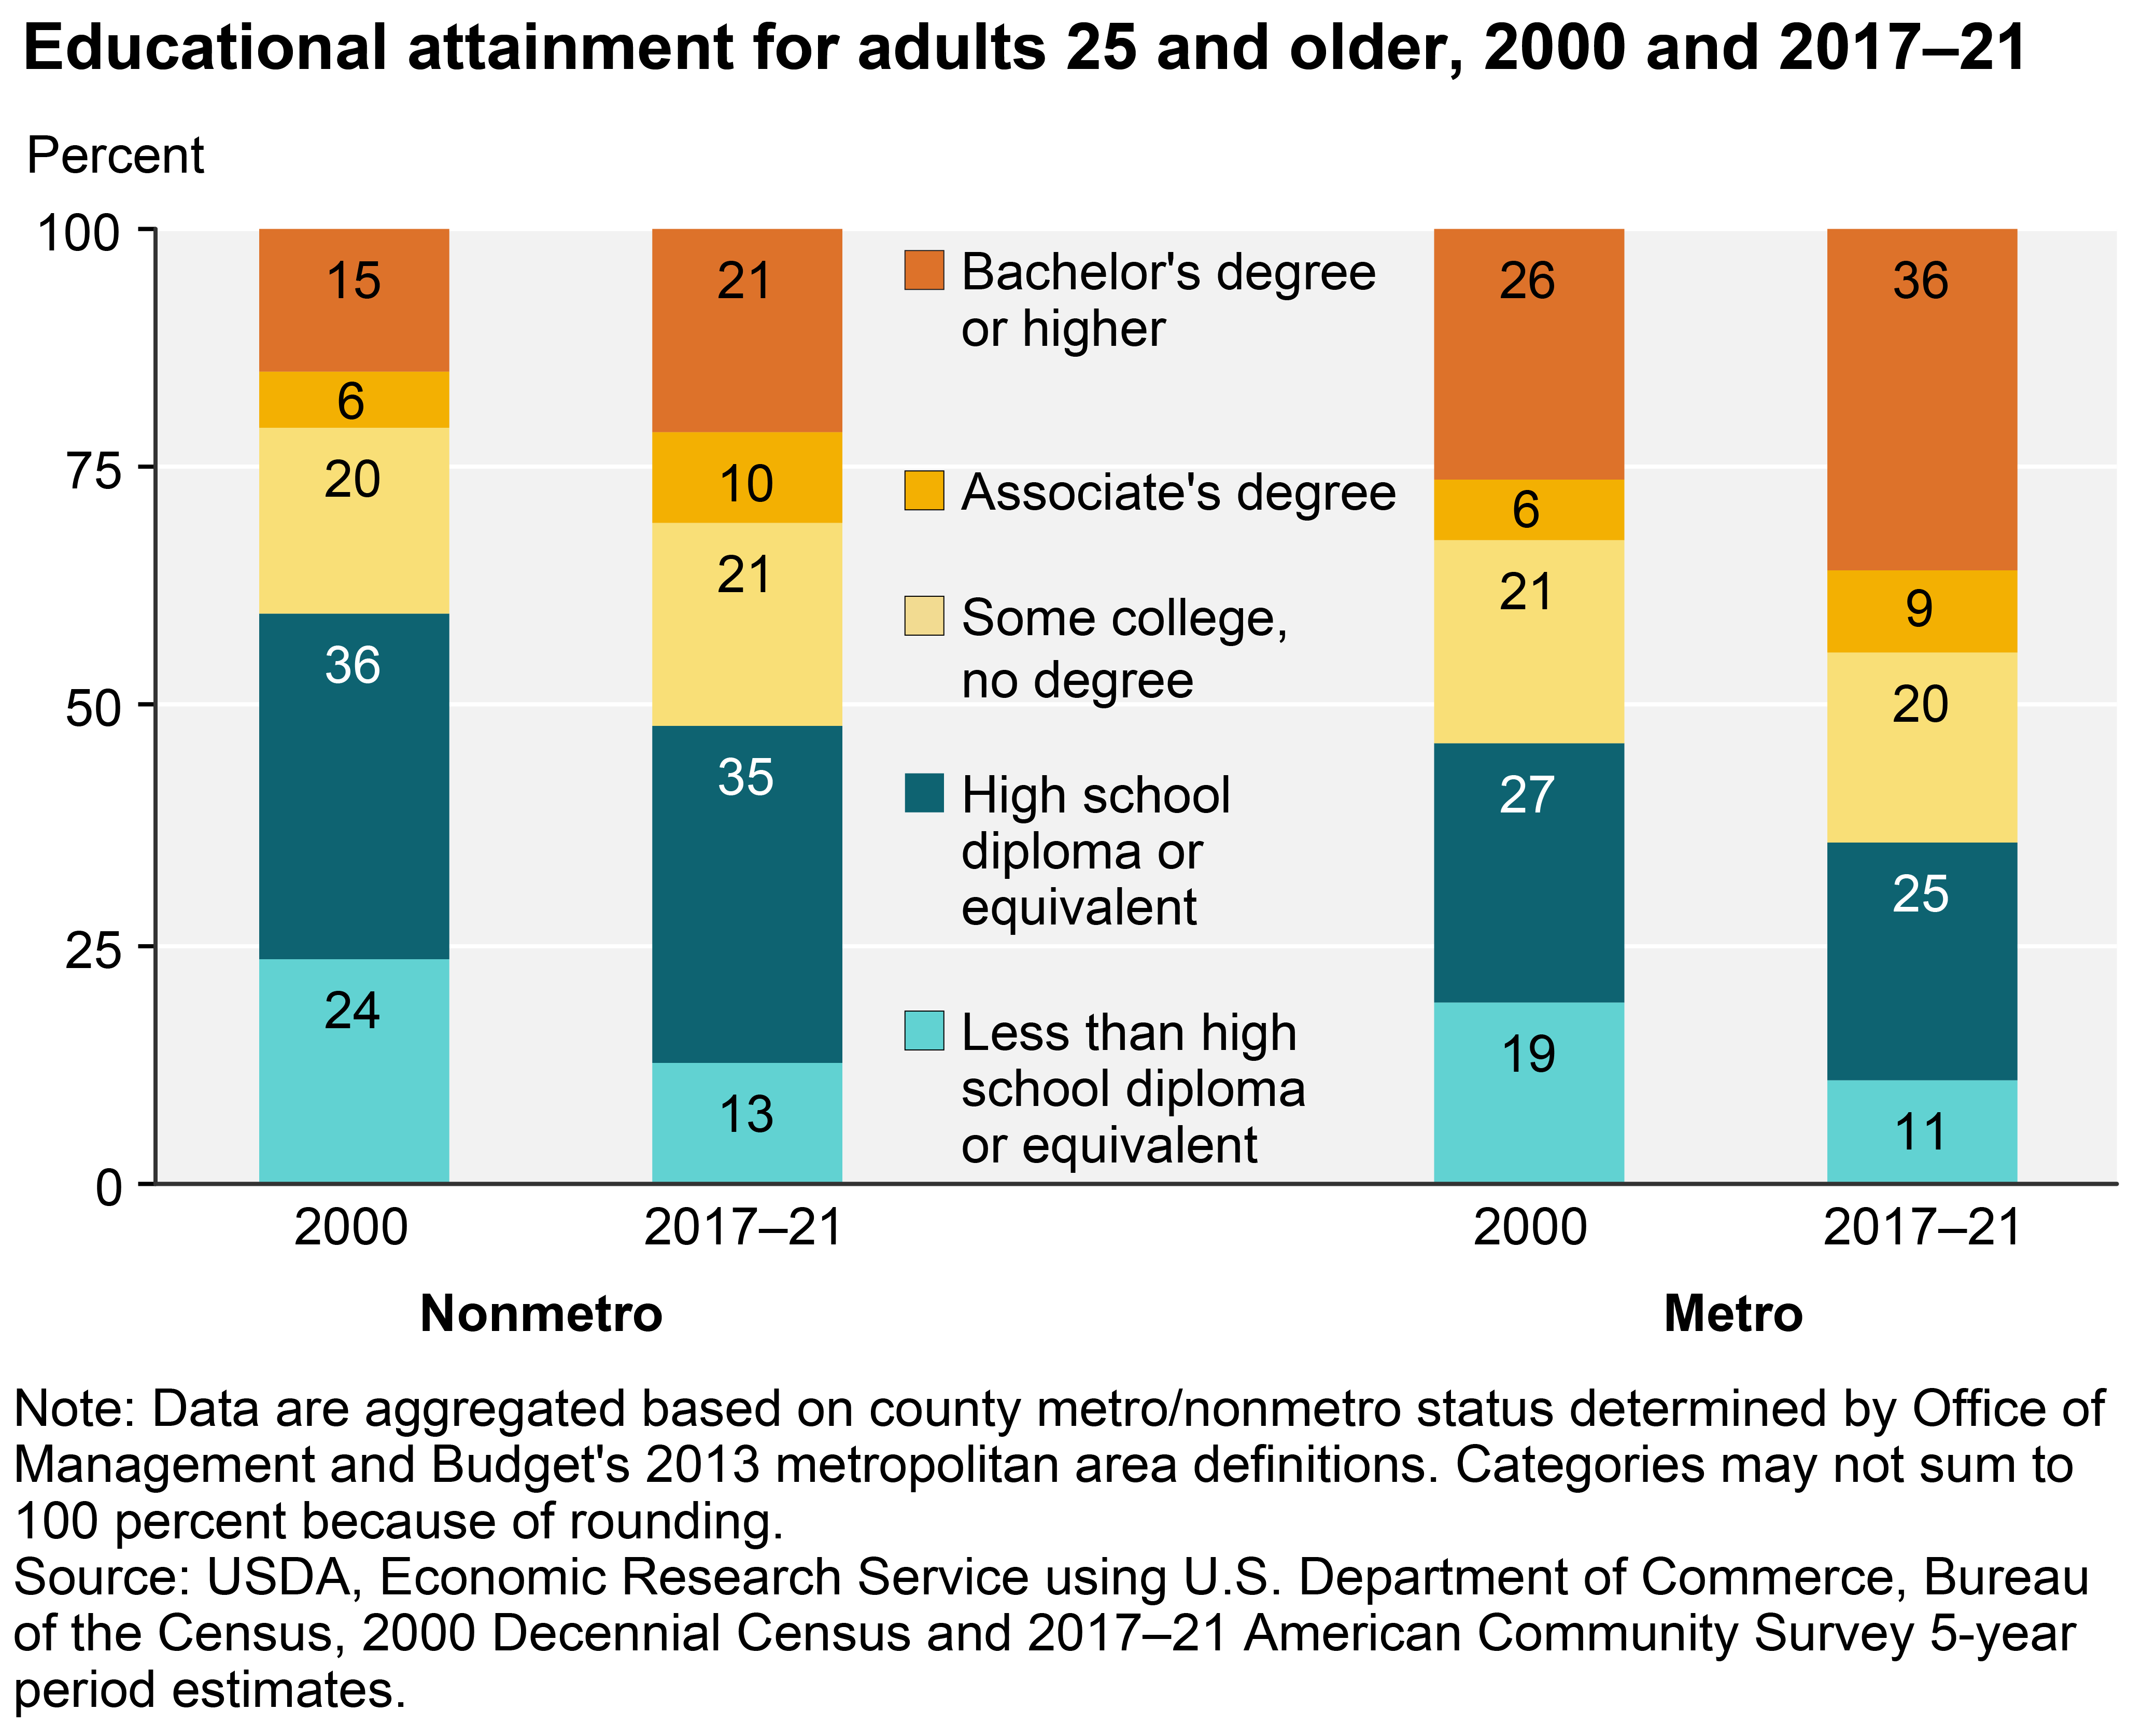
Nonmetro education levels are improving, but still lag metro
- by Austin Sanders
- 2/10/2023
Historically, nonmetro areas in the United States have lagged behind metro areas in educational attainment, but nonmetro educational attainment levels continue to increase. From 2000 to 2017–21, the share of adults with less than a high school diploma declined in nonmetro areas from 24 percent to 13 percent and the share of adults with a bachelor’s degree or higher increased from 15 percent to 21 percent. However, the share of adults with a bachelor’s degree or higher in metro areas increased from 26 percent in 2000 to 36 percent in 2017–21, widening the nonmetro-metro gap from 11 percentage points to 15 percentage points. One explanation for the persisting and widening gap may be the higher pay more highly-educated workers can often earn in metropolitan labor markets. -
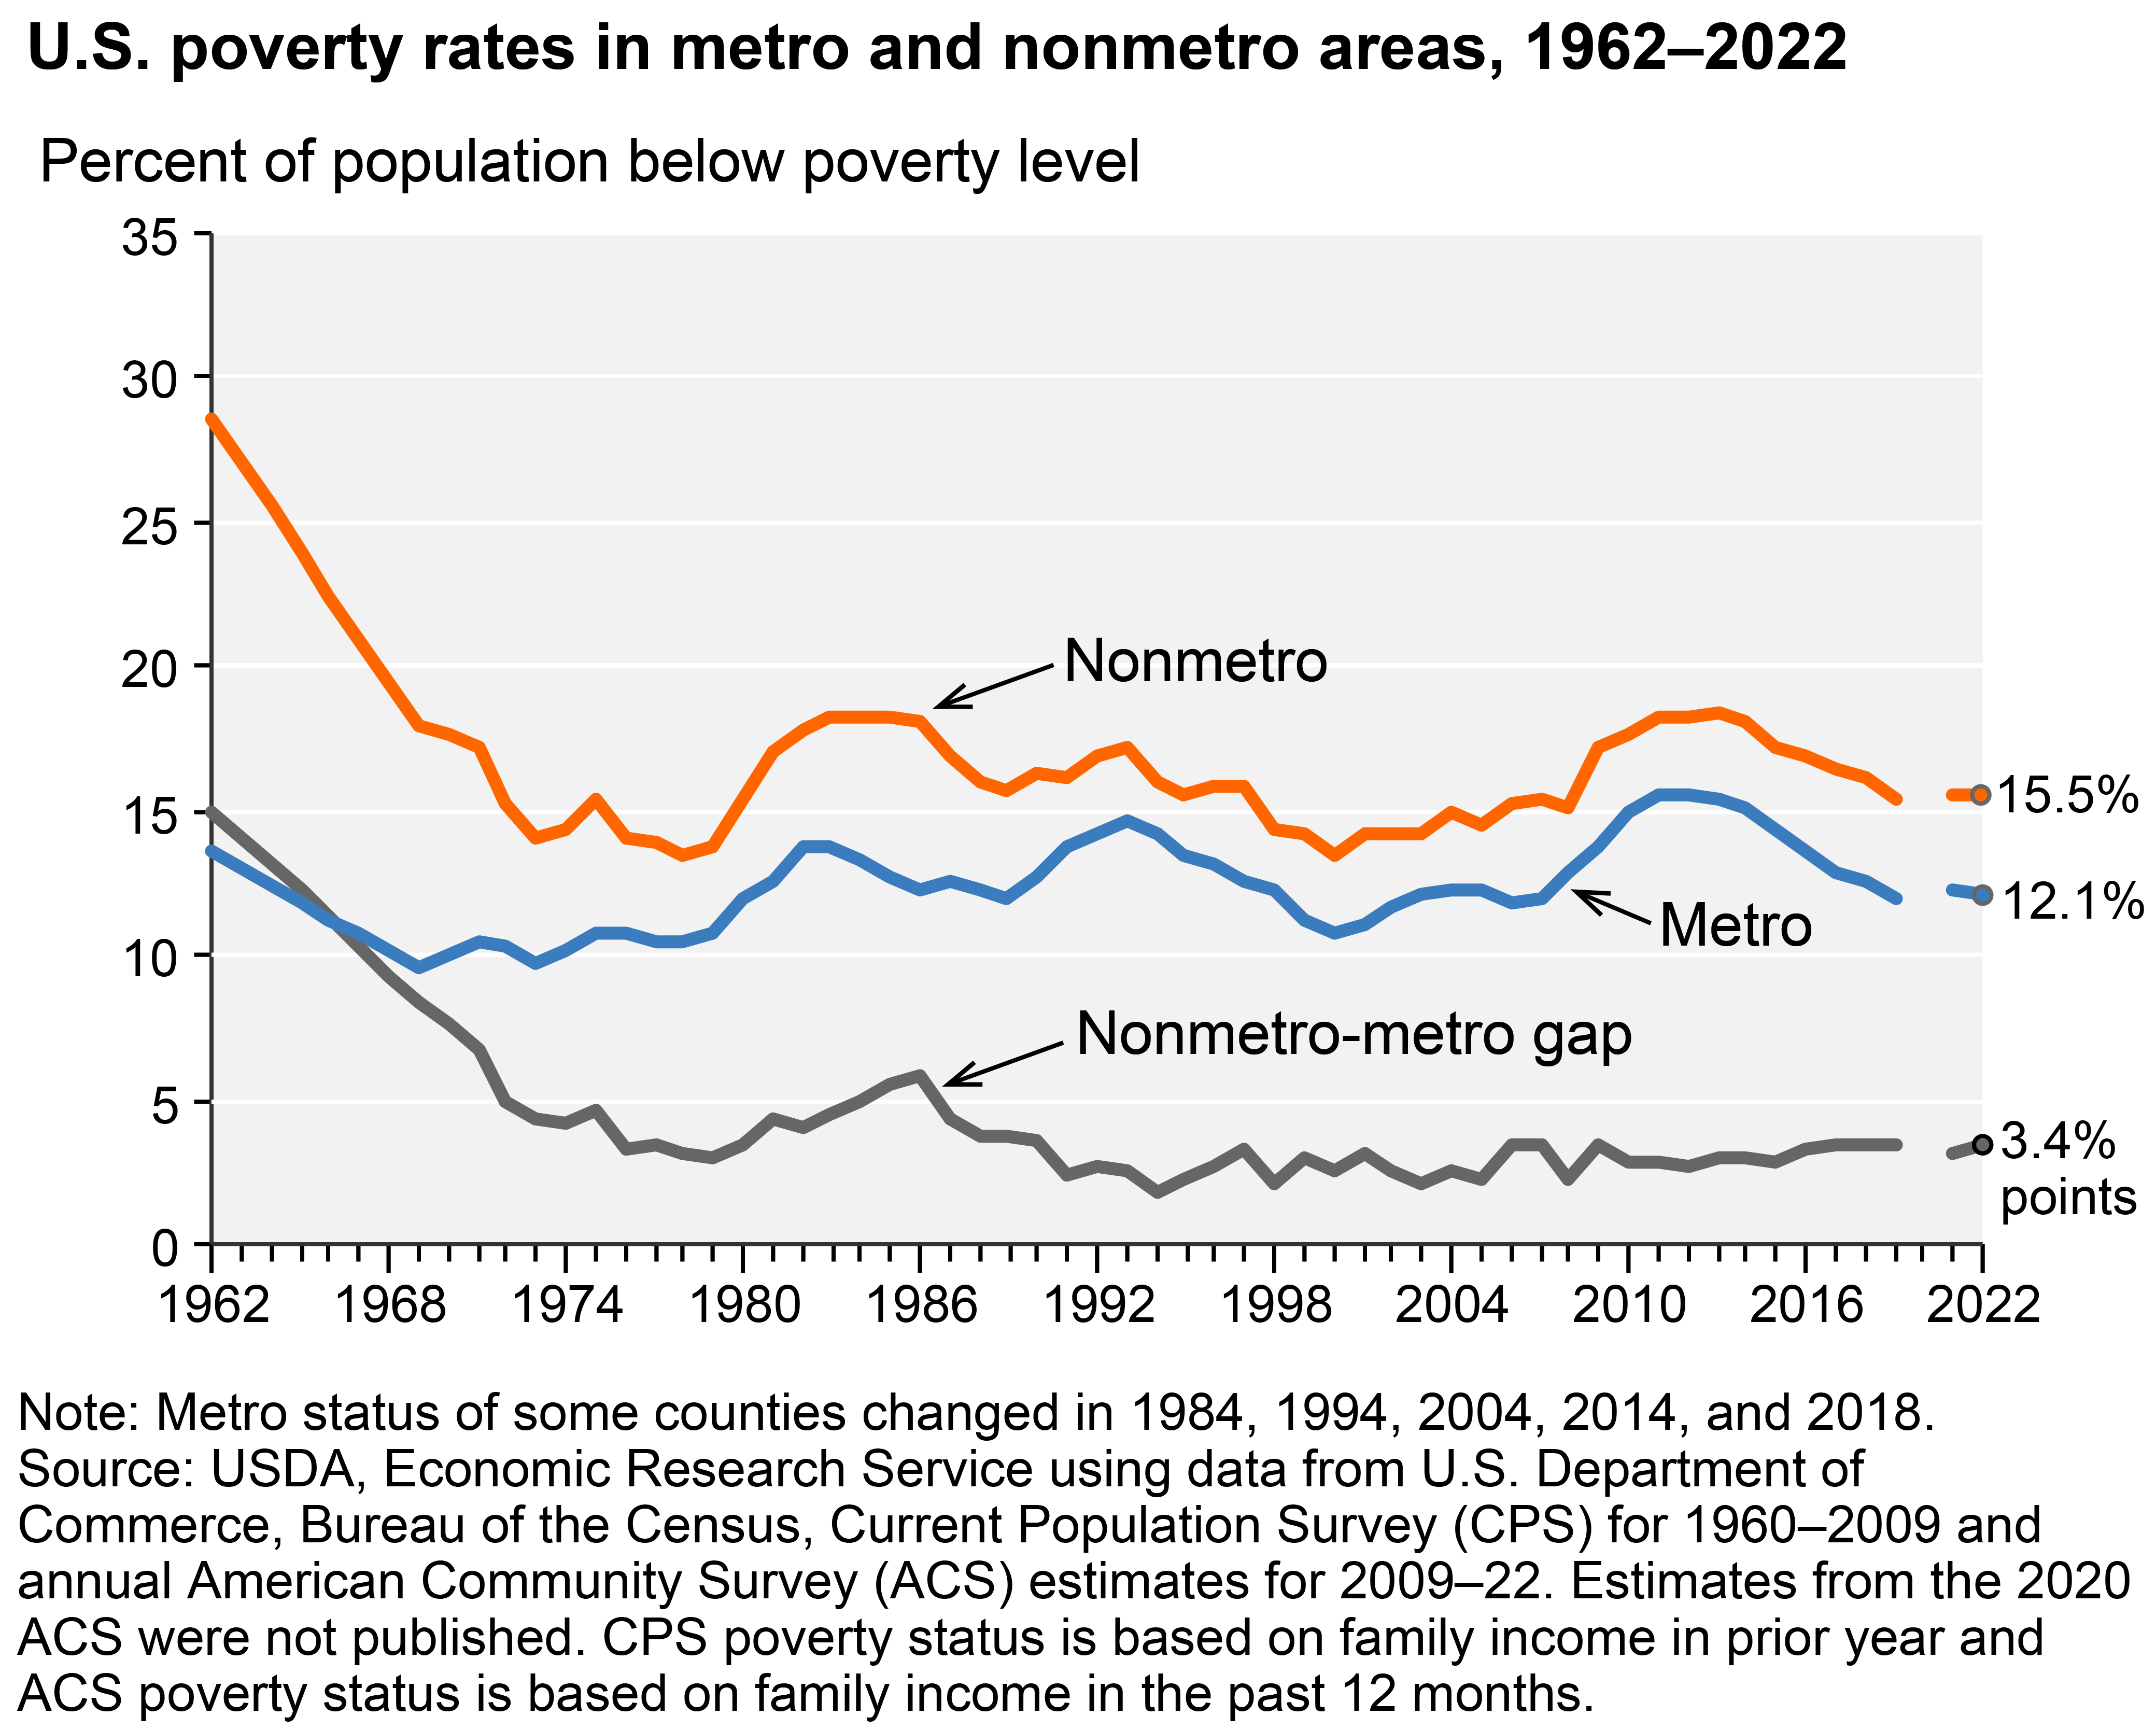
Nonmetro poverty rates remain higher than metro
- by Tracey Farrigan
- 2/26/2024
Nonmetro areas have had a higher rate of poverty than metro areas since the 1960s (when poverty rates were first officially recorded). Over time, however, the difference between nonmetro and metro poverty rates has generally narrowed, falling from an average difference of 4.5 percentage points in the 1980s to an average gap of about 3.1 percentage points in 2010–21. In 2022, the nonmetro poverty rate was 15.5 percent, while the metro rate was 12.1 percent. -
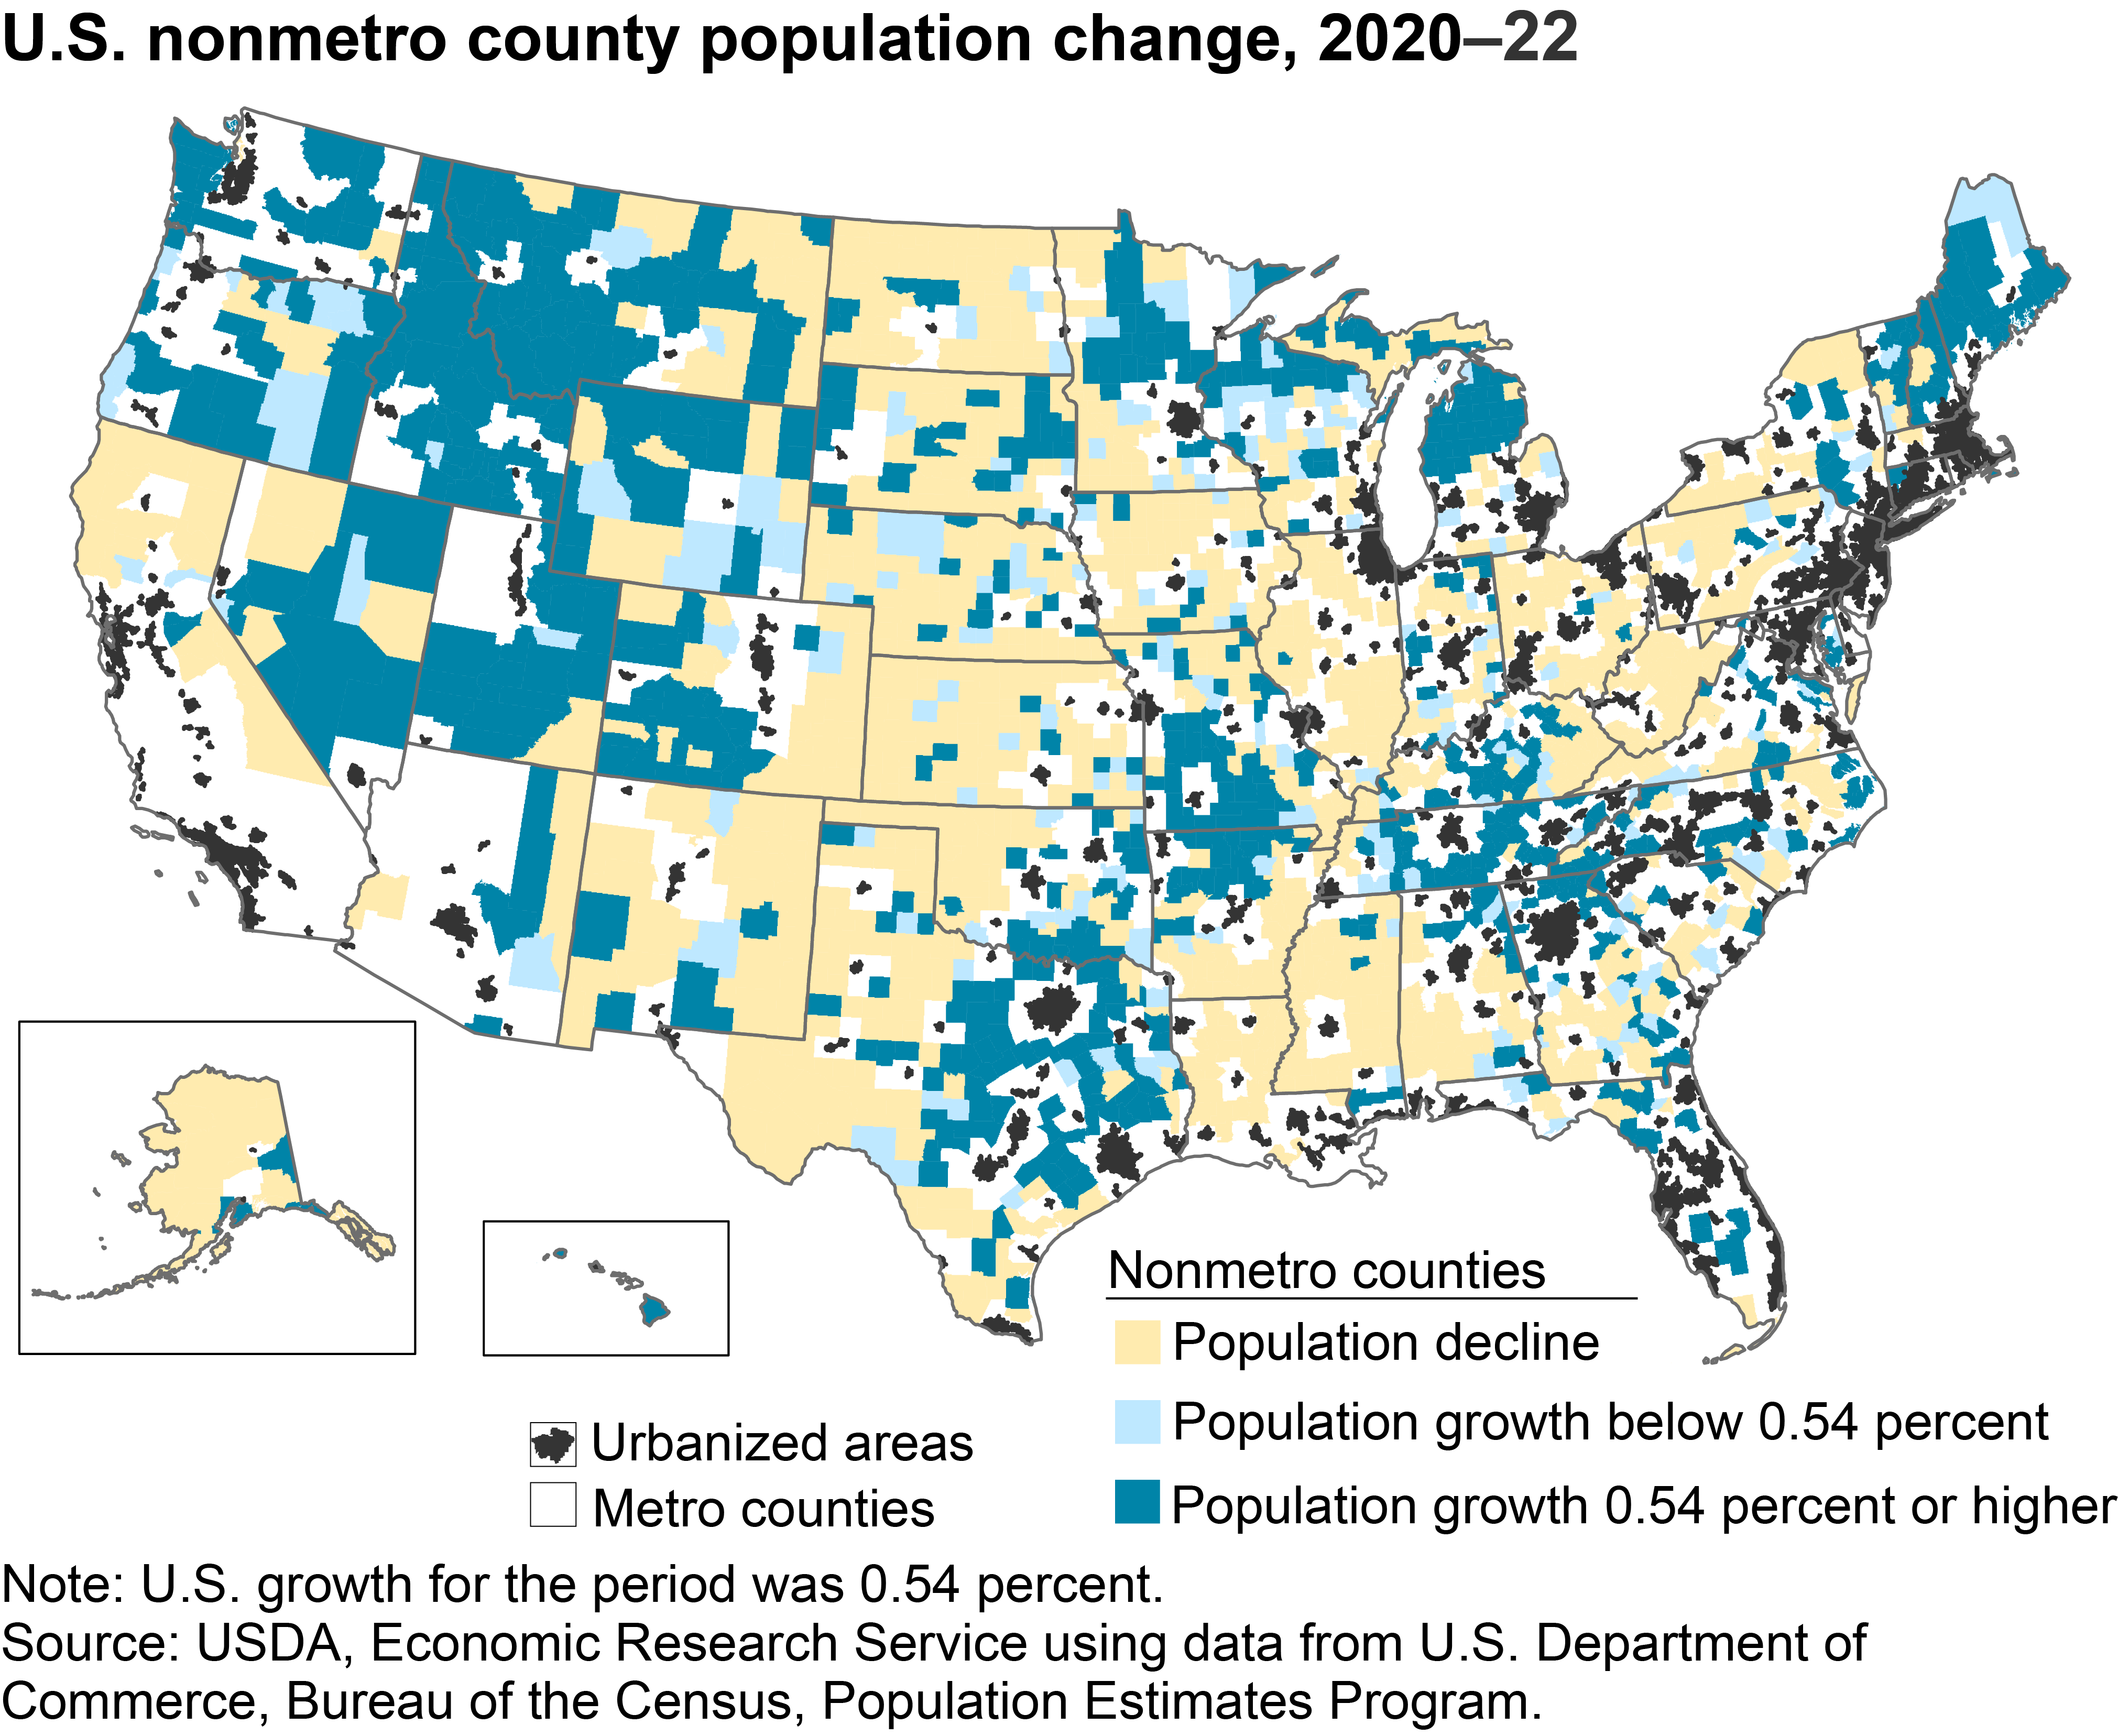
Nonmetro population change varies across the United States
- by John Cromartie and Kathleen Kassel
- 2/26/2024
The nonmetropolitan population grew approximately a quarter percent from mid-2020 through mid-2022, about half the national rate (0.54 percent) during 2020–22. At the county level, however, there was regional and local variation in population change across nonmetro areas. Population declined in over half of all nonmetro counties. No longer concentrated in the Great Plains and Corn Belt as in previous years, nonmetro counties with population loss during 2020–22 were found in most States, including the eastern half of the country. Population grew at rates at or above the national rate of 0.54 percent in over a third of nonmetro counties, with most growing at or above twice the national rate. Many of these counties were in recreation or retirement destinations, such as in the southern Appalachians and Ozarks, the upper Great Lakes, and throughout the intermountain West. Others are found adjacent to large metro areas, such as Nashville, Minneapolis-St. Paul, and Dallas-Ft. Worth. However, in the wake of the COVID-19 pandemic, high-growth nonmetro counties were also found in all States of the Great Plains, reversing historic trends. -
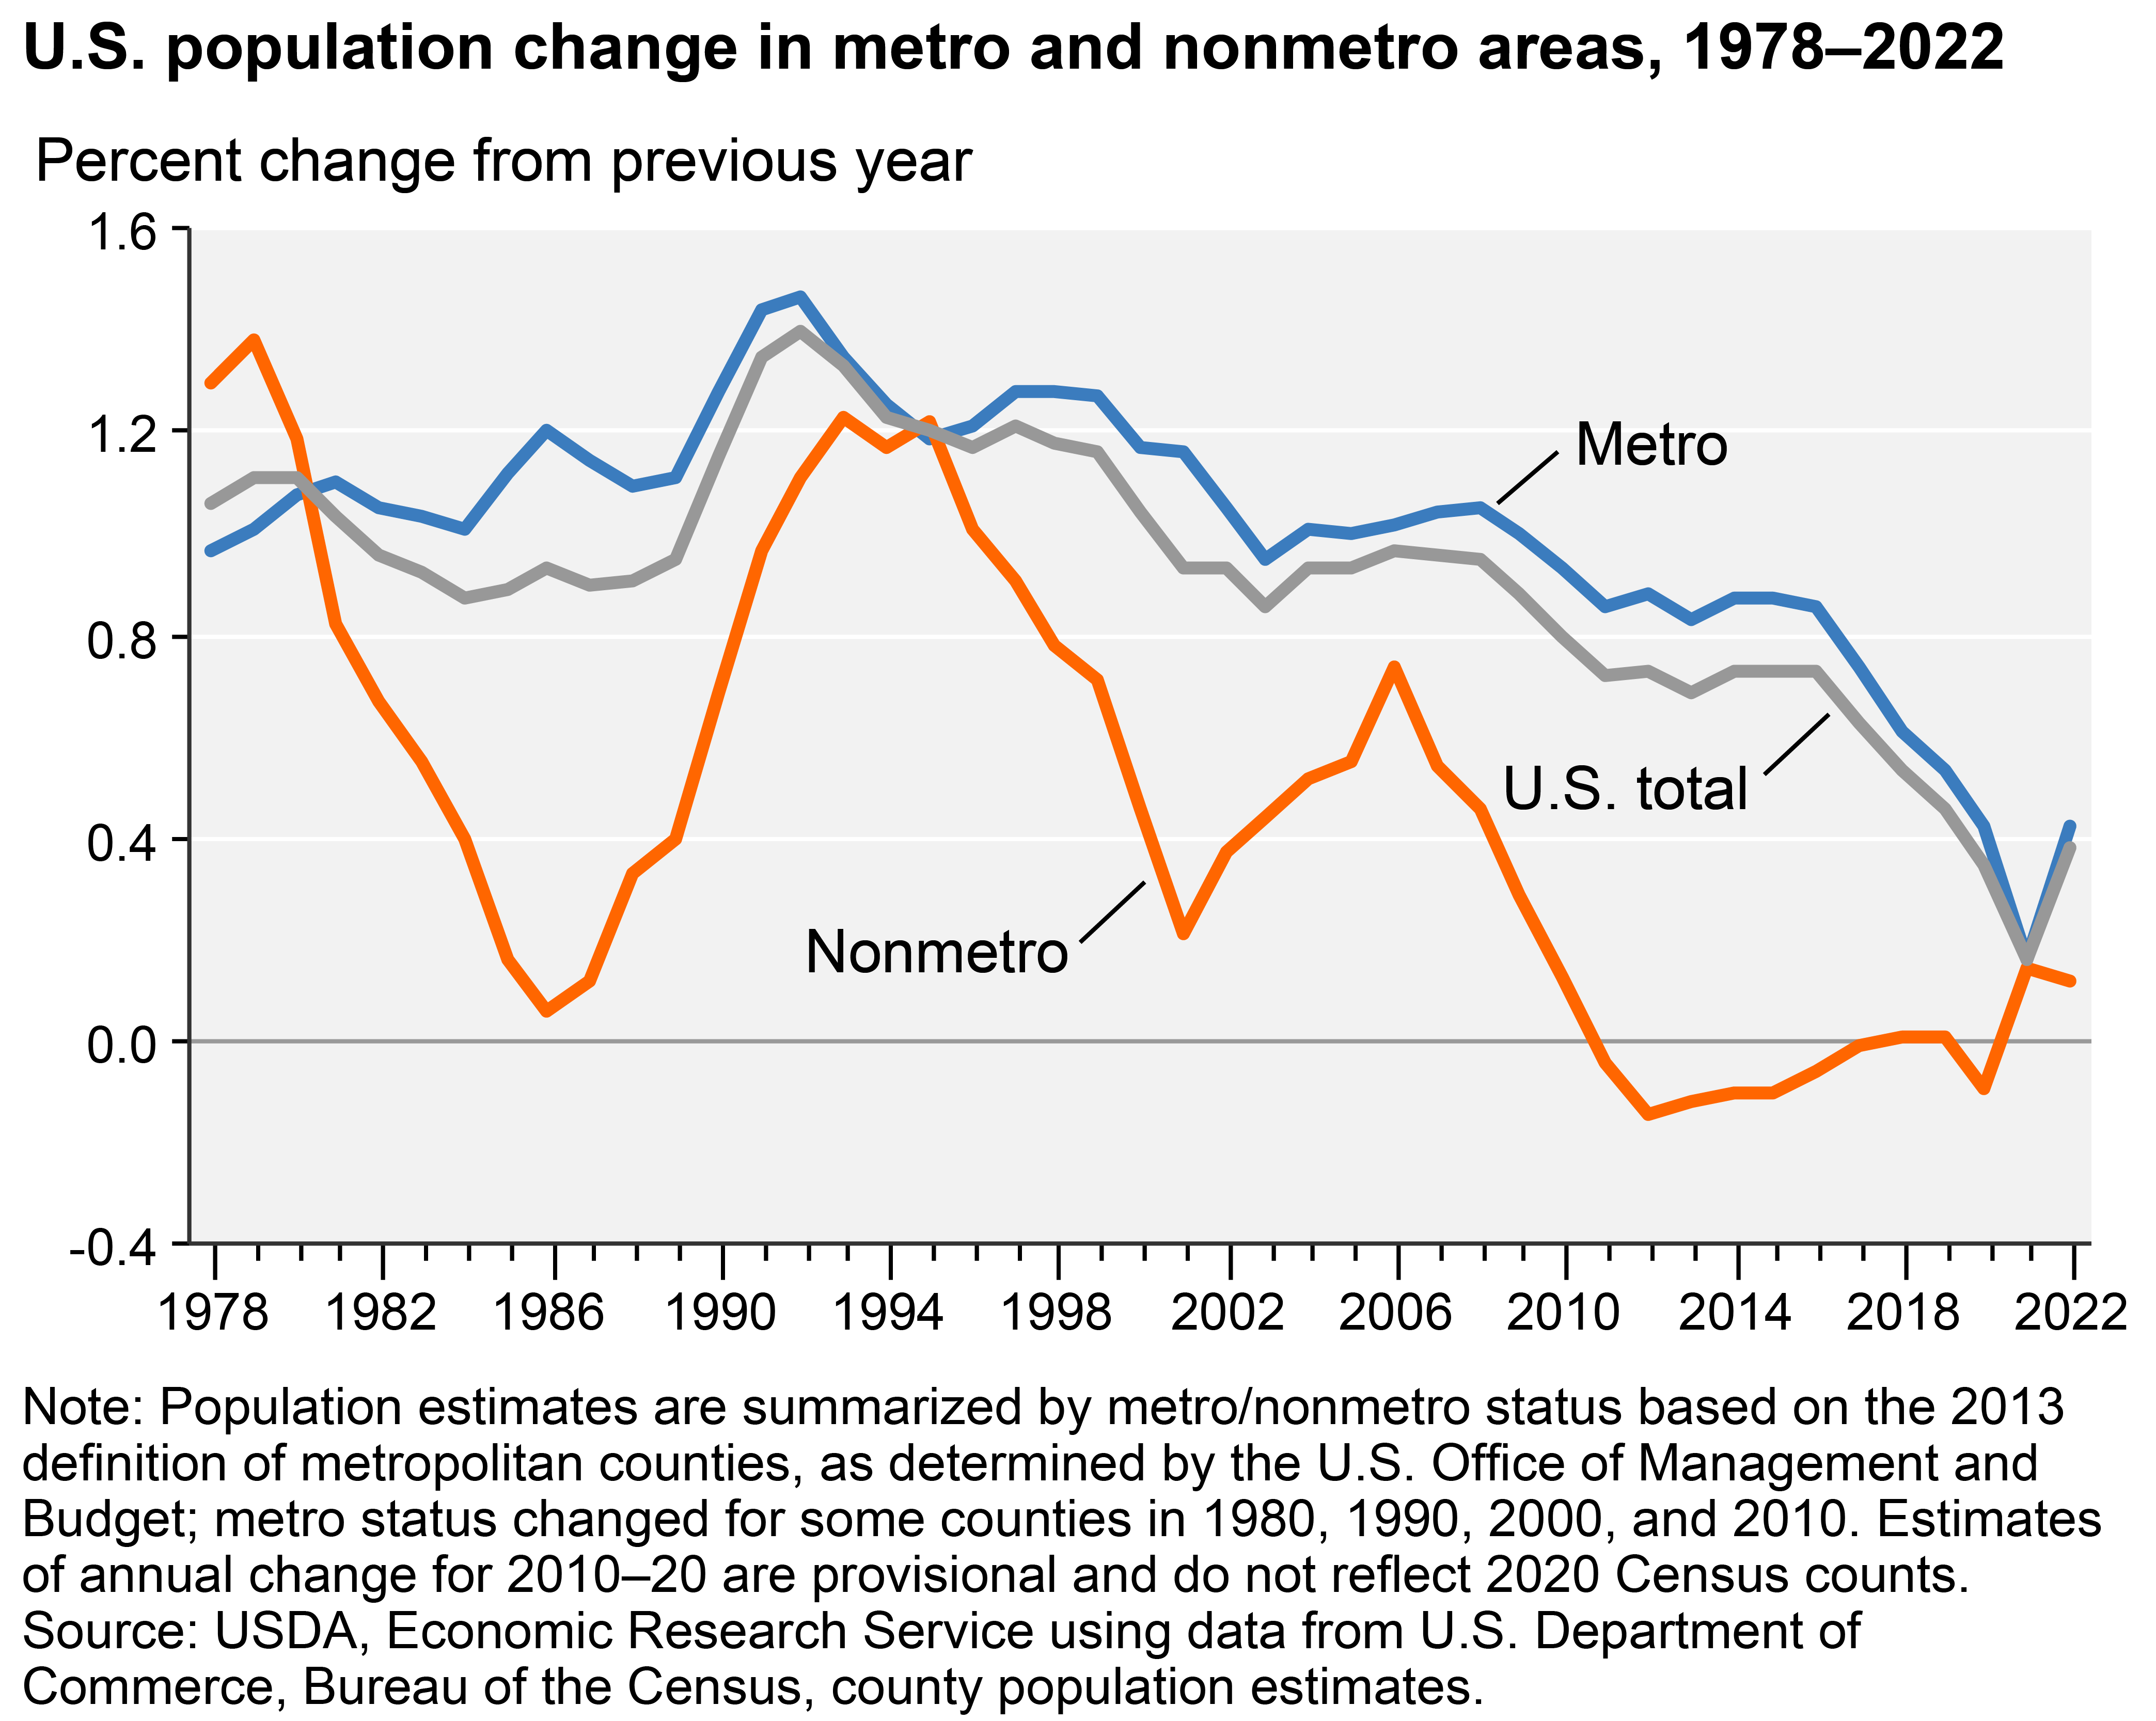
Rural areas experienced renewed population growth following the COVID-19 pandemic
- by John Cromartie and Kathleen Kassel
- 2/26/2024
For the second year following the COVID-19 pandemic, population increased in nonmetro areas, growing 0.12 percent from mid-2021 to mid-2022. Nonmetro population change had reversed in the previous year, from a 0.09-percent decline in 2019–20 to a 0.14-percent increase in the following 12 months. A turnaround in migration flows between metro and nonmetro counties occurred during the first year and a half of the COVID-19 pandemic, in contrast with the previous decade that saw the first-ever loss in nonmetro population (from 2010–17) when annual population change averaged -0.08 percent per year. -
Defining rural areas: U.S. Census uses small geographic units (blocks) to define urban/rural
- by Kathleen Kassel
- 2/29/2024
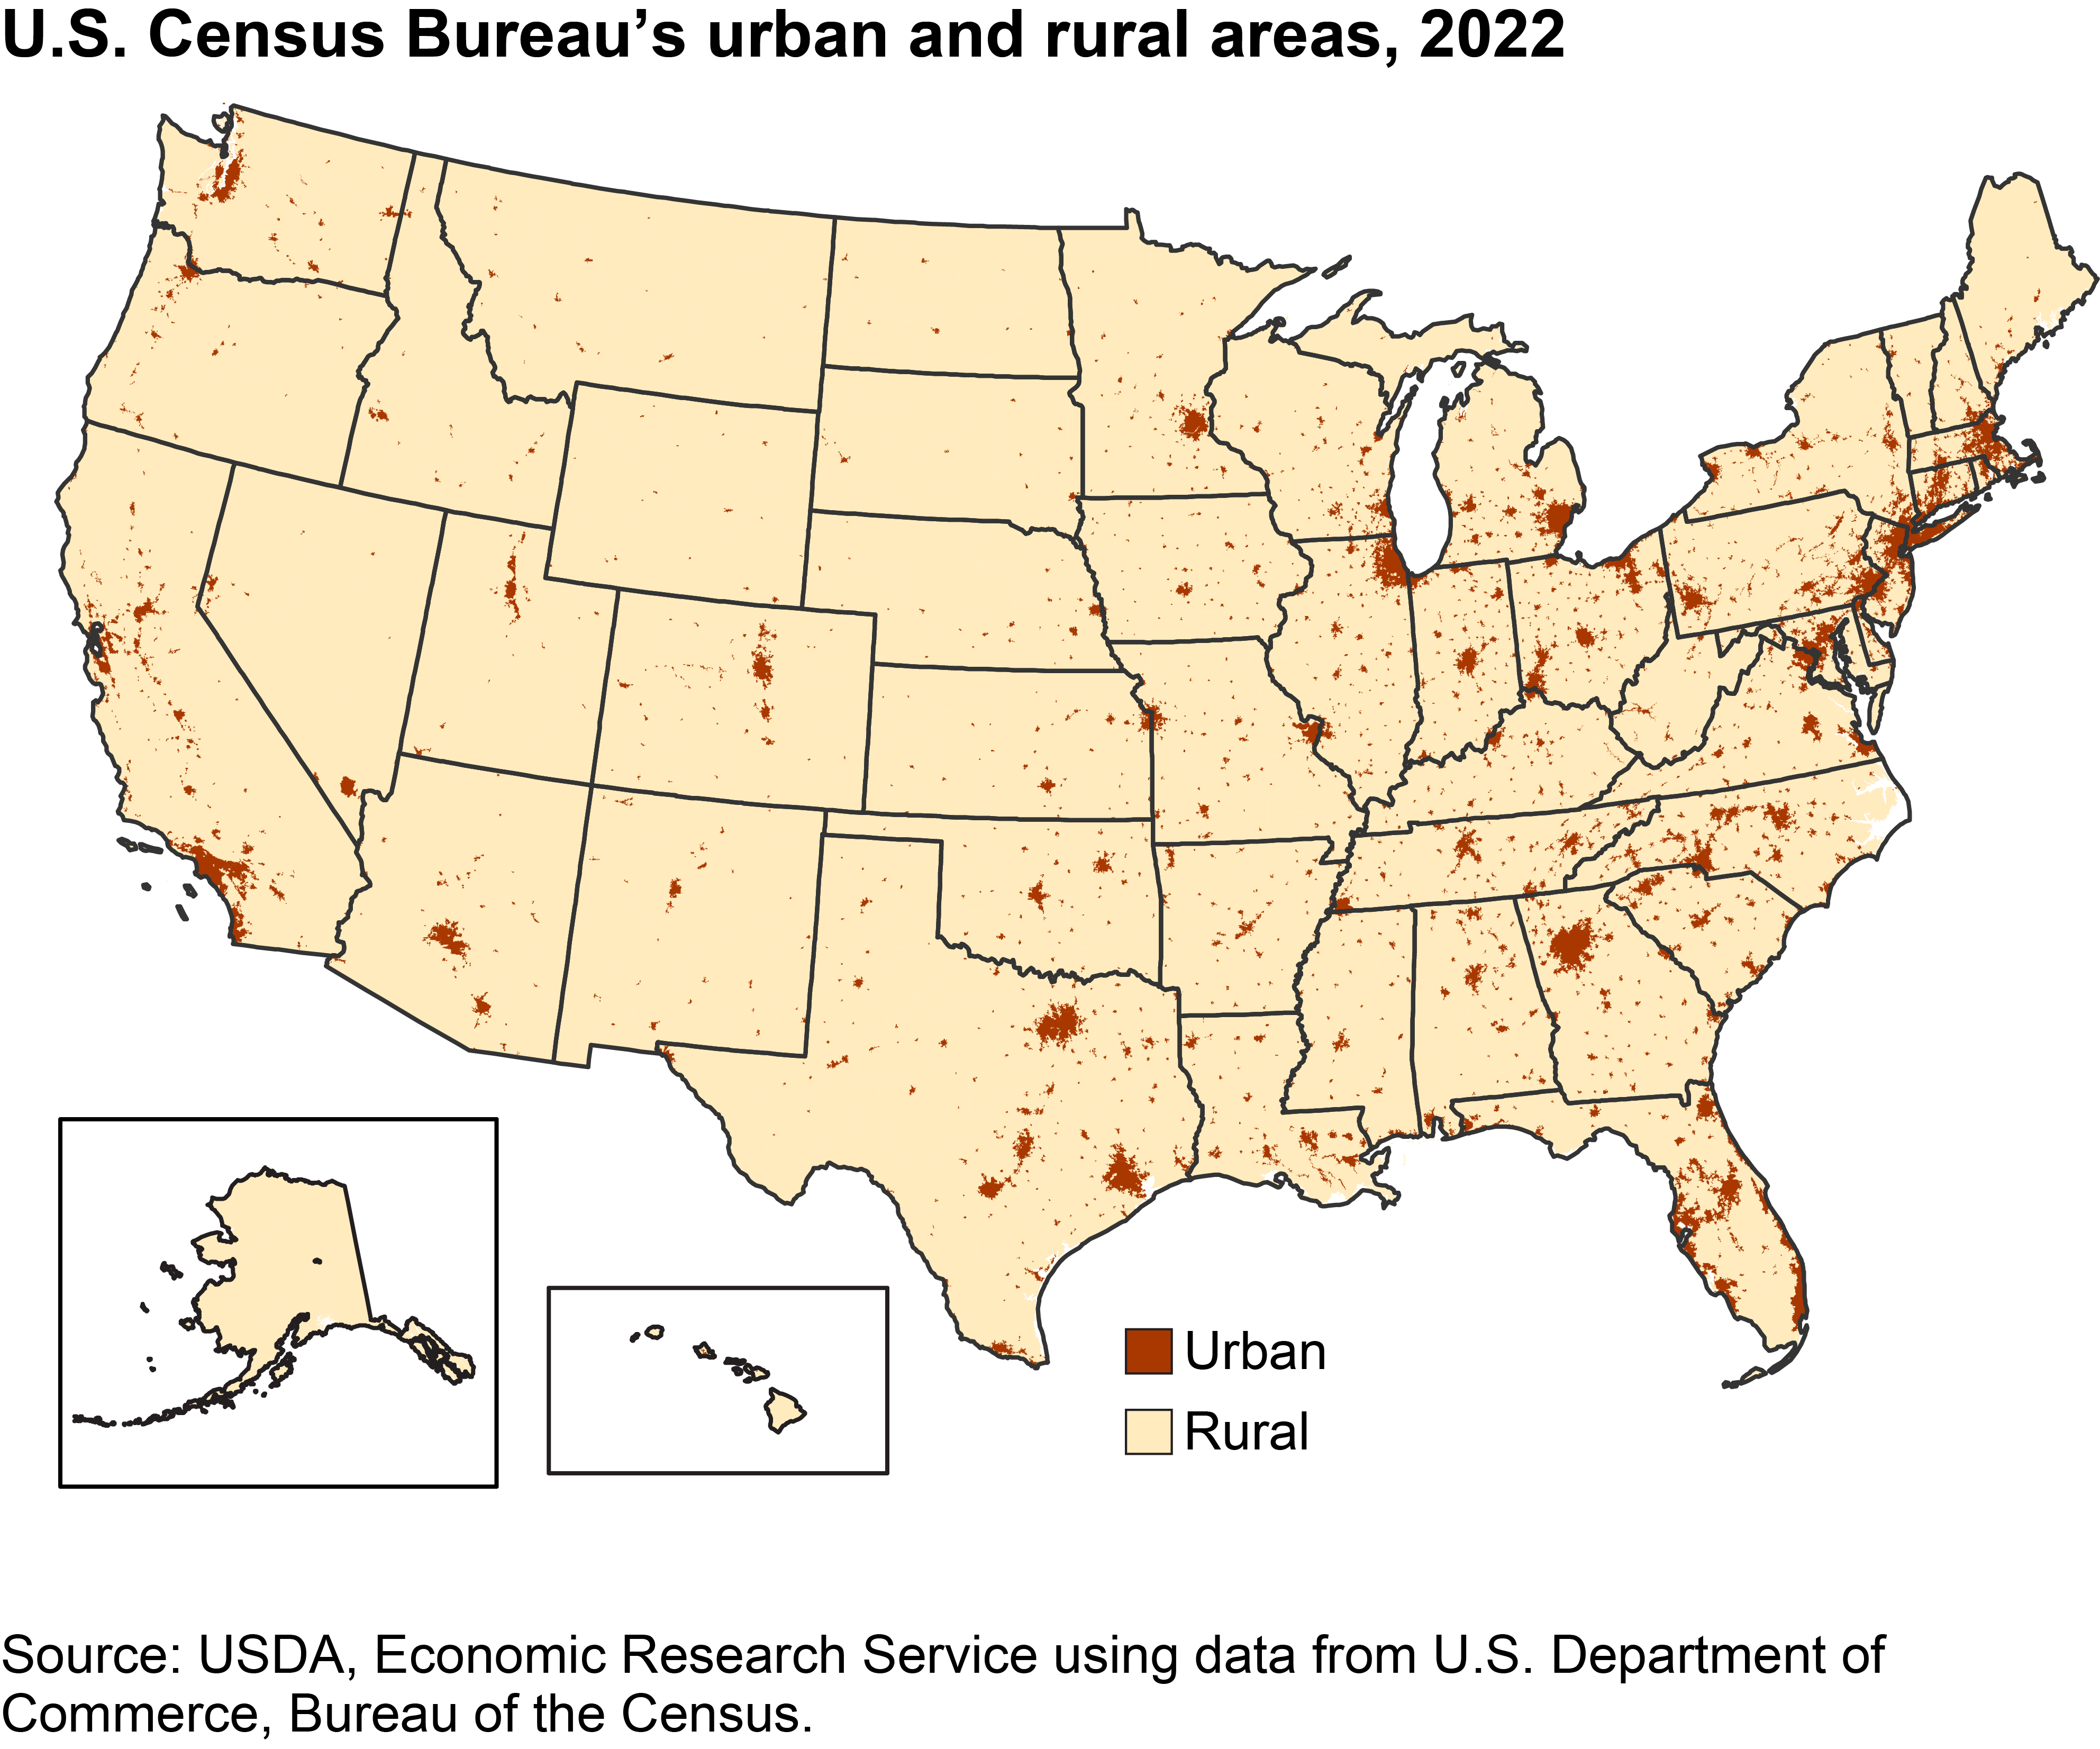
One definition of rural, based on relatively small geographic units, is provided by the U.S. Census Bureau in its urban-rural classification system. In this delineation, rural areas comprise open country and settlements with fewer than 5,000 residents. Urban areas comprise larger places and the densely settled areas around them, but do not necessarily follow municipal boundaries. Urban areas are essentially densely settled territory as it might appear from the air. -
Defining rural areas: "Nonmetro" is based on counties
- by Kathleen Kassel
- 2/29/2024
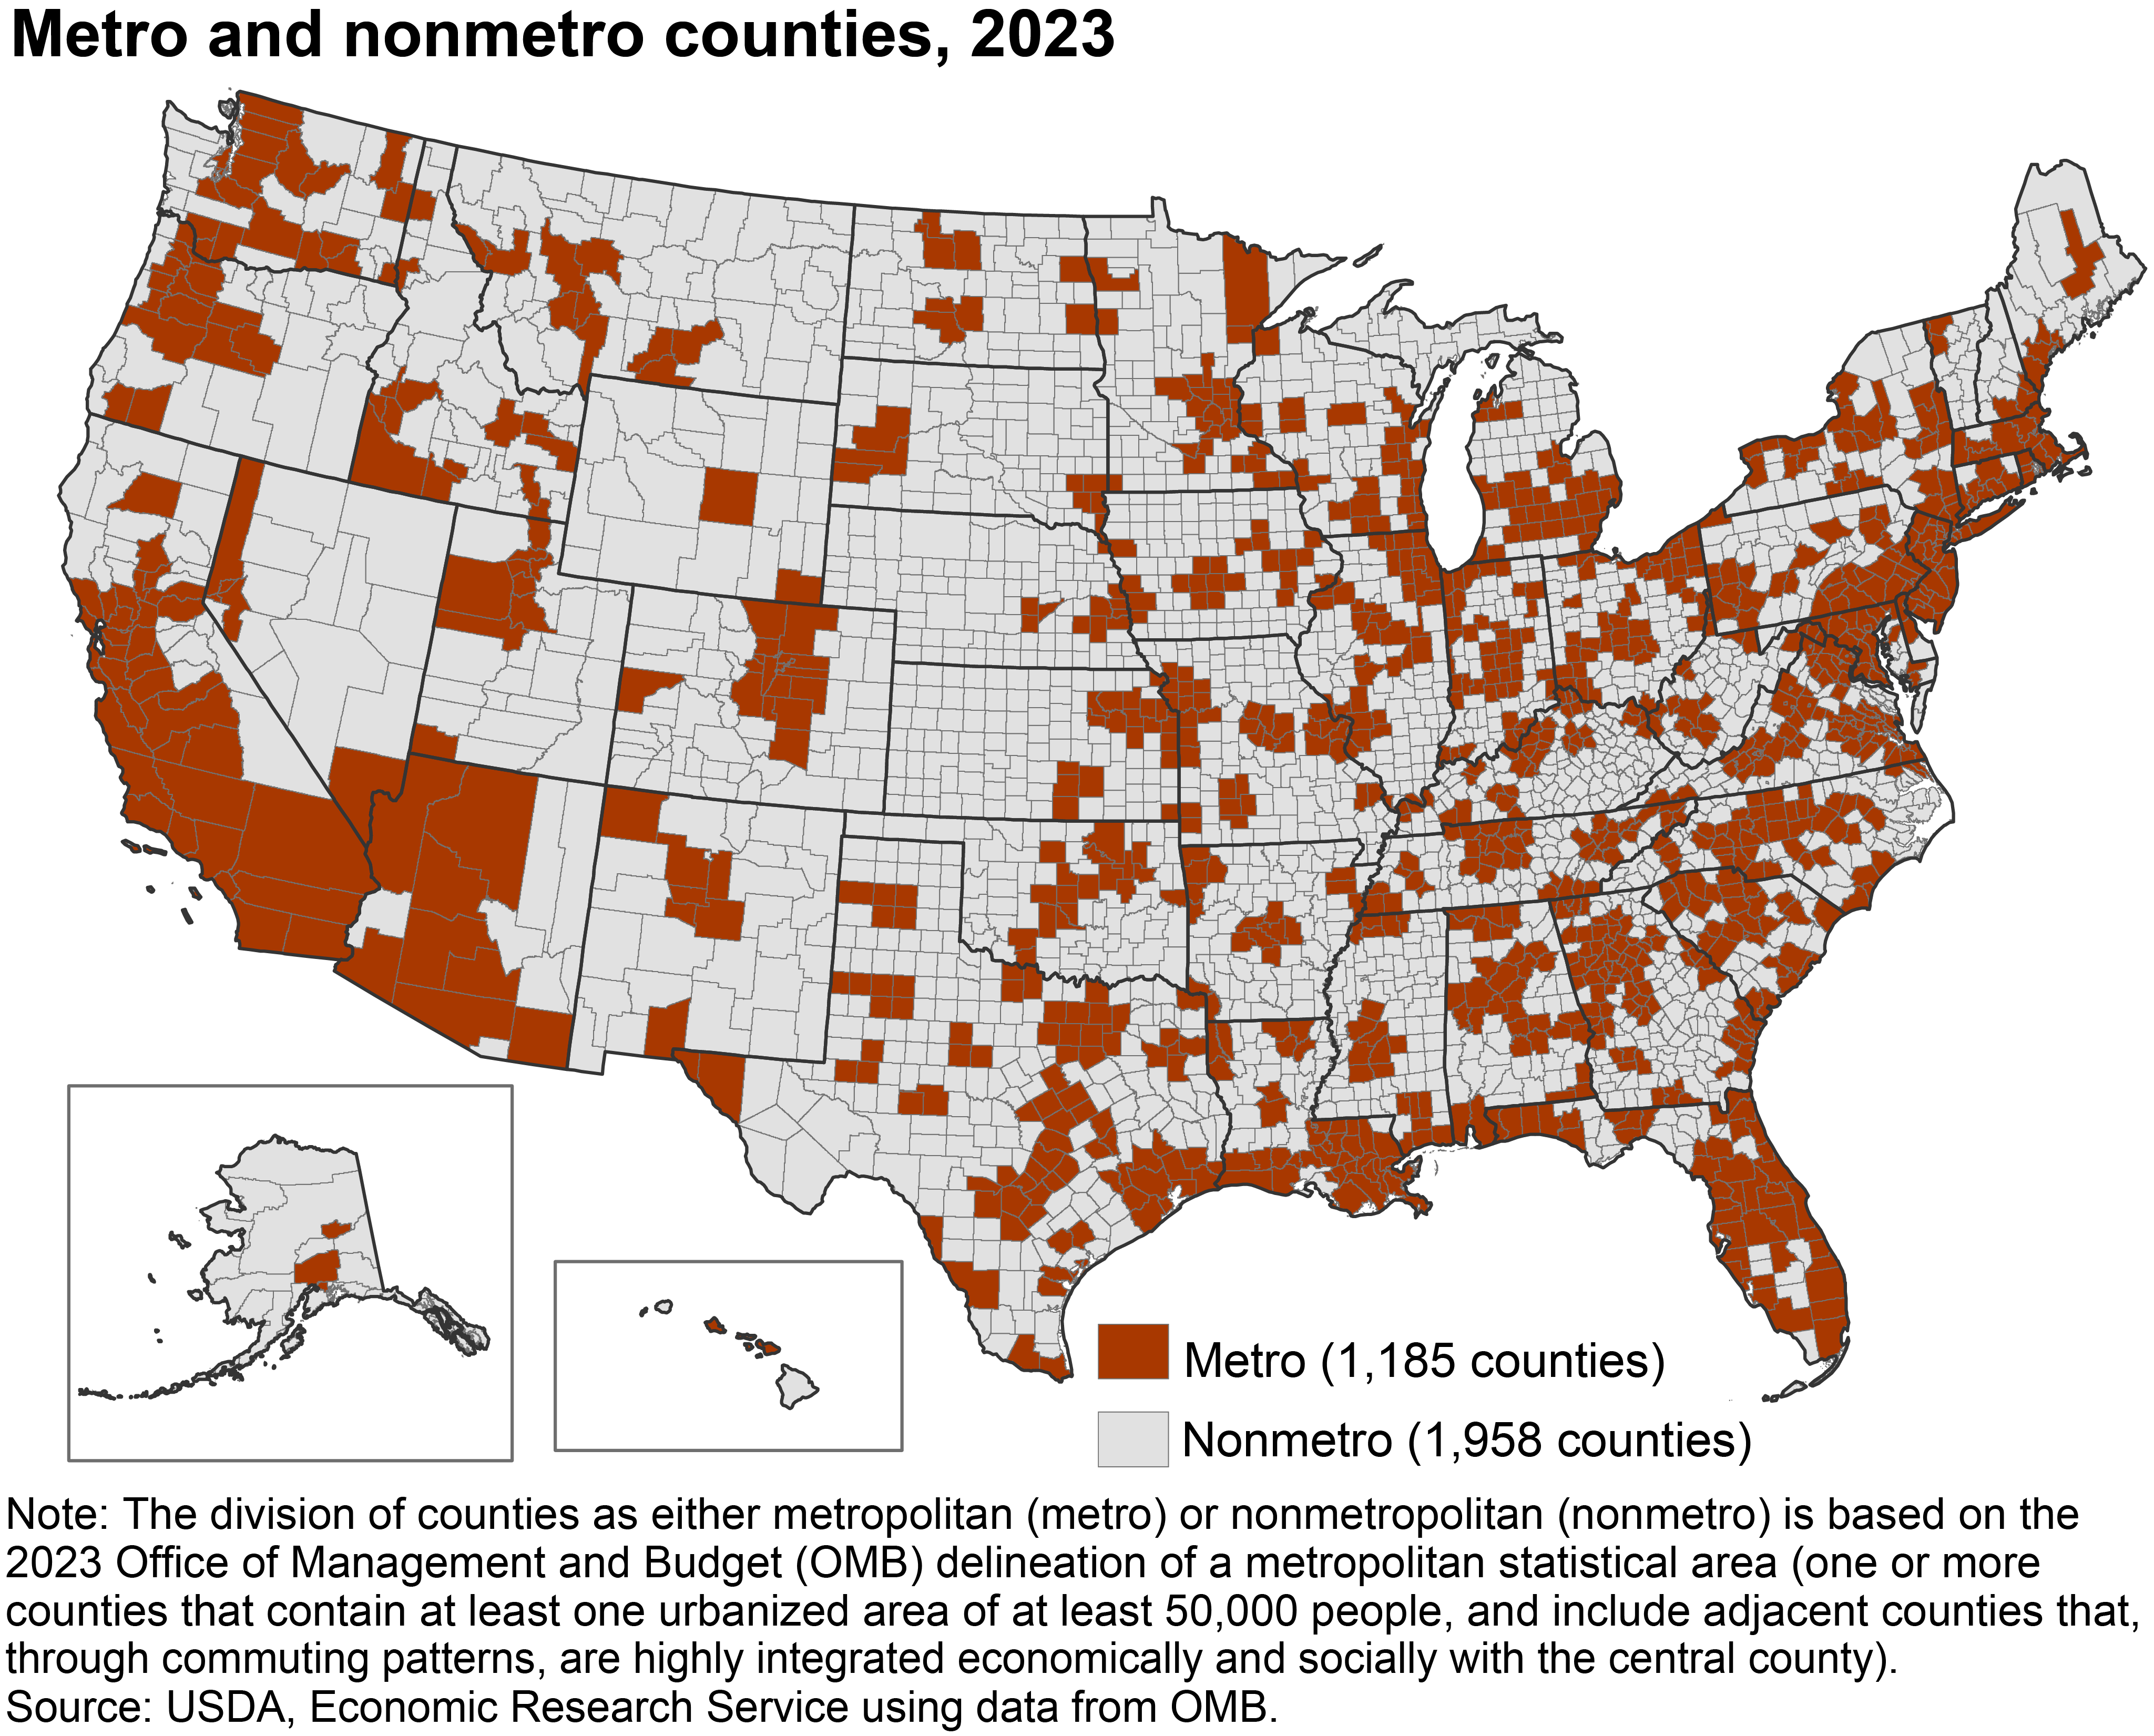
The Economic Research Service and others who analyze conditions in "rural" America most often study conditions in nonmetropolitan (nonmetro) areas, which are defined by the Office of Management and Budget on the basis of counties. Nonmetro counties include some combination of open countryside, rural towns (places with fewer than 5,000 people), and urban areas (with populations ranging from 5,000 to 49,999) that are not part of larger labor market areas (metropolitan areas). The 1,958 counties currently classified as nonmetro include 14 percent of the U.S. population (just over 46 million people) and 72 percent of the Nation's land area. -
Rural economies depend on different industries
- by Kathleen Kassel
- 10/9/2018
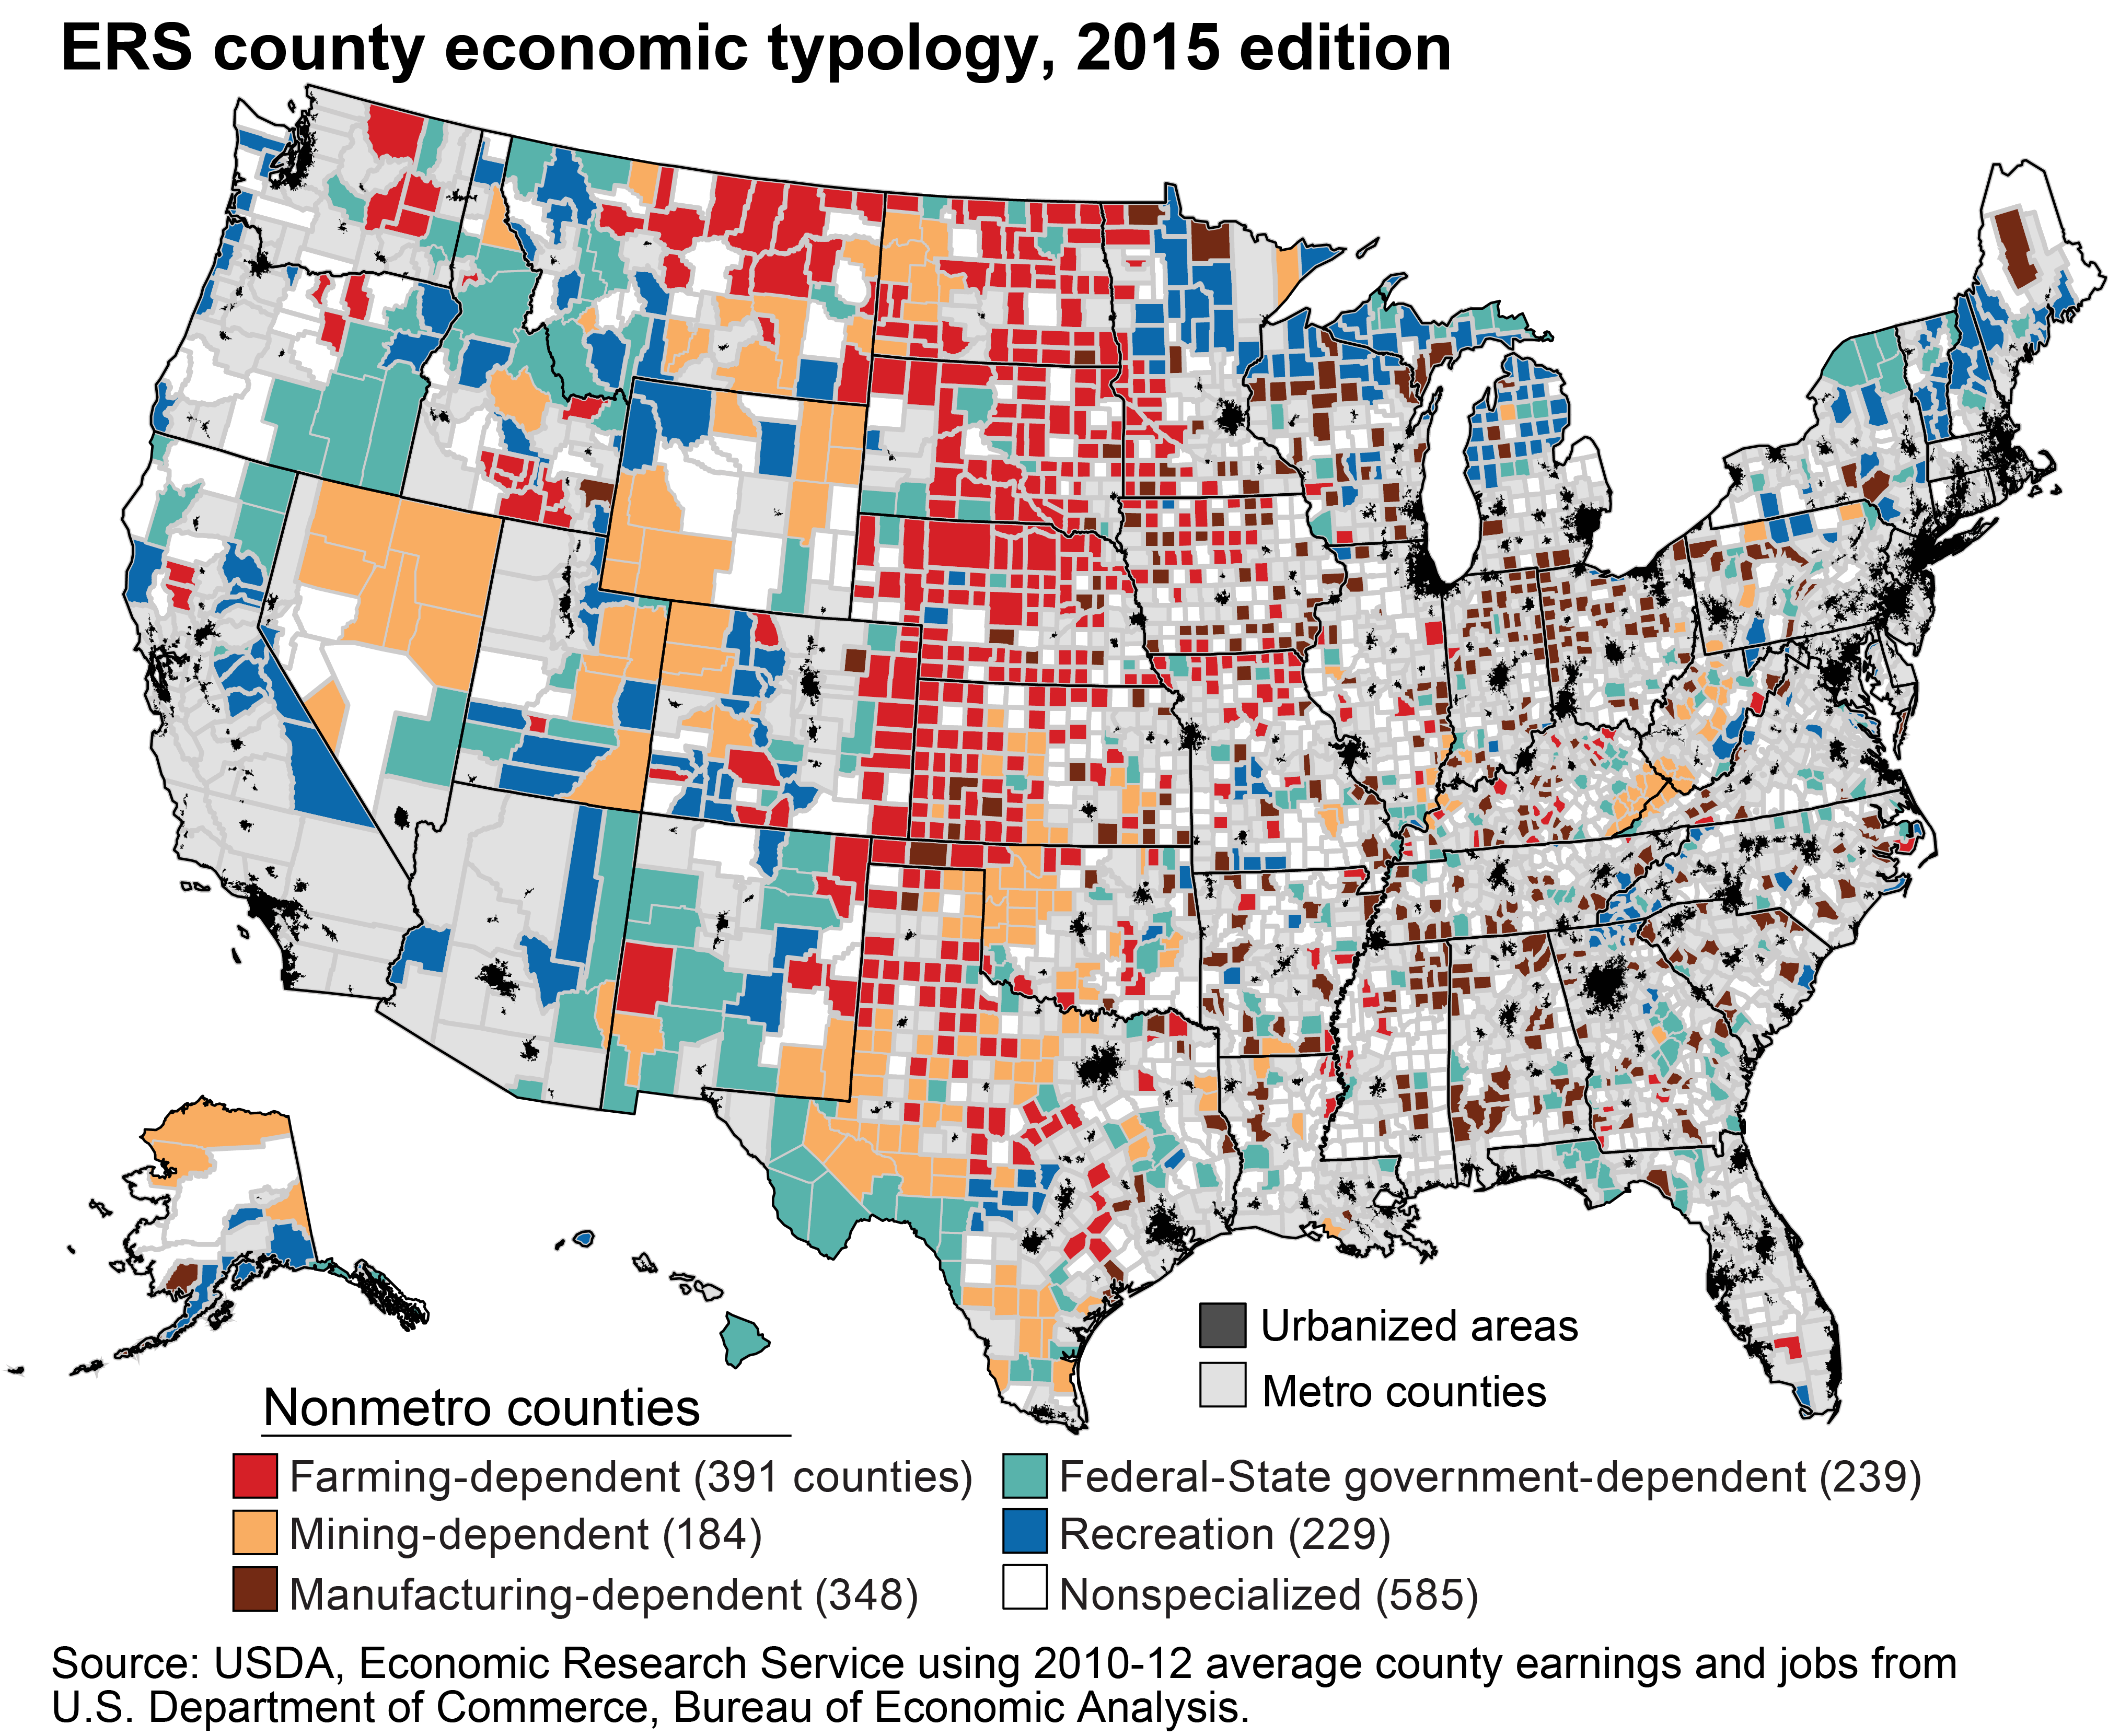
Rural areas vary in the industries that underpin their economies. Counties’ employment levels are more sensitive to economic trends that strongly affect their leading industries. For example, trends in agricultural prices have a disproportionate effect on farming-dependent counties, which accounted for nearly 20 percent of all rural counties and 6 percent of the rural population in 2017. Likewise, the boom in U.S. oil and natural gas production that peaked in 2012 increased employment in many mining-dependent rural counties. Meanwhile, the decline in manufacturing employment has particularly affected manufacturing-dependent counties, which accounted for about 18 percent of rural counties and 22 percent of the rural population in 2017.