U.S. agriculture and rural life underwent a tremendous transformation in the 20th century. Early 20th century agriculture was labor intensive, and it took place on many small, diversified farms in rural areas where more than half the U.S. population lived. Agricultural production in the 21st century, on the other hand, is concentrated on a smaller number of large, specialized farms in rural areas where less than a fourth of the U.S. population lives. The following charts provide an overview of these trends, as well as trends in farm sector and farm household incomes.
Farming and Farm Income
- Updated: 3/12/2025
- Contact: Website Administrator
-
The number of U.S. farms continues slow decline
- by Katherine Lacy
- 3/12/2025
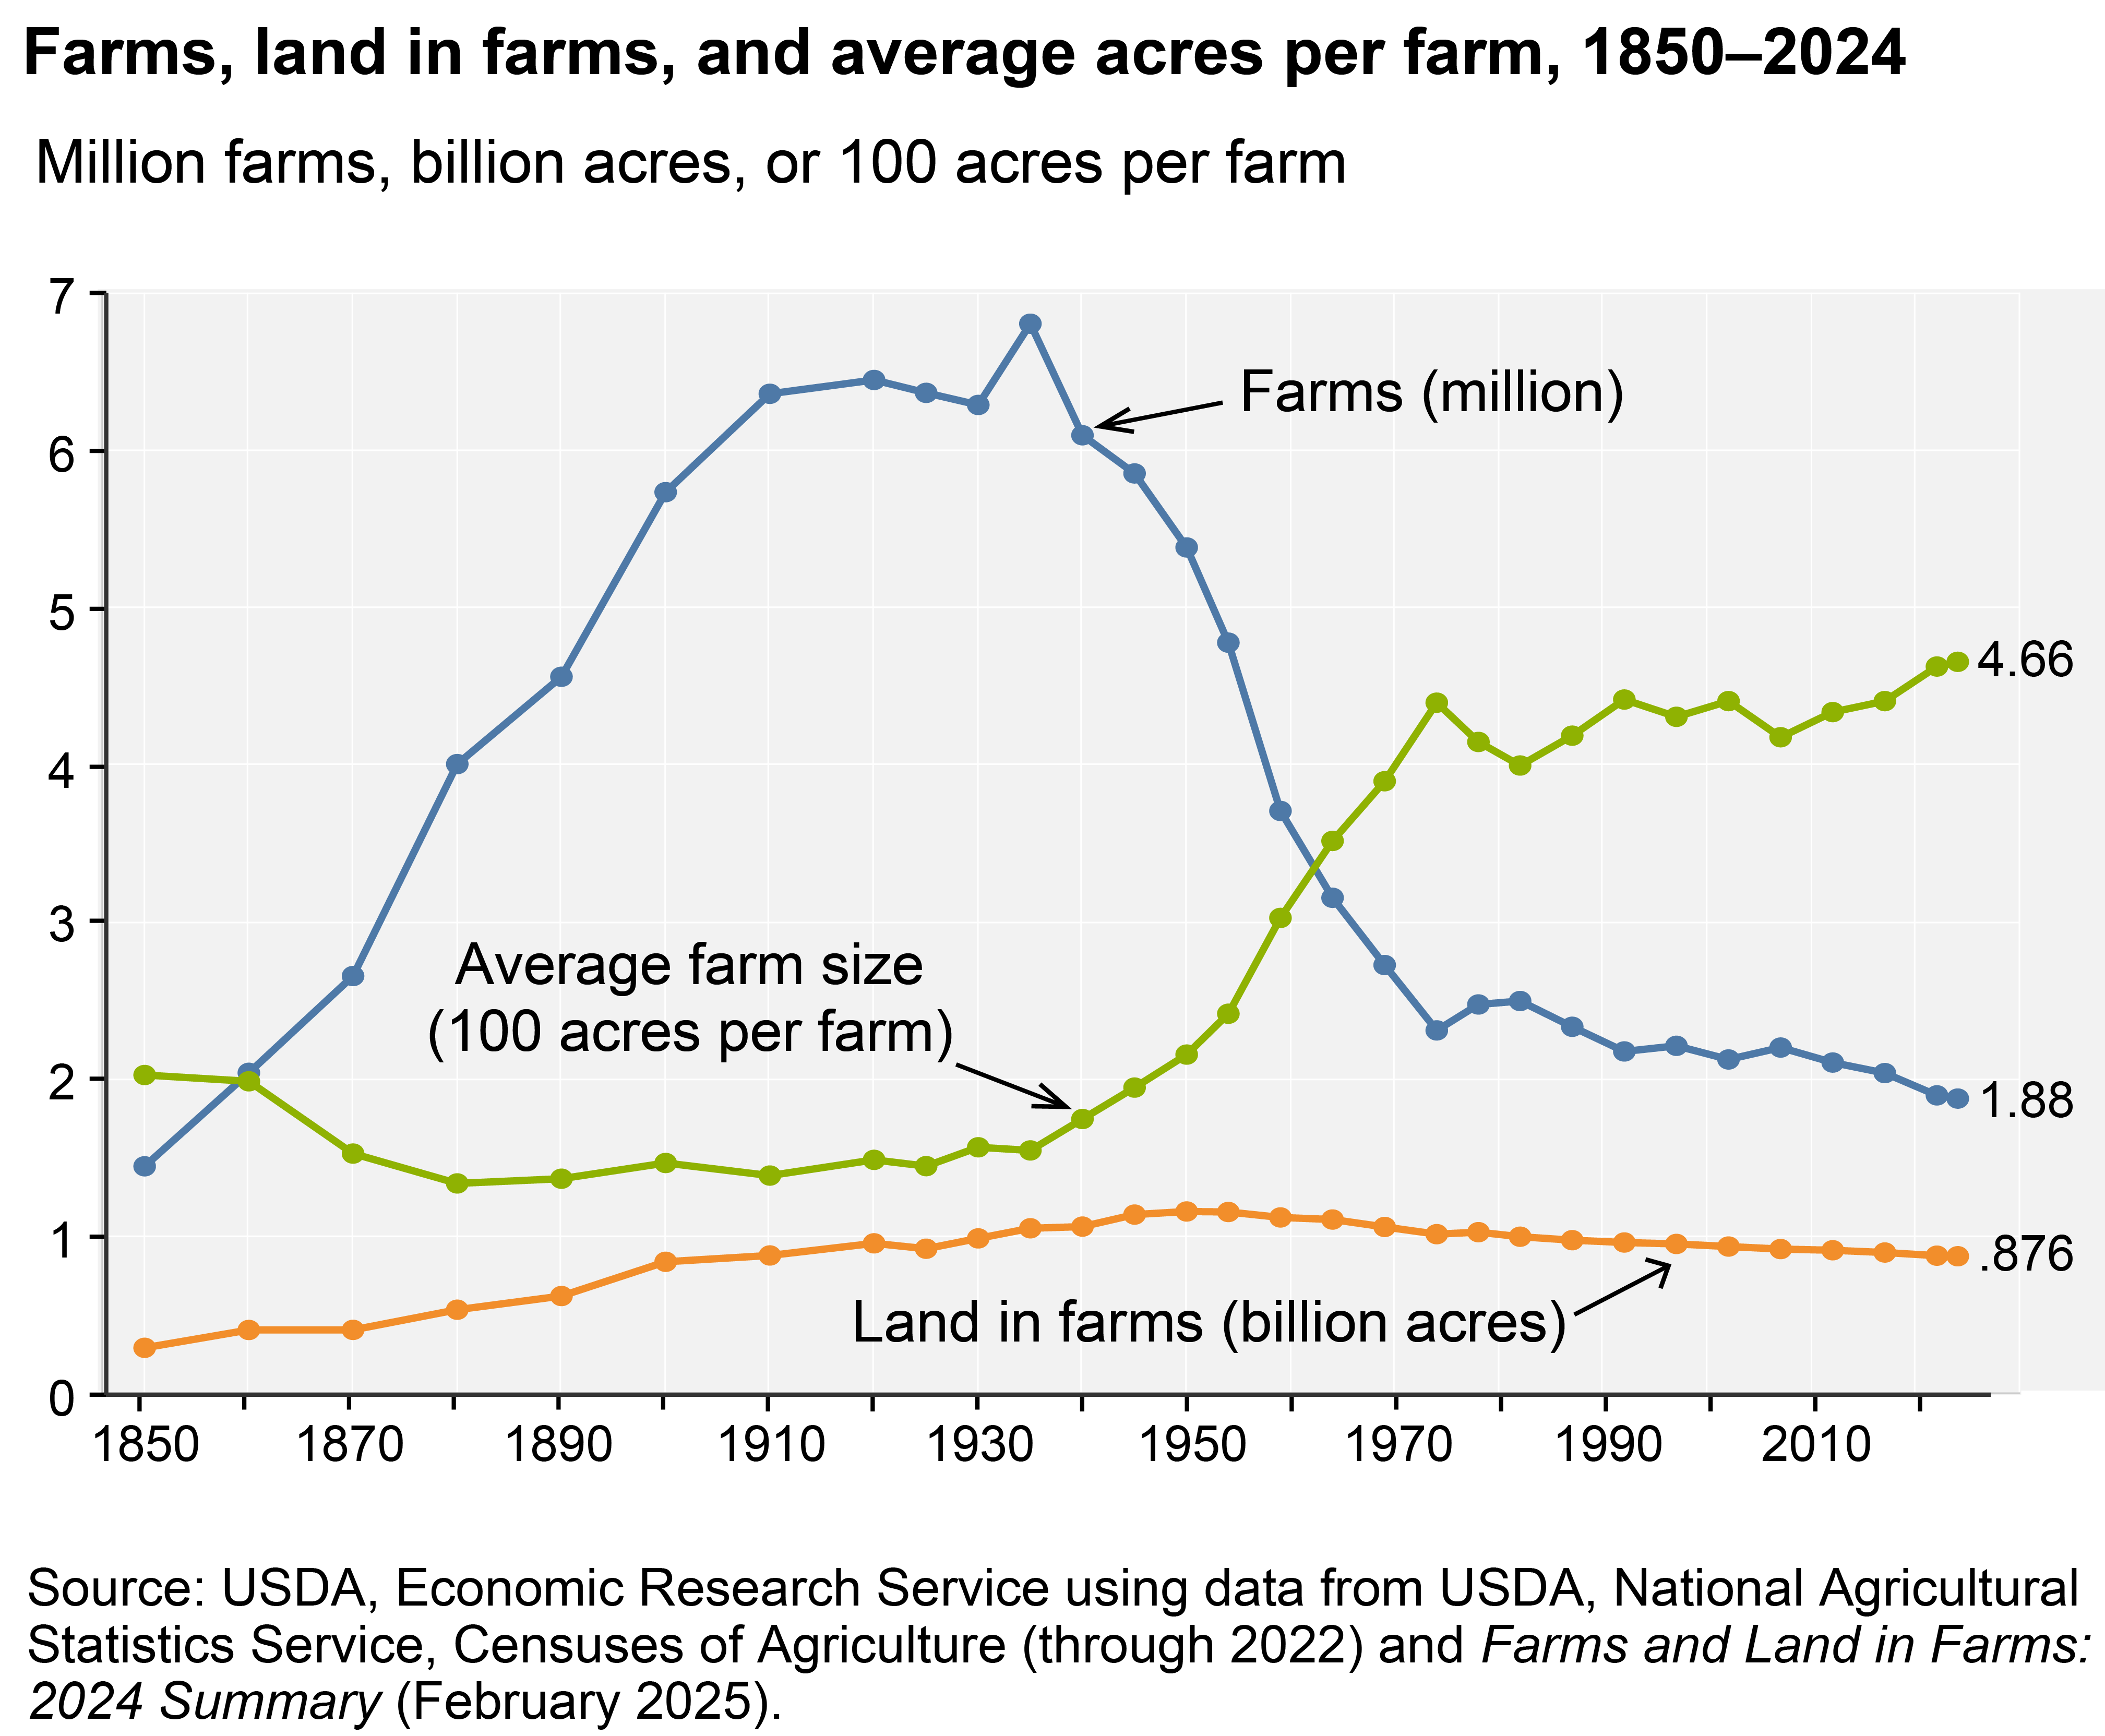
After peaking at 6.8 million farms in 1935, the number of U.S. farms fell sharply until the early 1970s. Rapidly falling farm numbers during the earlier period reflected growing productivity in agriculture and increased nonfarm employment opportunities. Since 1982, the number of U.S. farms has continued to decline, but much more slowly. In the most recent survey, there were 1.88 million U.S. farms in 2024, down 8 percent from the 2.04 million found in the 2017 Census of Agriculture. Similarly, acres of land in farms continued a downward trend with 876 million acres in 2024, down 3 percent from 900 million acres in 2017. The average farm size was 466 acres in 2024, only slightly greater than the 440 acres recorded in the early 1970s. -
Productivity growth is the major driver of U.S. agricultural output growth
- by Kathleen Kassel
- 1/12/2024
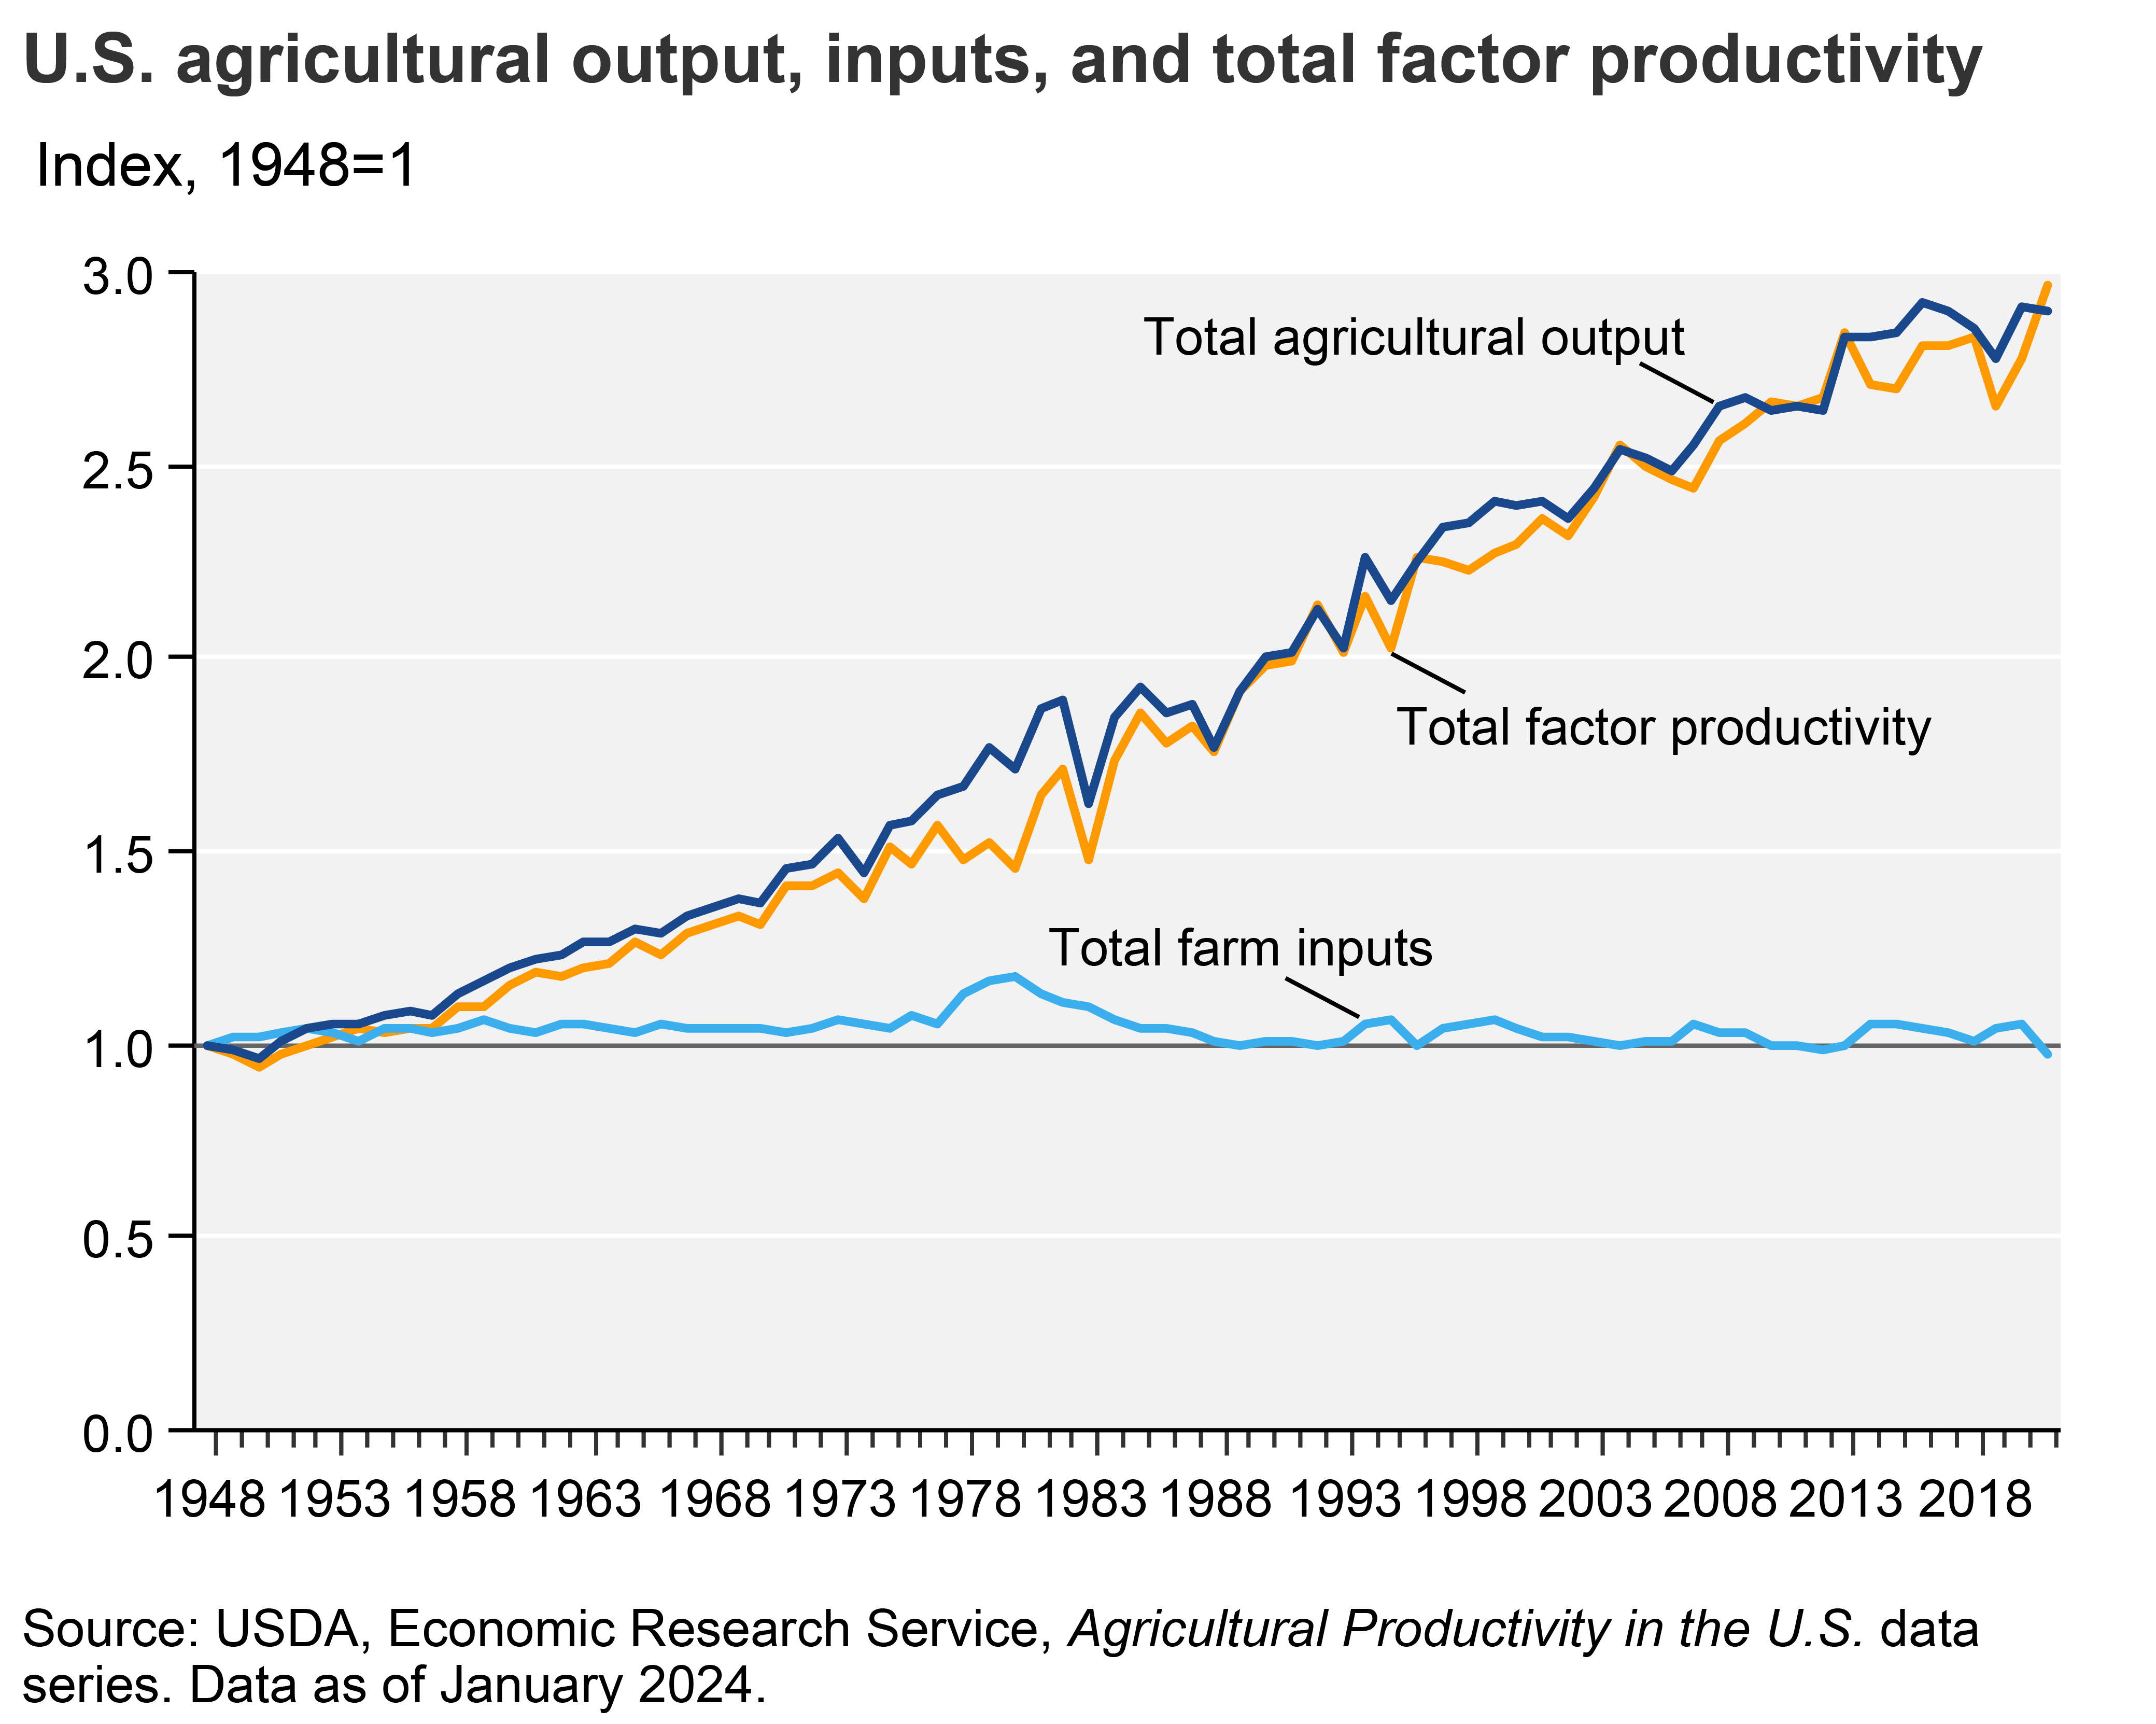
Technological developments in agriculture have been influential in driving changes in the farm sector. Innovations in animal and crop genetics, chemicals, equipment, and farm organization have enabled continuing output growth without adding much to inputs. As a result, even as the amount of land, labor, and other inputs used in farming declined, total farm output nearly tripled between 1948 and 2021. -
U.S. gross cash farm income to increase in 2025
- by Farm Income Team
- 2/6/2025
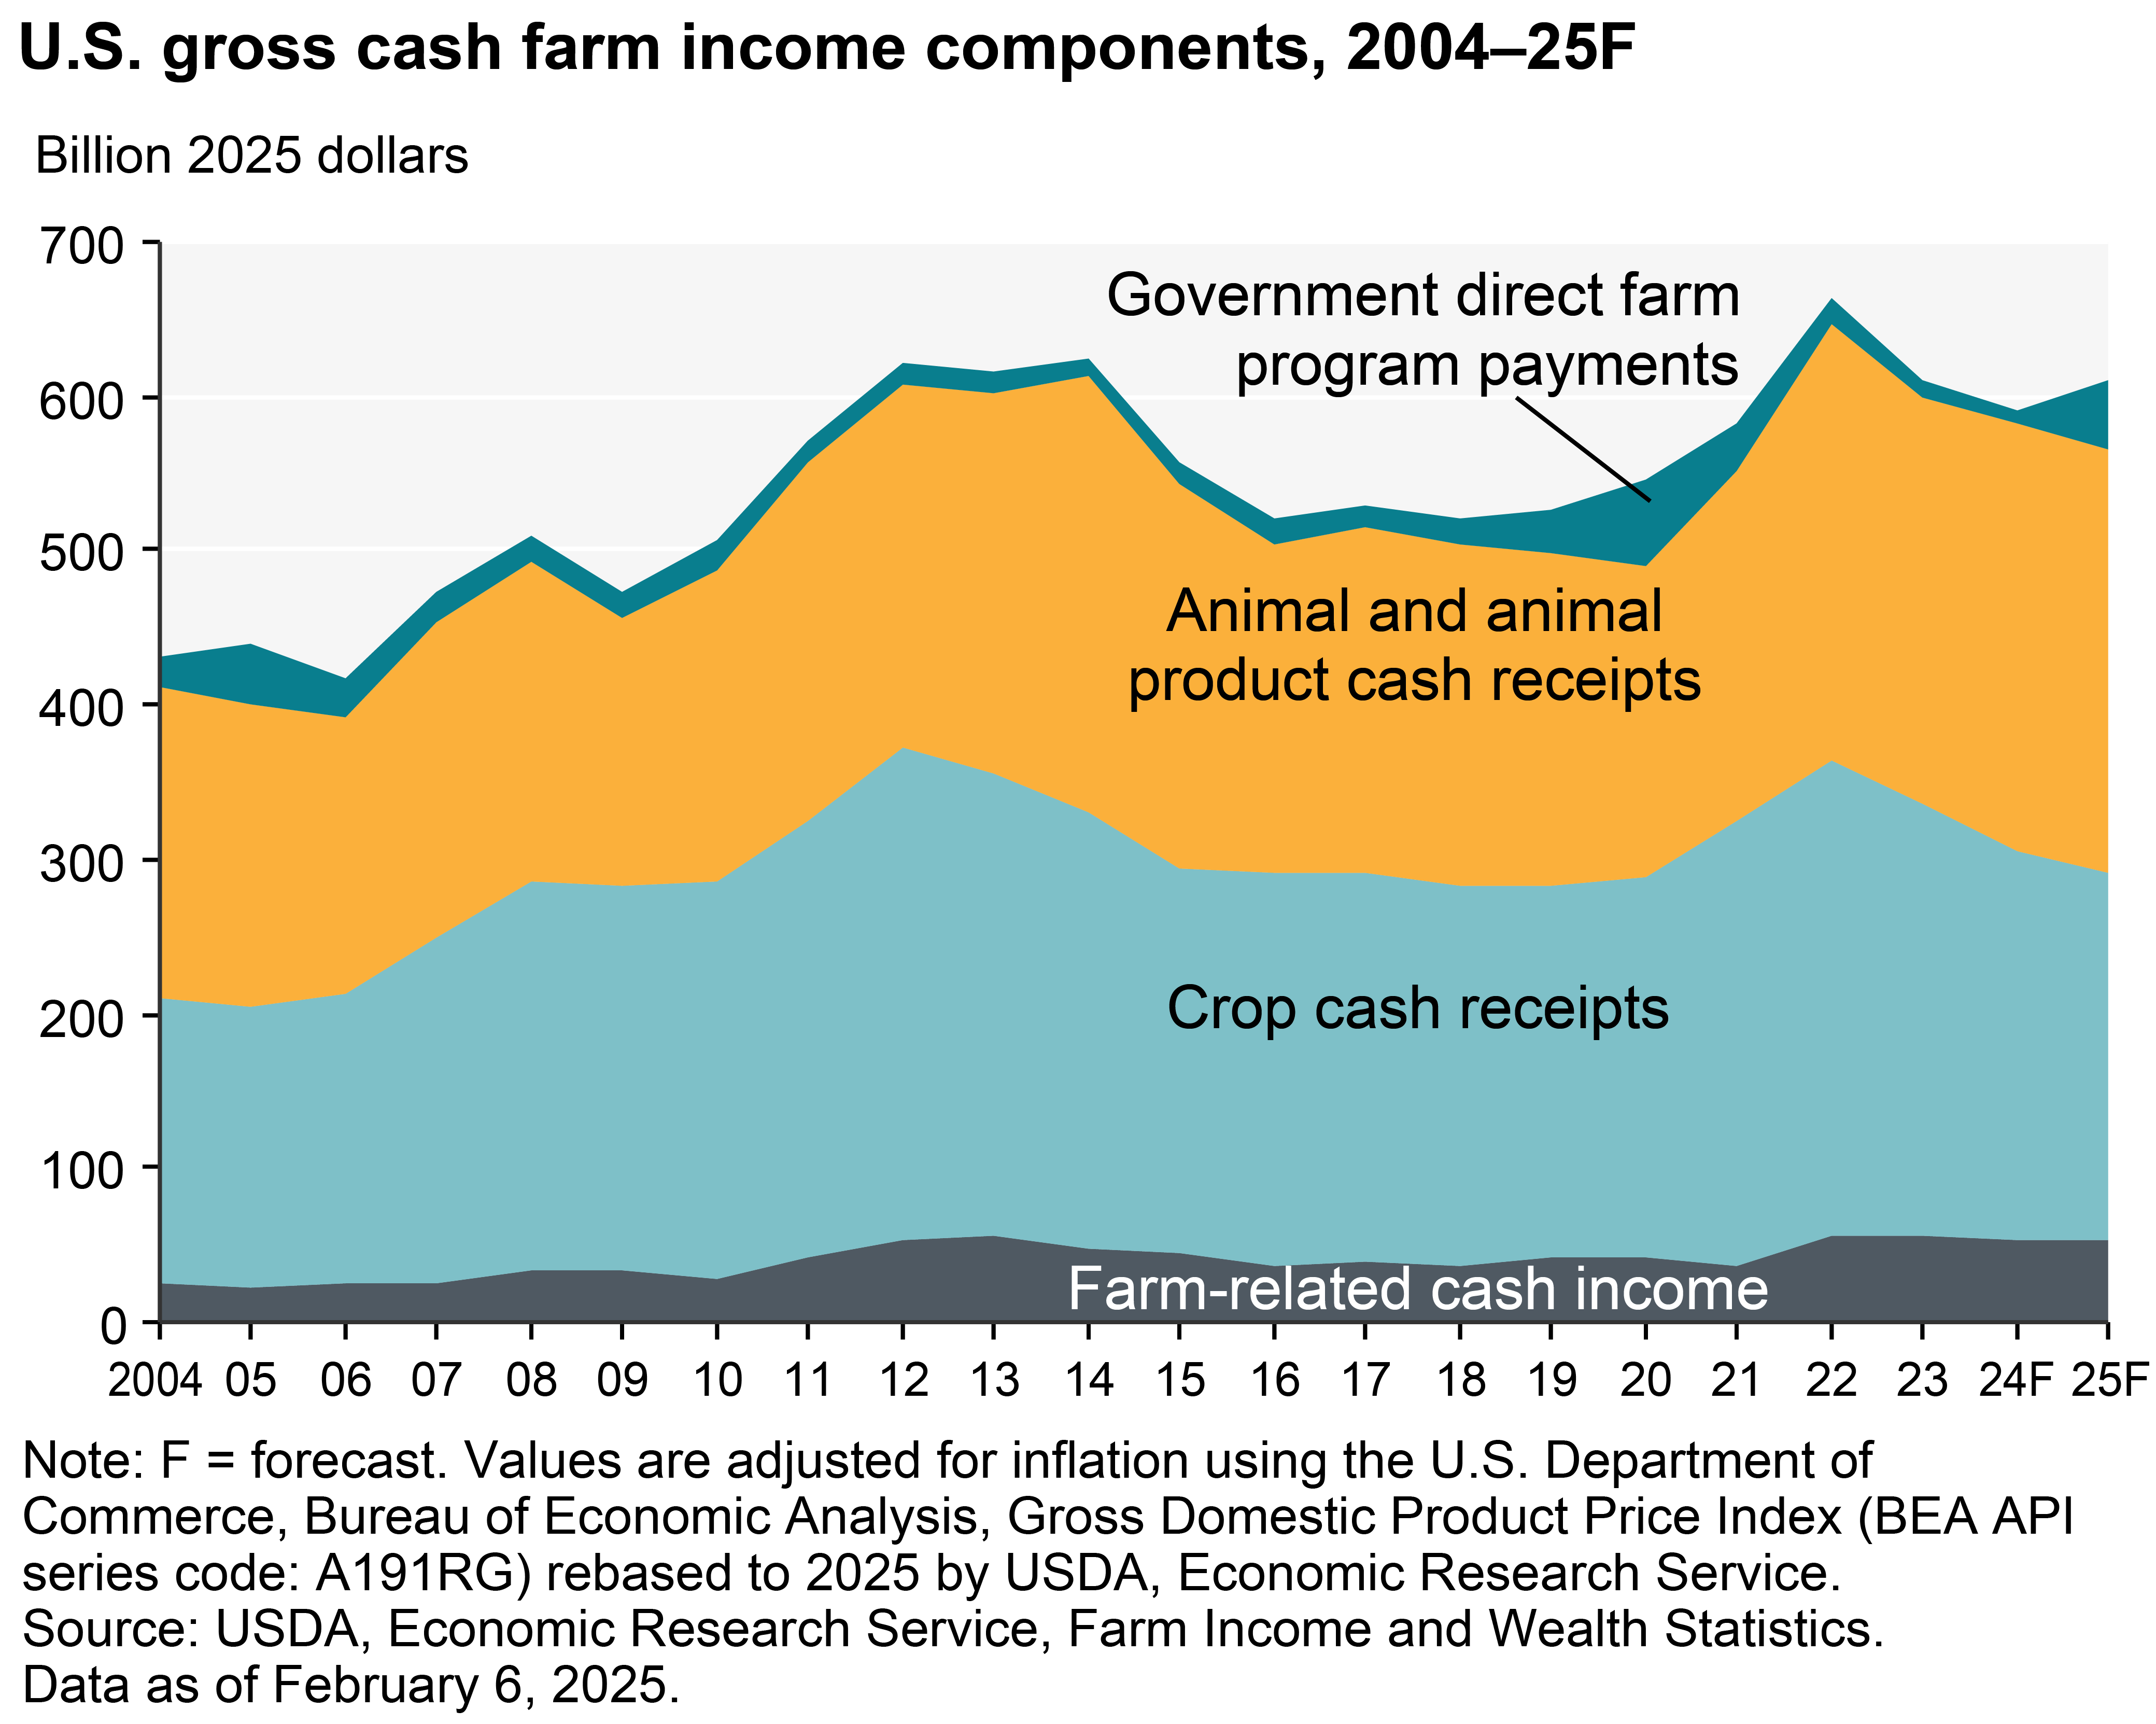
Gross cash farm income (GCFI) is annual income before expenses and includes cash receipts, farm-related income, and Government farm program payments. In inflation-adjusted 2025 dollars, GCFI is forecast at $609.4 billion in 2025, versus $432.5 billion in 2004, with the increase across time primarily due to higher cash receipts. If forecasts are realized, GCFI would decrease by 3.2 percent in 2024 relative to 2023 but increase by 2.9 percent in 2025. -
U.S. net farm income to increase in 2025 after a decline in 2024
- by Farm Income Team
- 2/6/2025
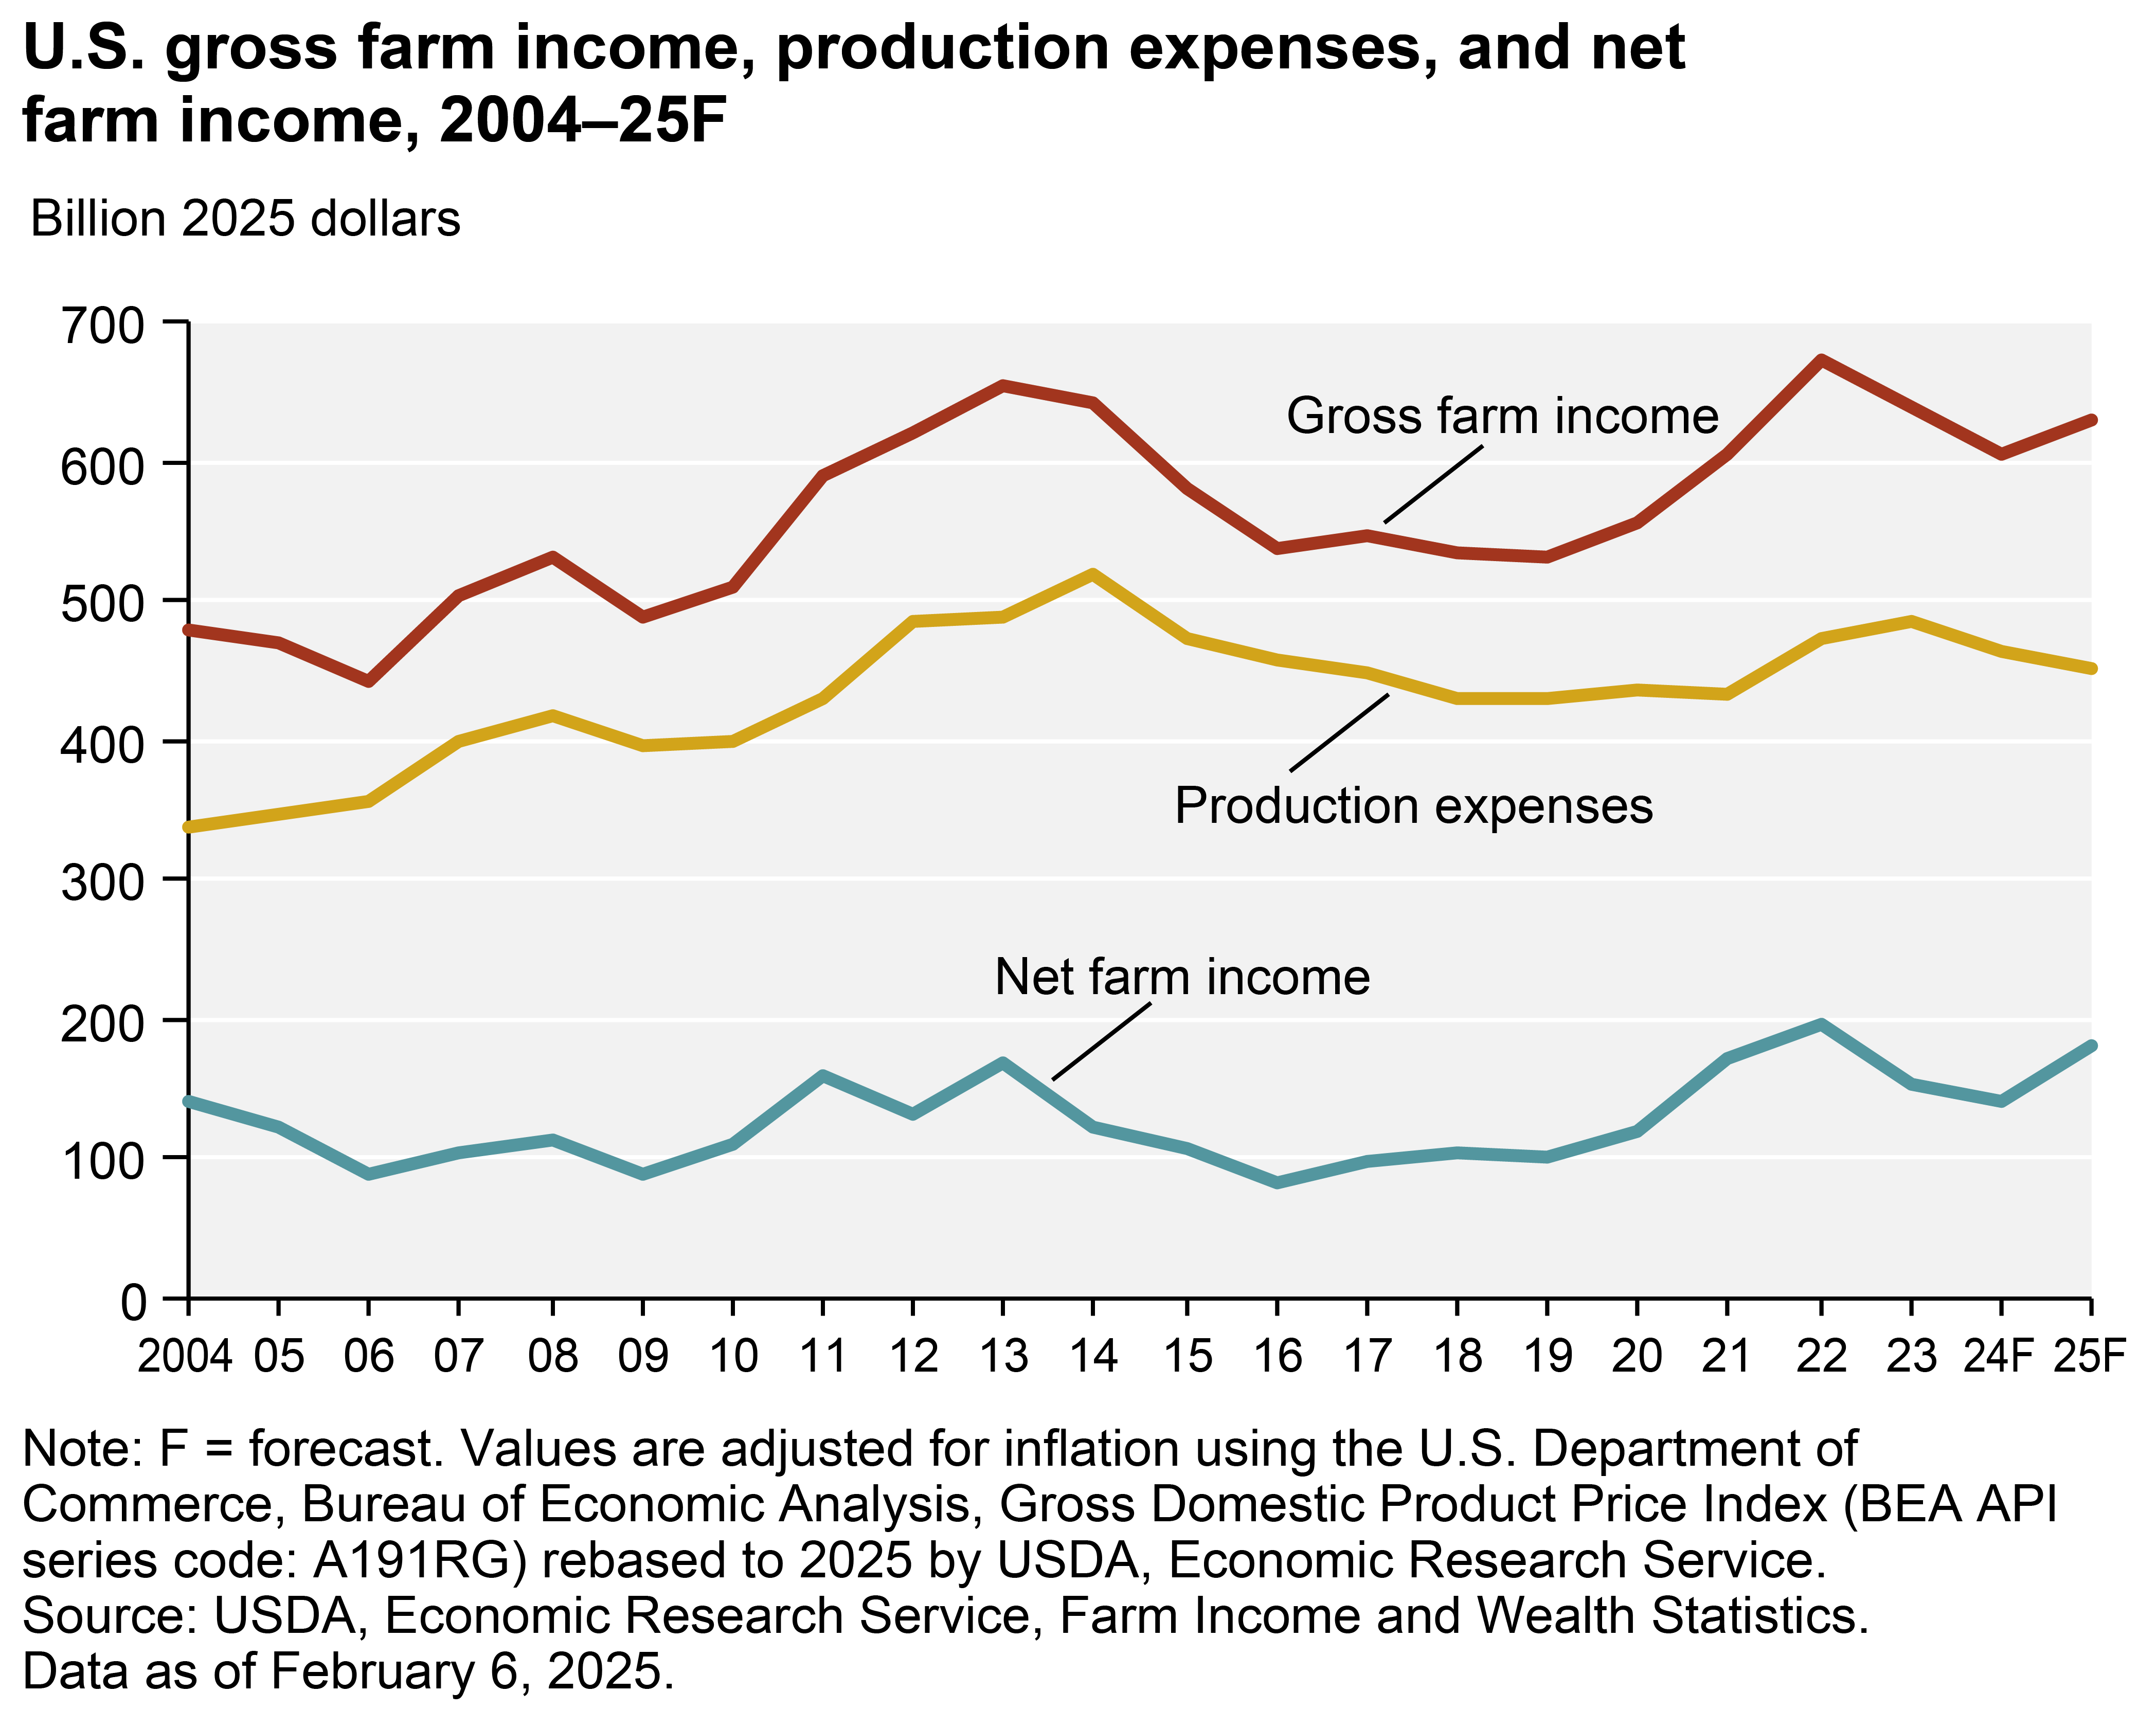
Gross farm income reflects the total value of agricultural output plus Government farm program payments. Net farm income (NFI) reflects income after expenses from production in the current year and is calculated by subtracting farm expenses from gross farm income. NFI considers cash and non-cash income and expenses and accounts for changes in commodity inventories. In 2024, inflation-adjusted net farm income is forecast to have decreased 7.8 percent relative to 2023 to $142.4 billion. However, it is expected to increase by 26.4 percent in 2025 to reach $180.1 billion. Farm production expenses are projected to have decreased in 2024 by 4.3 percent relative to 2023 and to decrease further by 2.9 percent in 2025. -
Corn, soybeans accounted for nearly half of U.S. crop cash receipts in 2023
- by Farm Income Team
- 2/6/2025
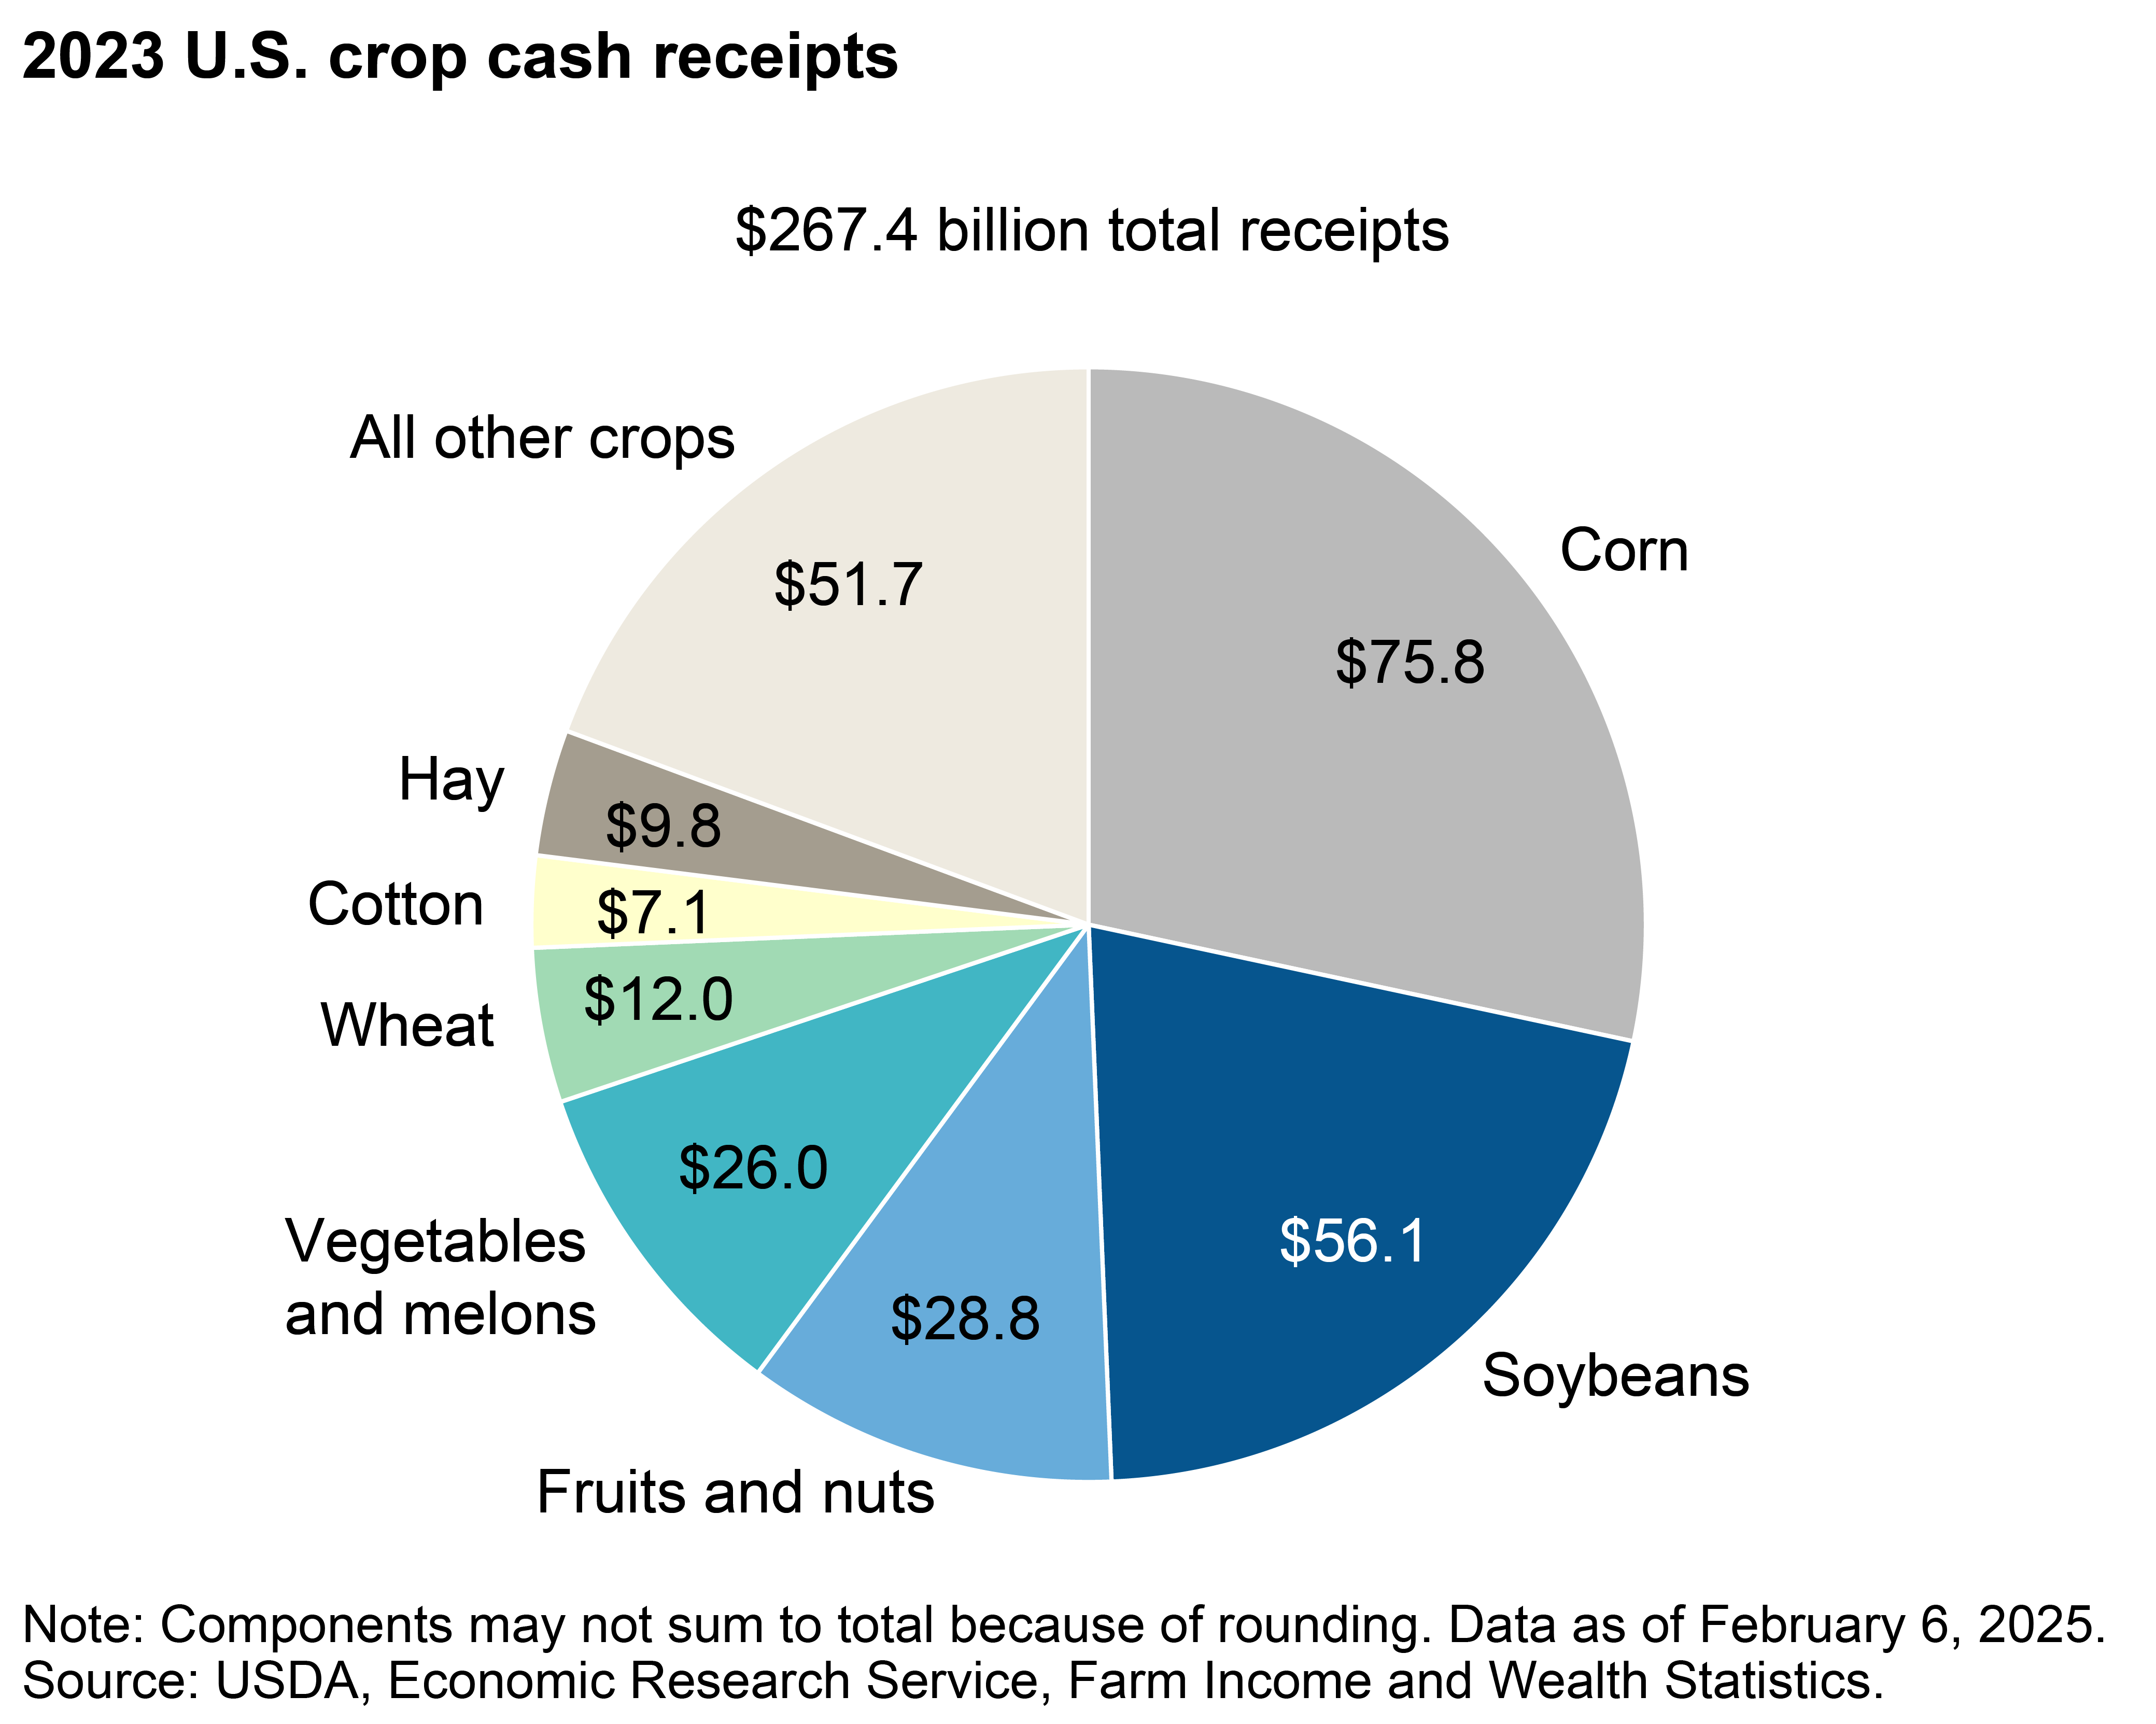
Crop cash receipts totaled $267.4 billion in calendar year 2023. Receipts from corn and soybeans accounted for $132.0 billion (49.4 percent) of the total. -
Cattle/calf receipts comprised the largest portion of U.S. animal/animal product receipts in 2023
- by Farm Income Team
- 2/6/2025
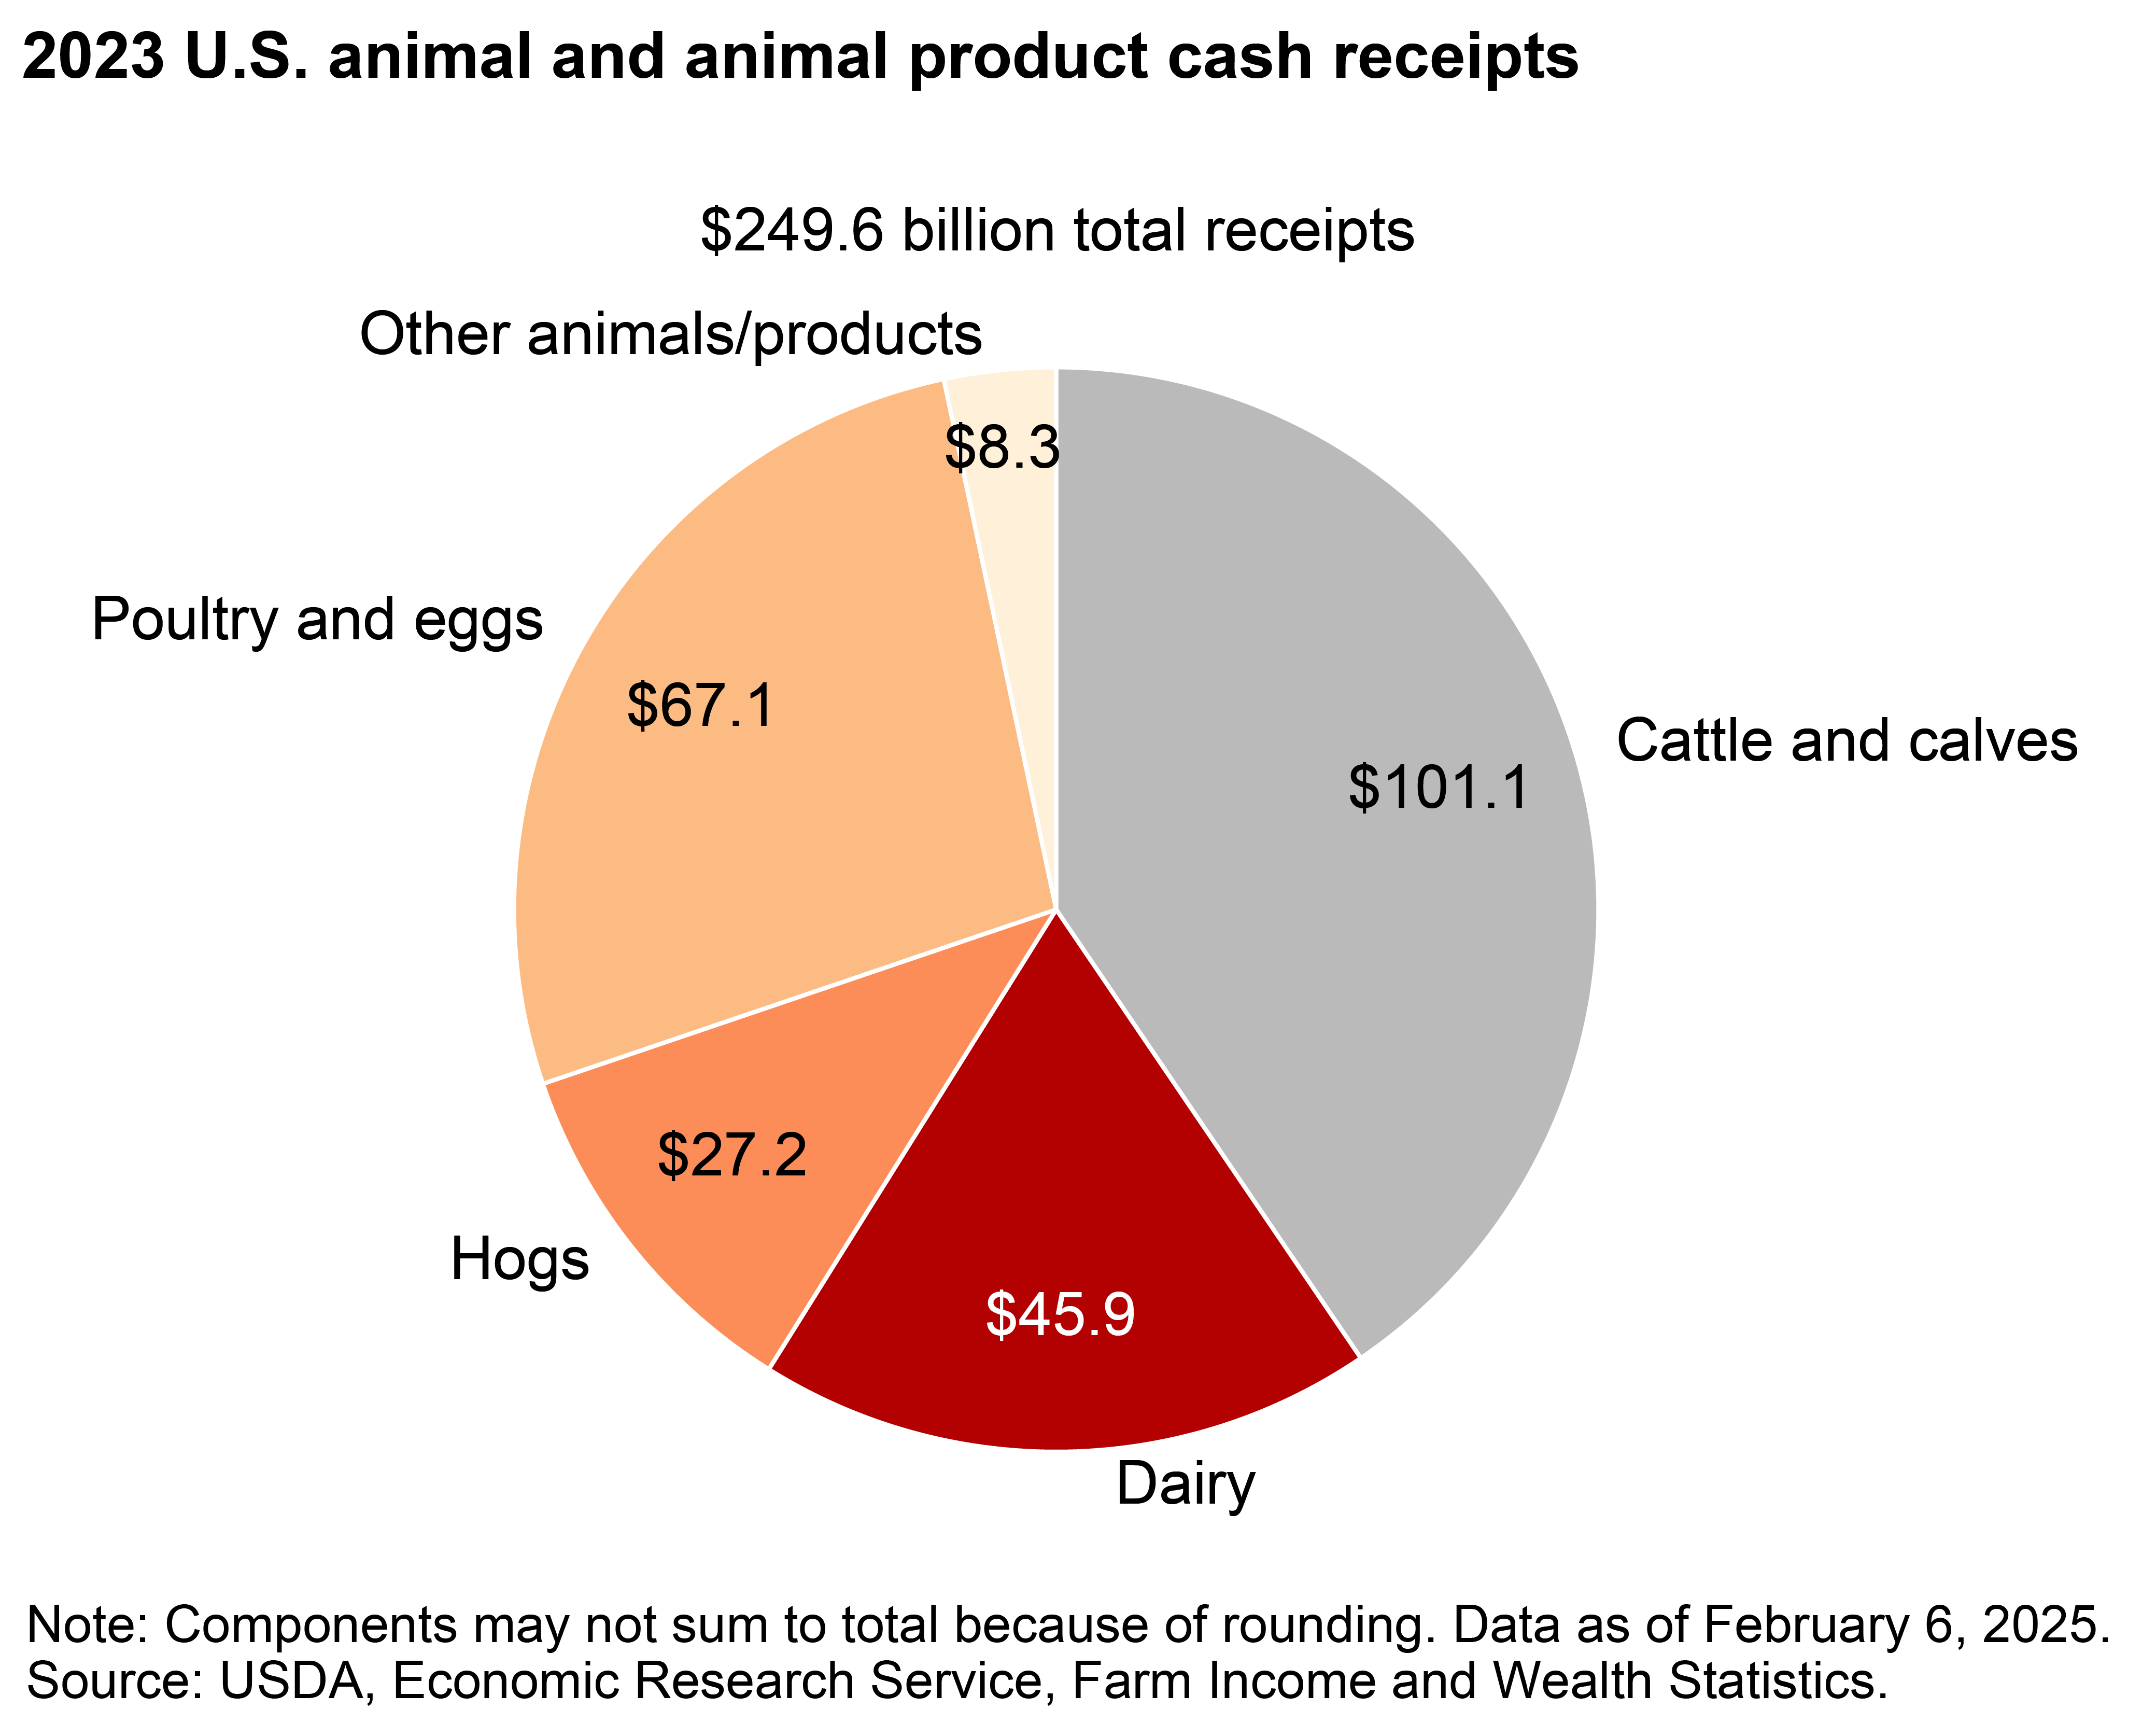
Cash receipts for animals and animal products totaled $249.6 billion in calendar year 2023. Cattle/calf receipts accounted for $101.1 billion (40.5 percent) of that total, while poultry and eggs receipts accounted for $67.1 billion (26.9 percent), and dairy receipts accounted for $45.9 billion (18.4 percent). -
Most farms are small, but large farms account for the largest share of production value
- by Farm Income Team
- 12/3/2024
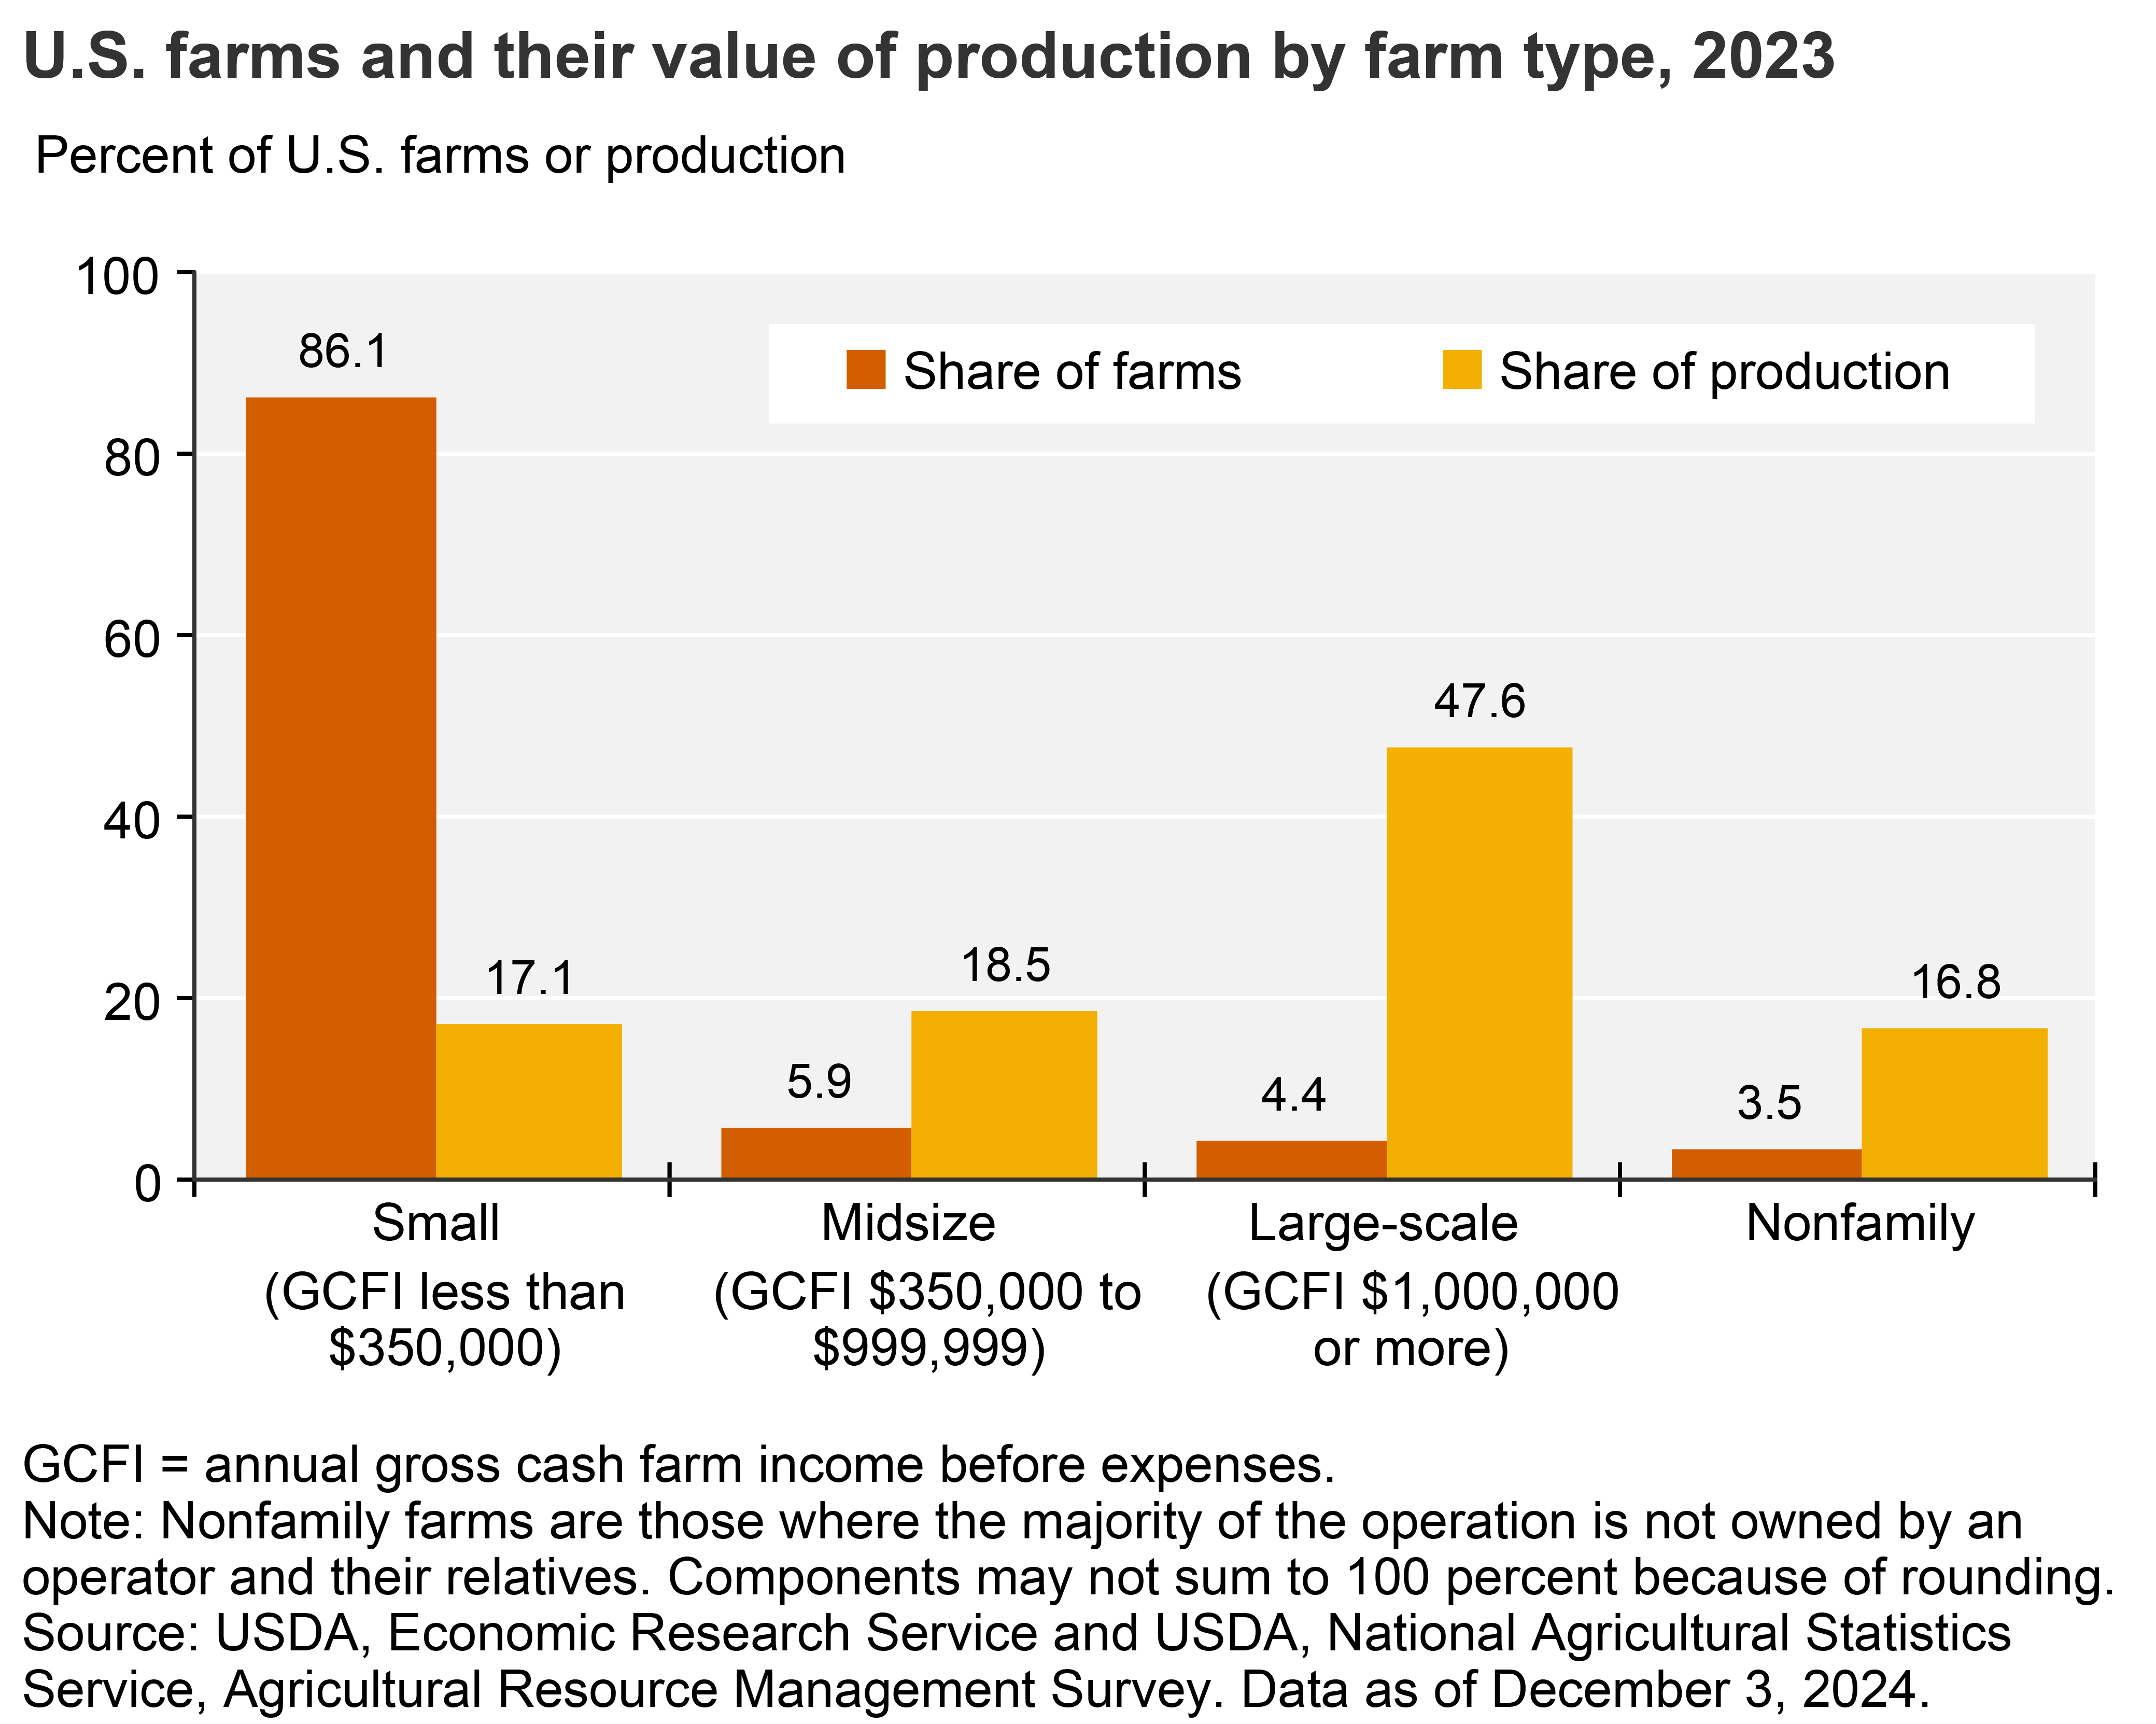
Gross cash farm income (GCFI) includes income from commodity cash receipts, farm-related income, and Federal Government payments. Family farms (where the majority of the business is owned by the operator and individuals related to the operator) of various types together accounted for 96 percent of U.S. farms in 2023. Small family farms (less than $350,000 in GCFI) accounted for 86 percent of all U.S. farms. Large-scale family farms ($1 million or more in GCFI) accounted for about 4 percent of farms and nearly 48 percent of the value of production. -
Most farmers receive off-farm income; small-scale operators depend on it
- by Farm Income Team
- 12/3/2024
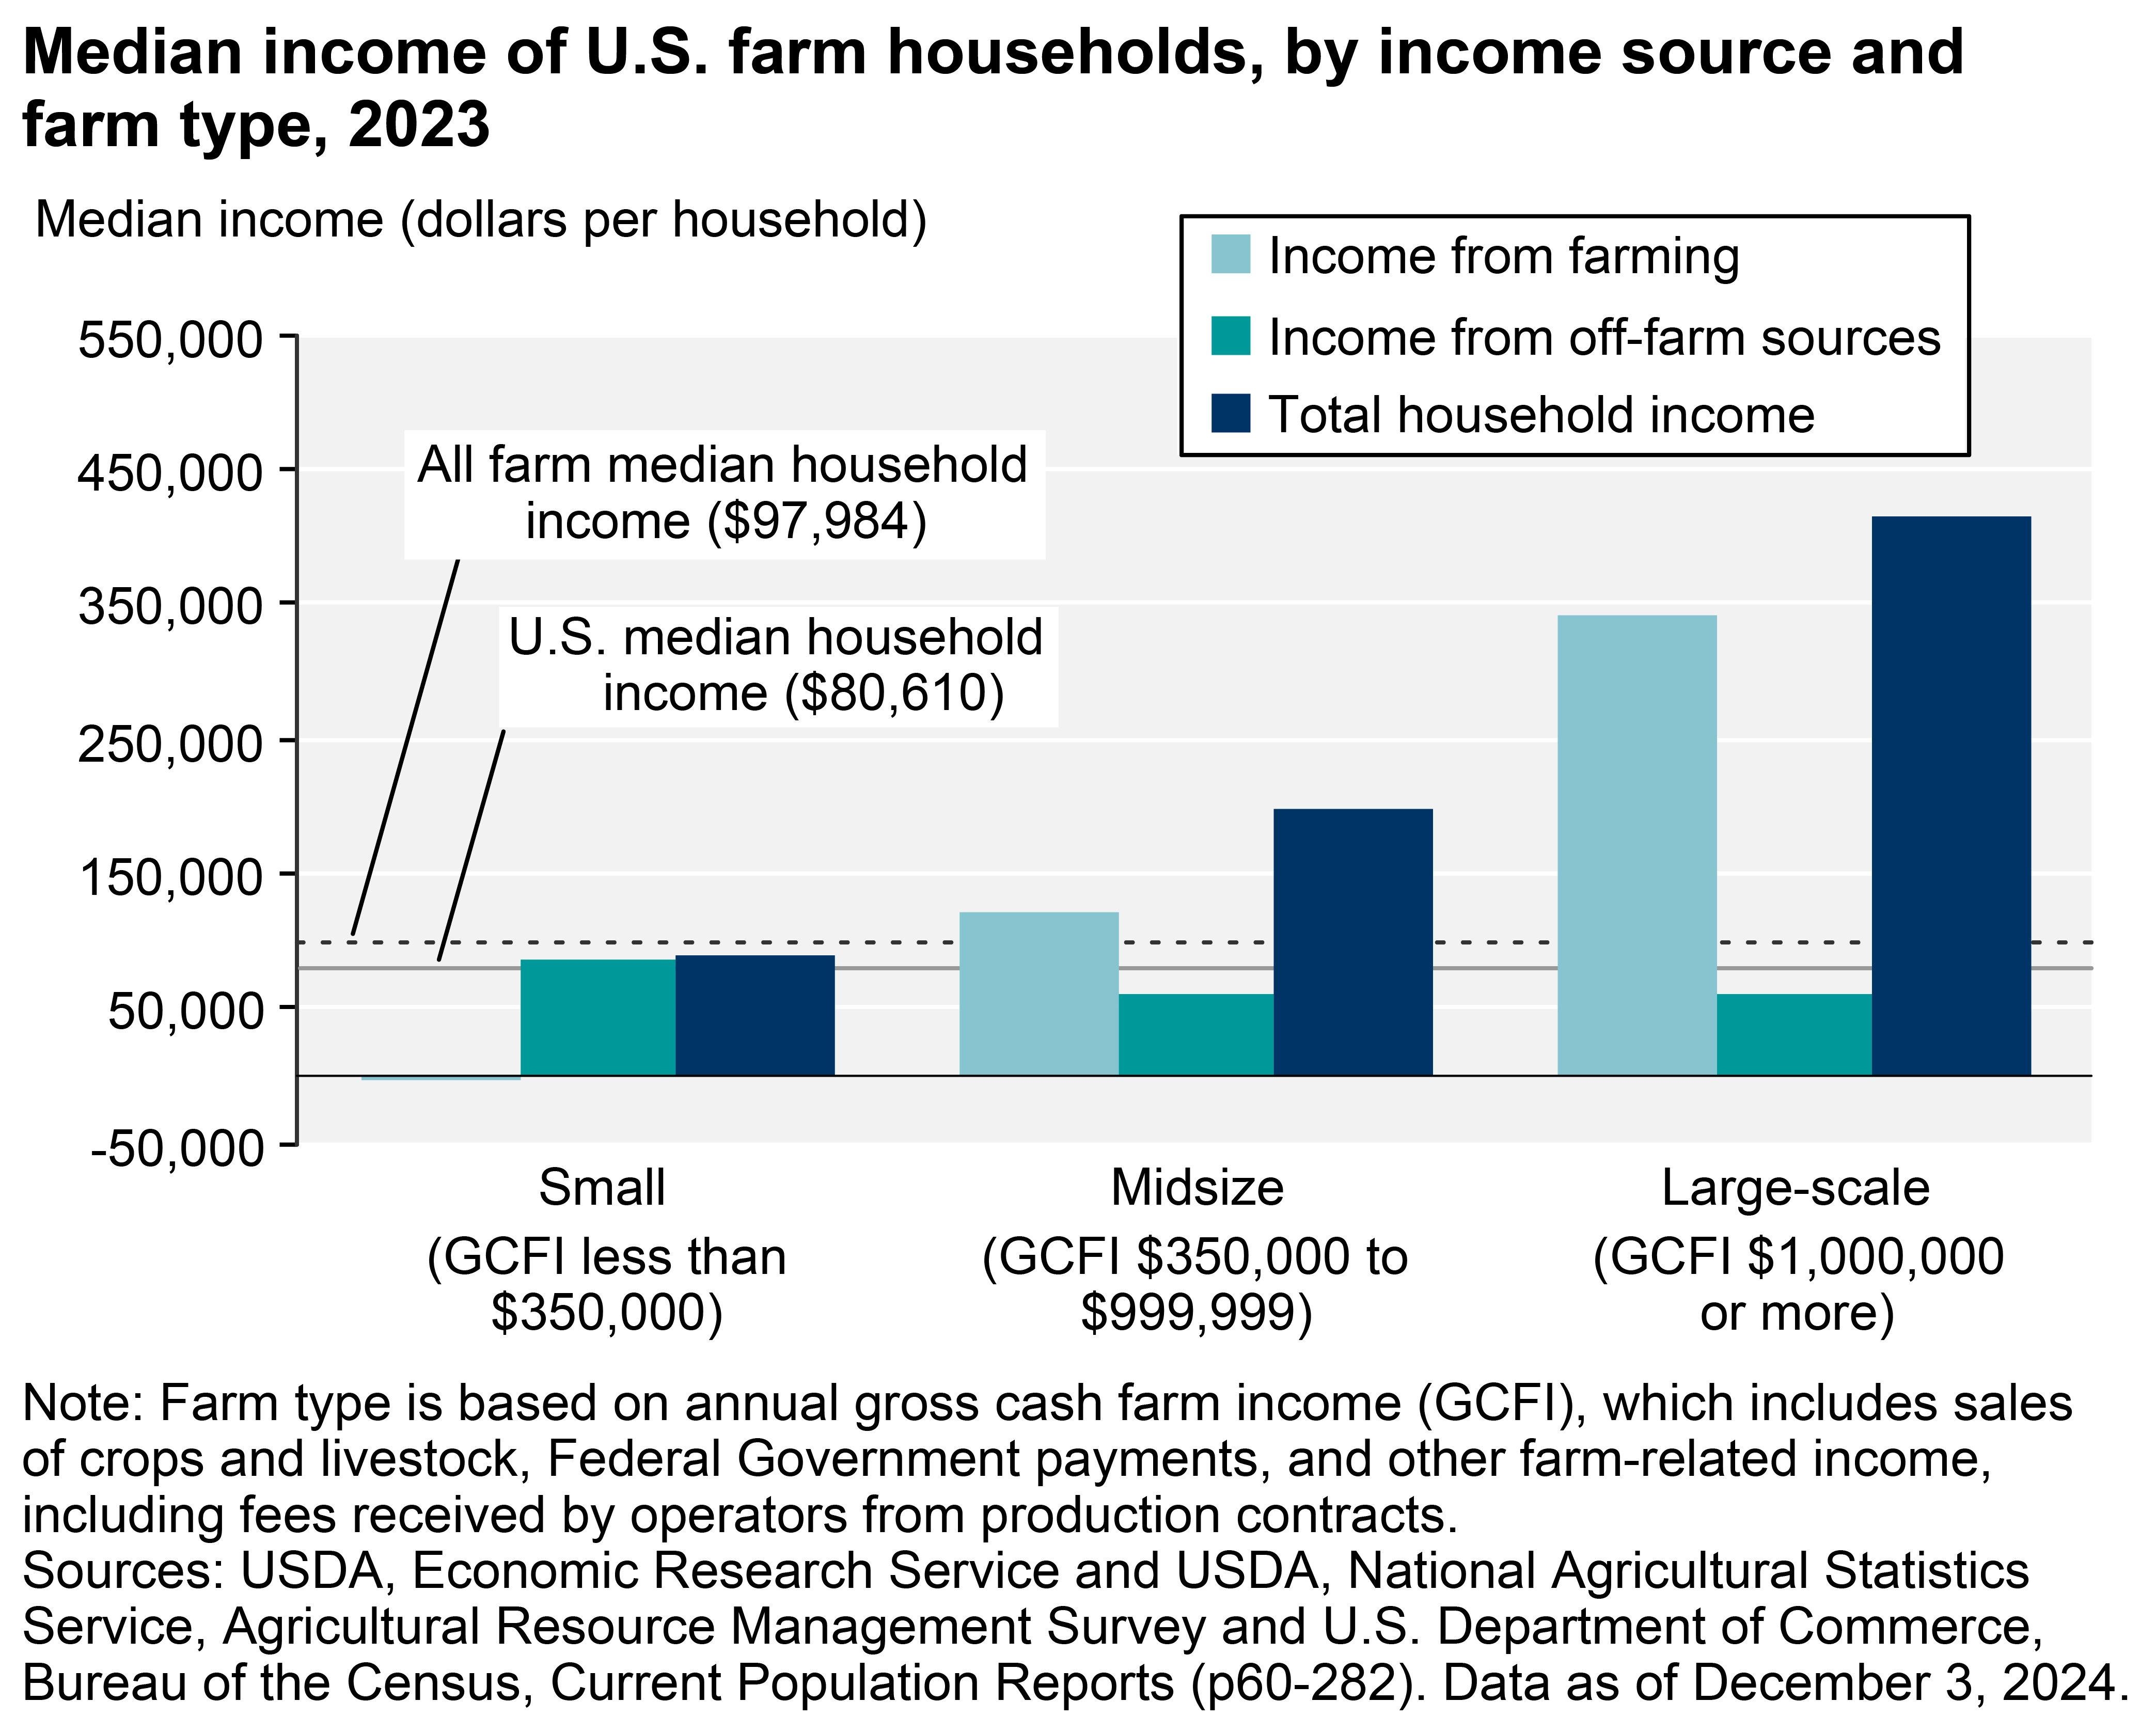
Median total household income among all farm households ($97,984) exceeded the median total household income for all U.S. households ($80,610) in 2023. Median household income and income from farming increased with farm size and most households earned some income from off-farm employment. Small family farms account for 86 percent of total farms, with gross cash farm income less than $350,000. The households operating these farms typically rely on off-farm sources for the majority of their household income. In contrast, the median household operating large-scale family farms earned $414,436 in 2023, and most of that came from farming.