The United States is the world’s largest nation in terms of agricultural product trade (and second behind the aggregated European Union). The leading U.S. agricultural exports are grains and feeds, soybeans, livestock products, tree nuts, fruits, vegetables, and consumer-oriented food products. The leading U.S. agricultural imports are processed food and beverages, and tropical products. Mexico, Canada, the European Union, and China are the top U.S. trade partners.
Agricultural Trade
- Updated: 4/1/2025
- Contact: James Kaufman
-
U.S. agricultural import values outpaced export values again in 2024
- by James Kaufman
- 4/1/2025
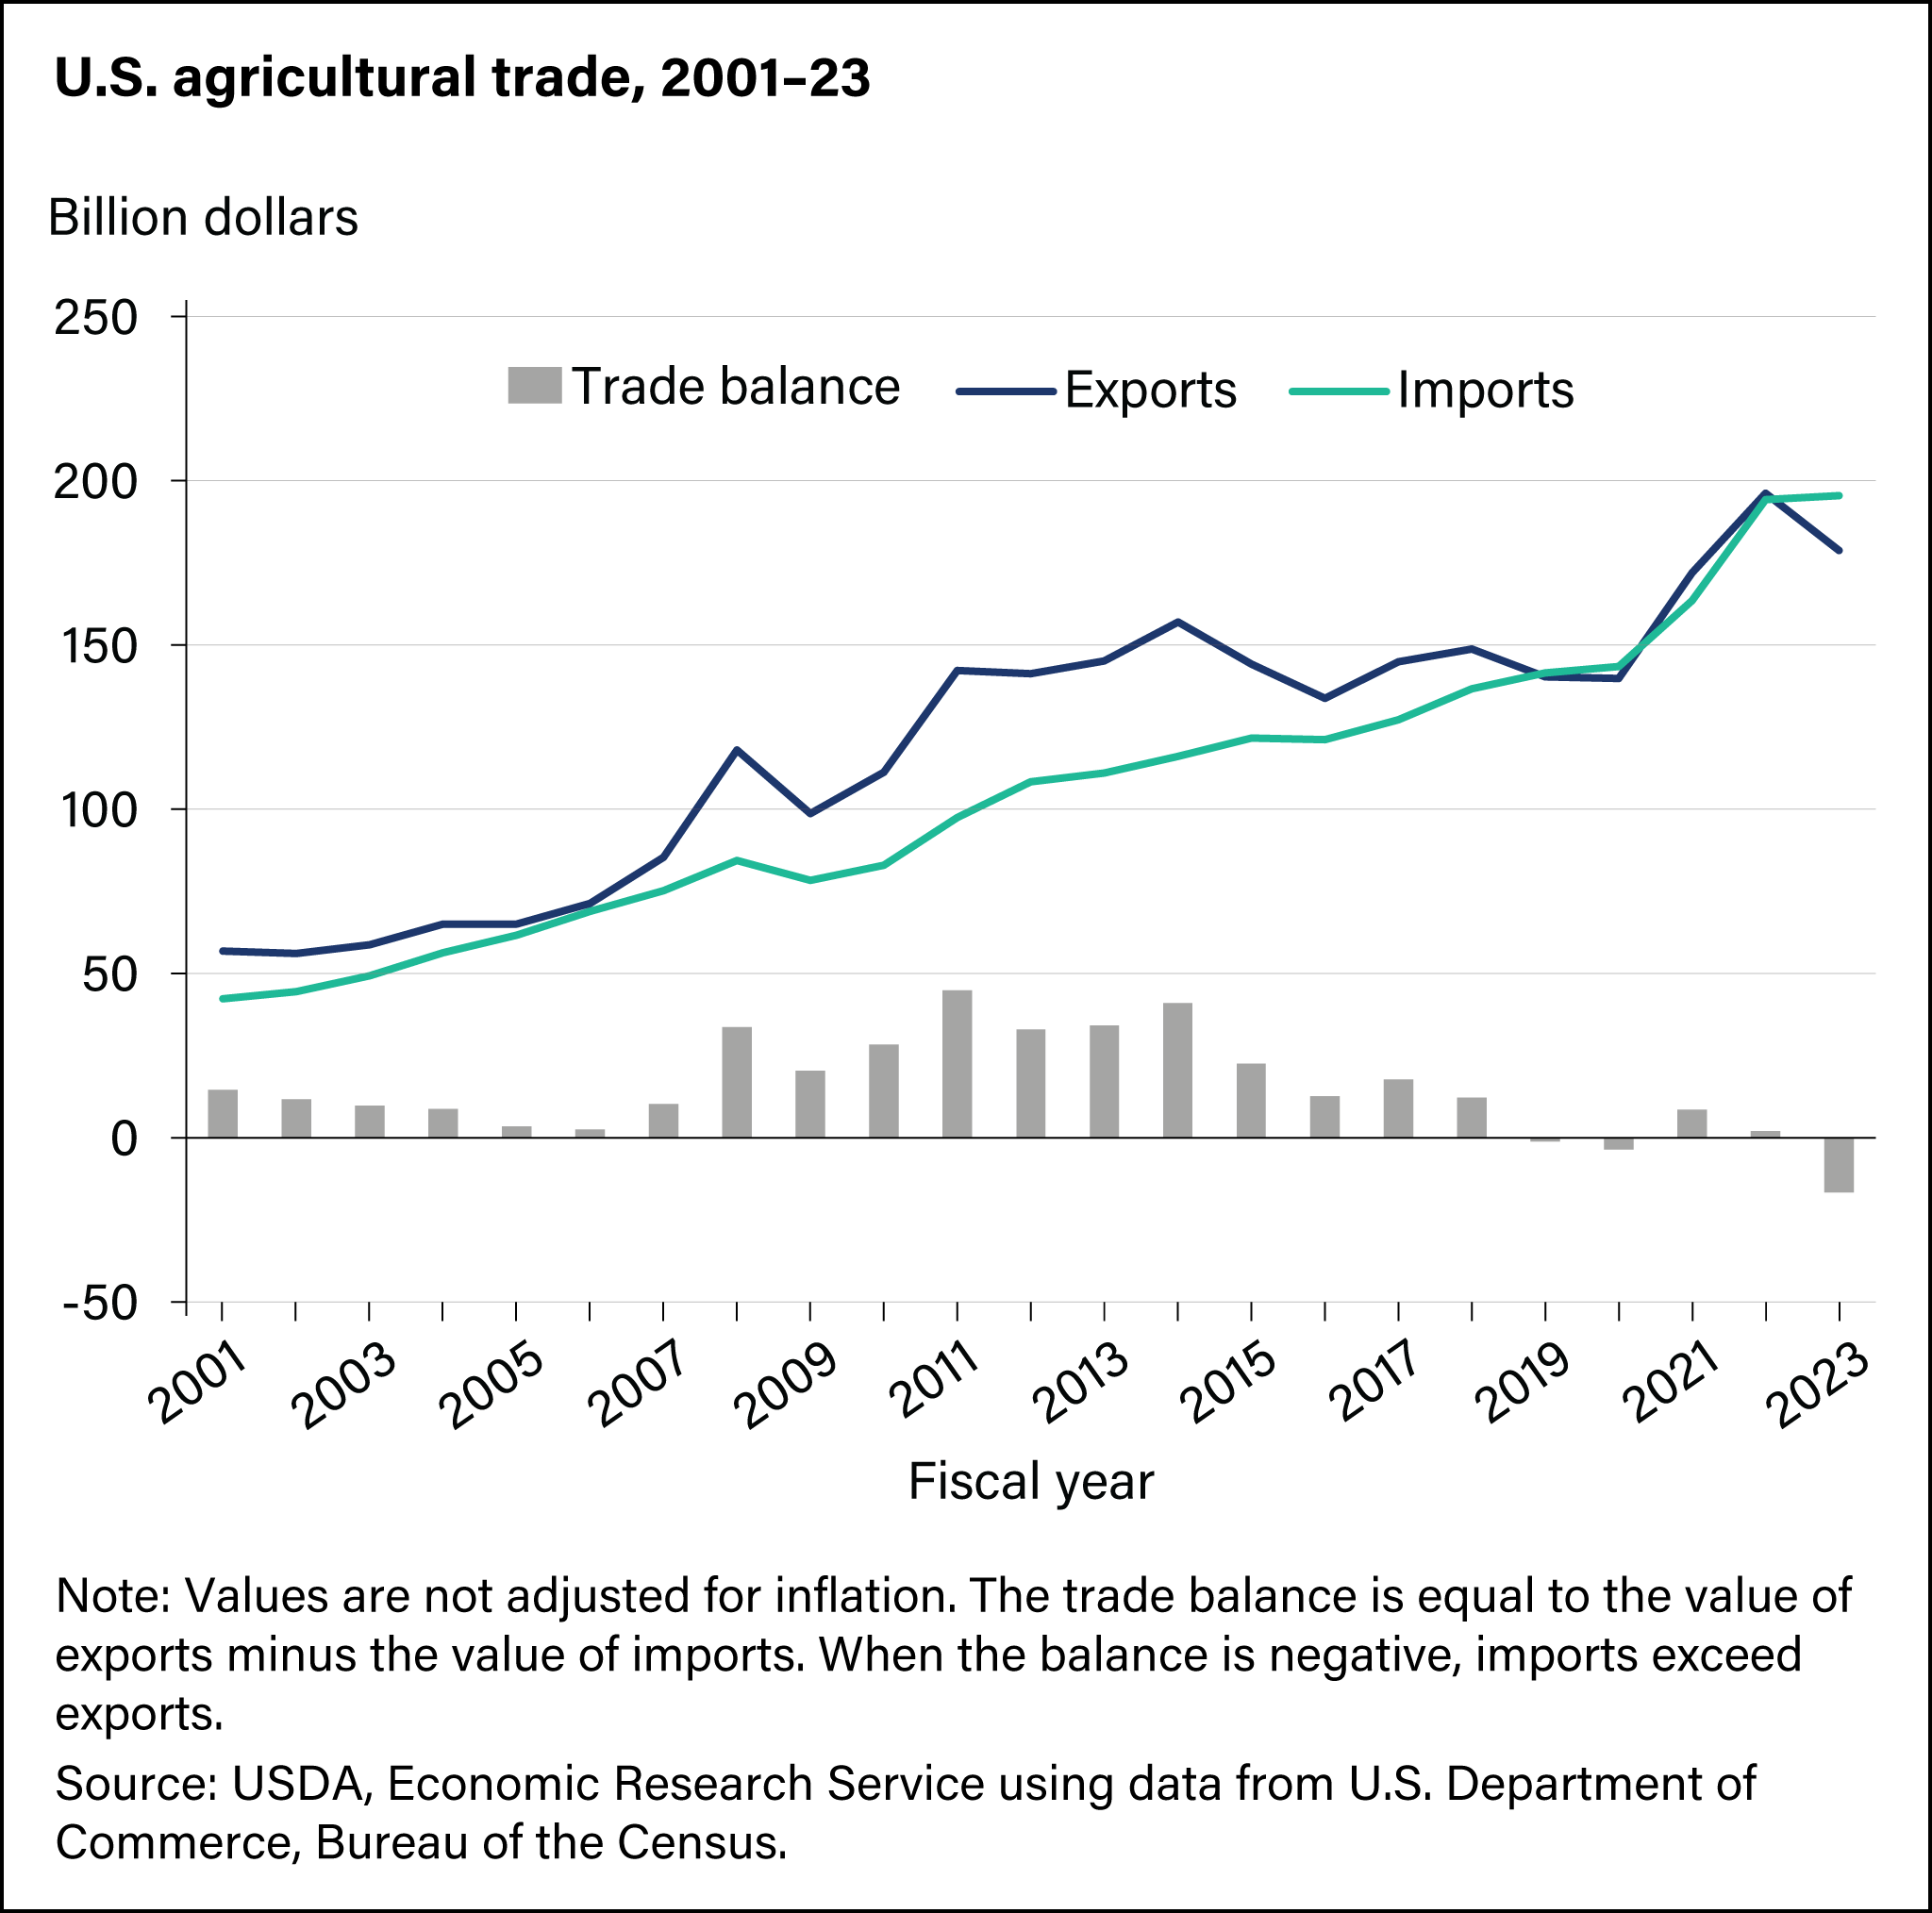
The U.S. agricultural trade balance was positive for nearly 60 years until 2019, when it shifted to a deficit. Despite record agricultural imports and exports in 2021–22, imports exceeded exports by $21 billion in 2023. Between 2014 and 2024, U.S. agricultural exports grew at 1 percent annually—hindered by competition, a strong dollar, and trade barriers—while imports rose 6 percent during that time. U.S. agricultural import growth has been driven by a strong U.S. economy, favorable exchange rates, and rising consumer demand. Much of this demand is for high-valued imports like fruits and vegetables, alcoholic beverages and processed foods. Such goods often can’t be easily or economically produced in the United States, such as tropical products or off-season produce. -
U.S. agricultural export values climb to third-highest level in 2024
- by James Kaufman
- 4/1/2025
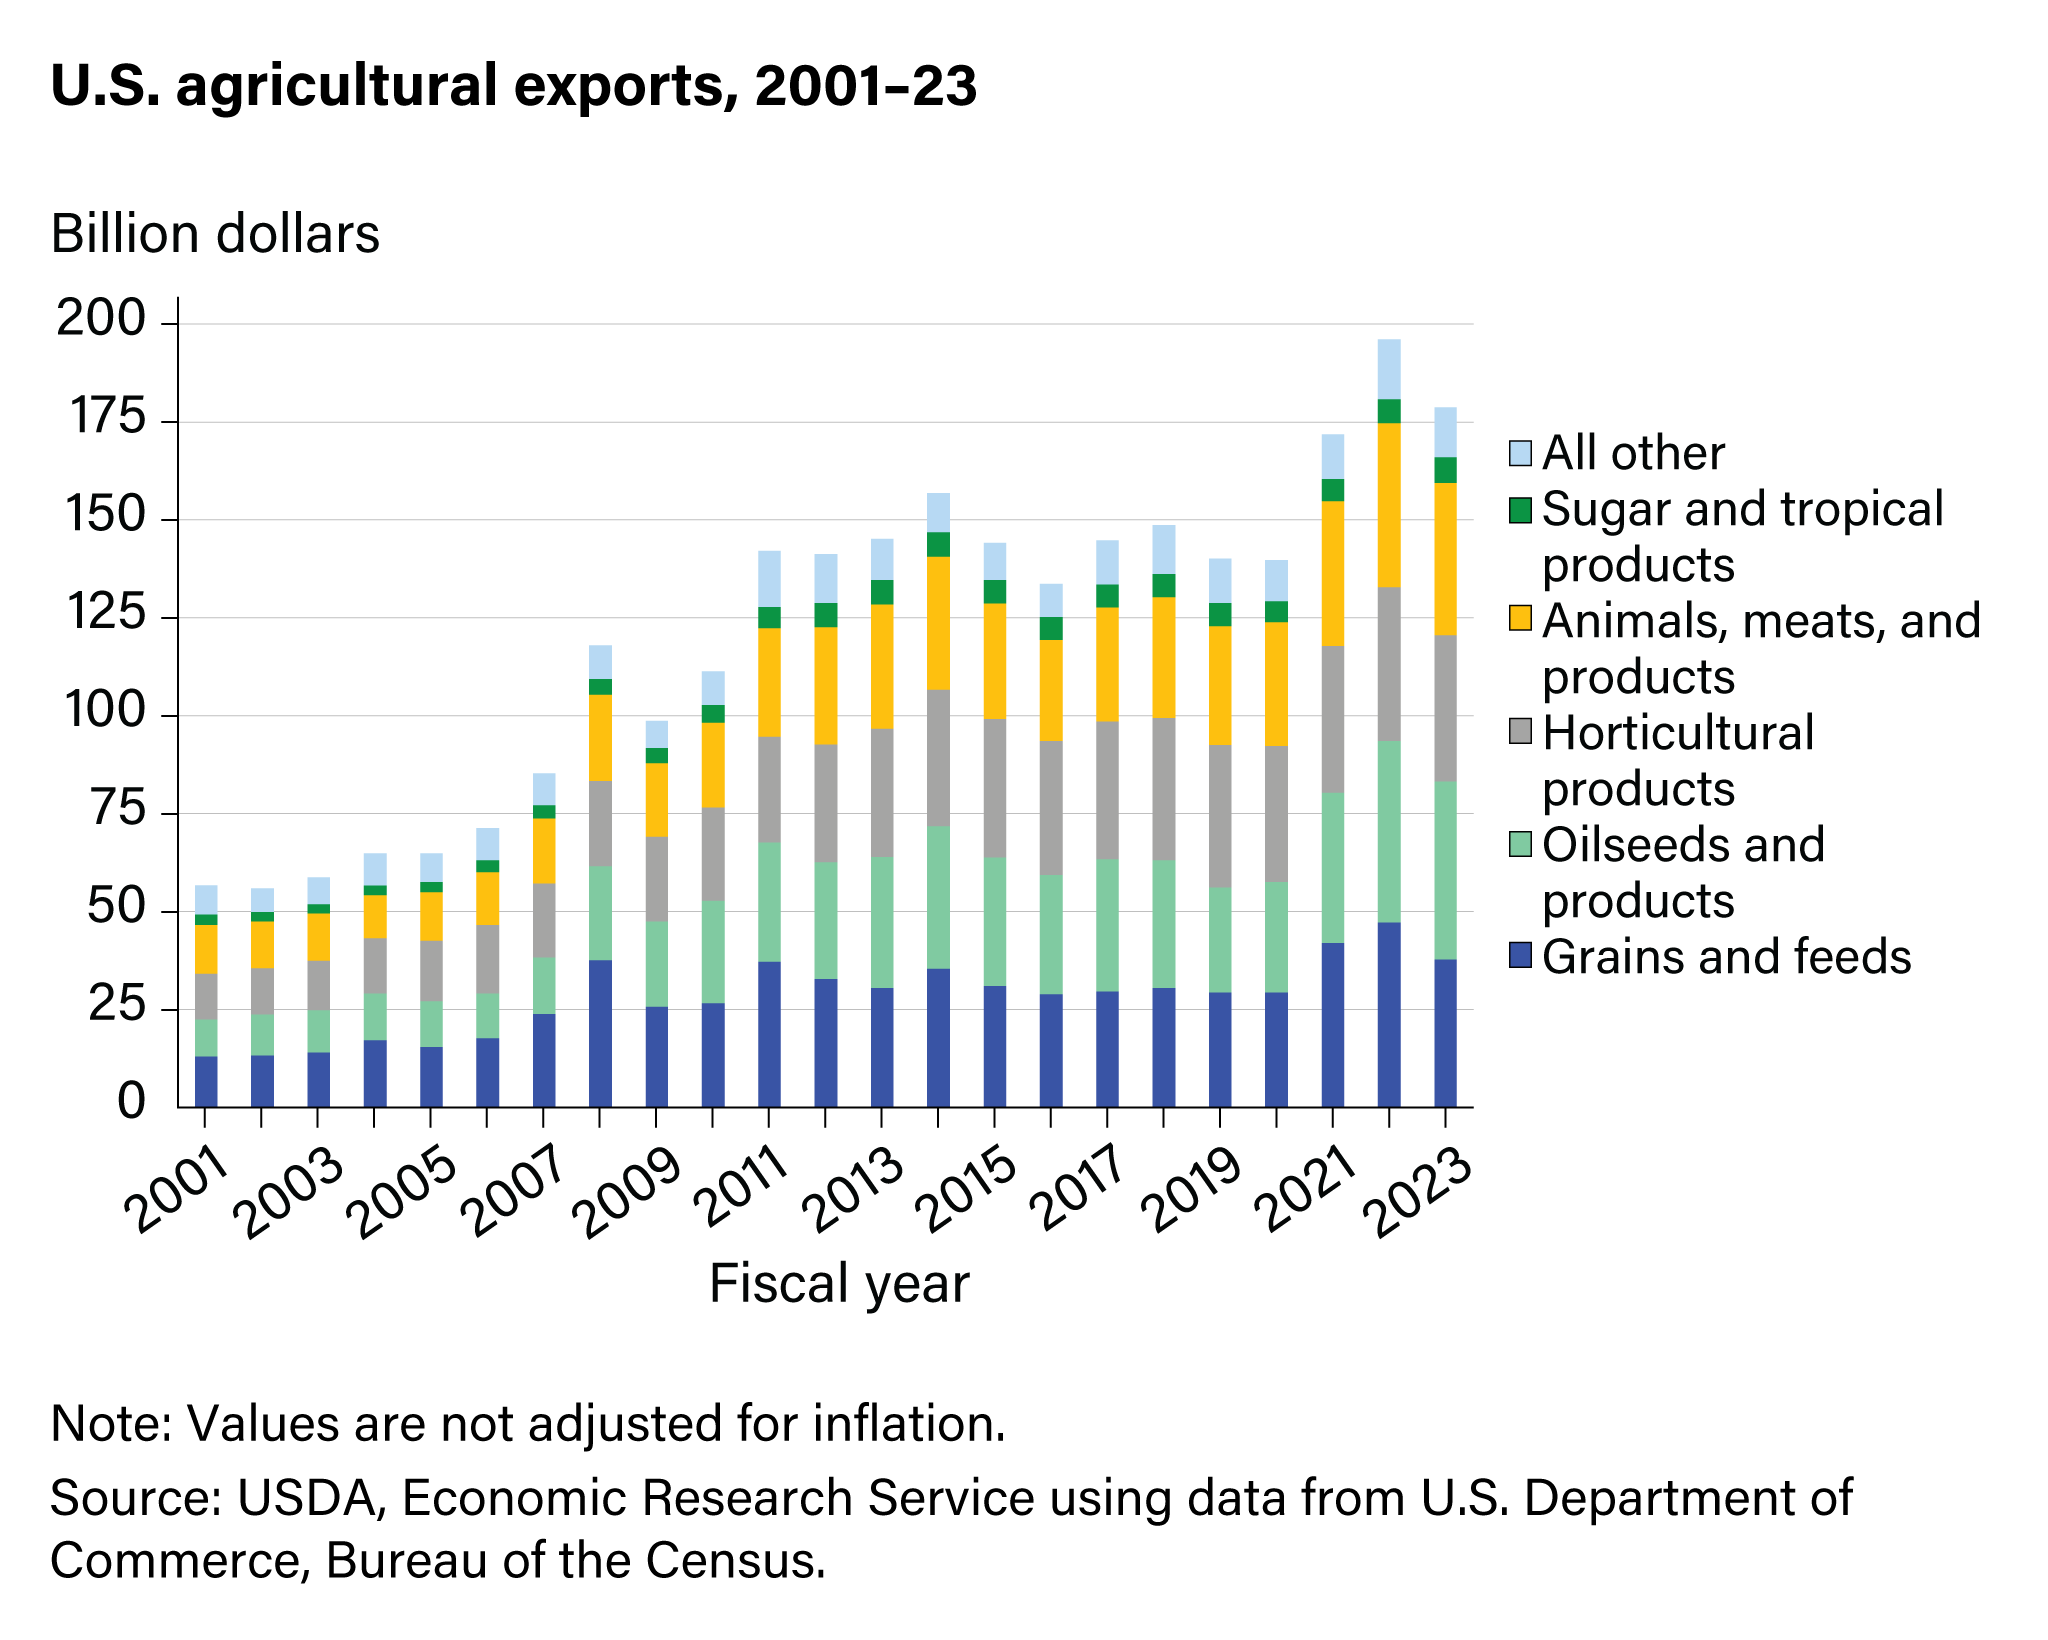
U.S. agricultural export values, not adjusting for inflation, peaked in 2022 before declining in 2023. This decline was due to falling global commodity prices, a strong dollar, and shifting demand for some commodities such as corn and soybeans. In 2024, U.S. agricultural exports increased by $1.8 billion (1 percent) over 2023, reaching the third highest level on record. Four categories typically make up about 90 percent of exports: grains and feeds; oilseeds and products; livestock and animal products; and horticultural products. Within these categories, the top 10 U.S. exports in 2024 were soybeans, corn, beef and beef products, tree nuts, pork and pork products, dairy products, soybean meal, food preparations, wheat, and poultry meat and products. Together, these products comprised 57 percent of U.S. agricultural export value. -
High-value products drive growth in U.S. agricultural imports
- by James Kaufman
- 4/1/2025
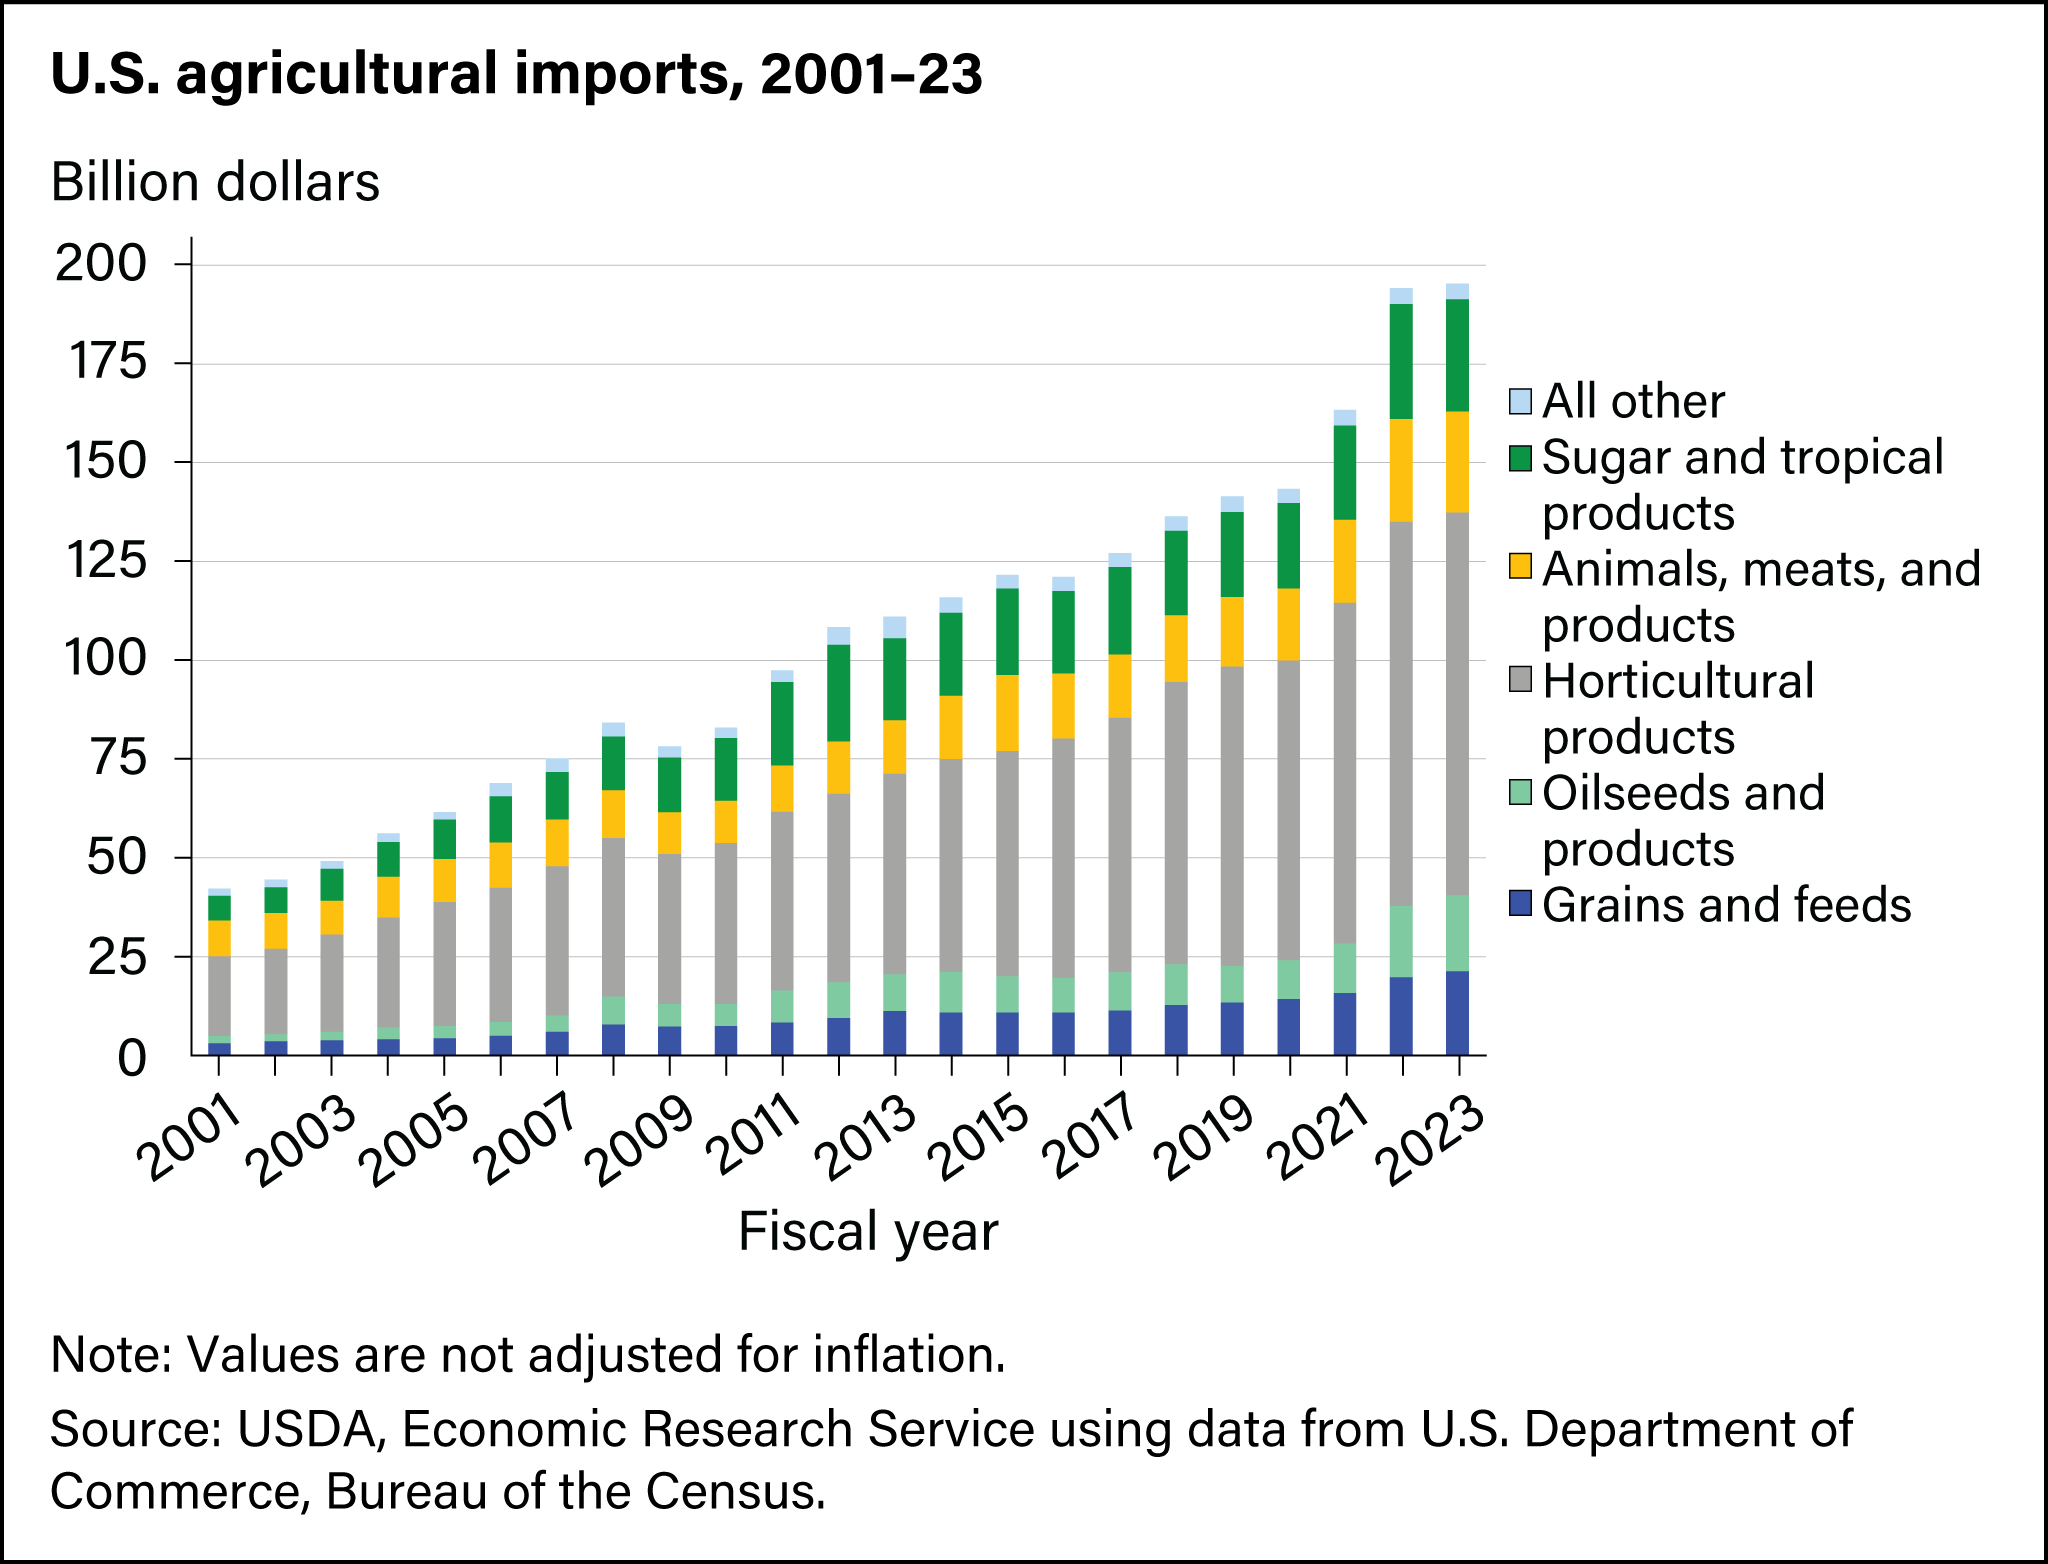
The value of U.S. agricultural imports grew by 6 percent annually from 2014 to 2024, growing to a record $213 billion in 2024. In most years, at least half the growth was in horticultural products—a category including high-value products such as fruits, vegetables, alcoholic beverages, essential oils, tree nuts, and nursery stock. Growth in high-value agricultural imports has been driven by demand for year-round supply, changing consumer preferences, and a strong exchange rate. Beef imports, up 23 percent in 2024, from countries such as Australia and Brazil, helped ease tight domestic supplies. Imports of tropical products (especially cocoa and coffee) rose with global prices, while vegetable oil imports increased to meet U.S. biofuel feedstock demand. -
The top 5 U.S. agricultural trading partners accounted for 61 percent of U.S. agricultural exports in 2024
- by James Kaufman
- 4/1/2025
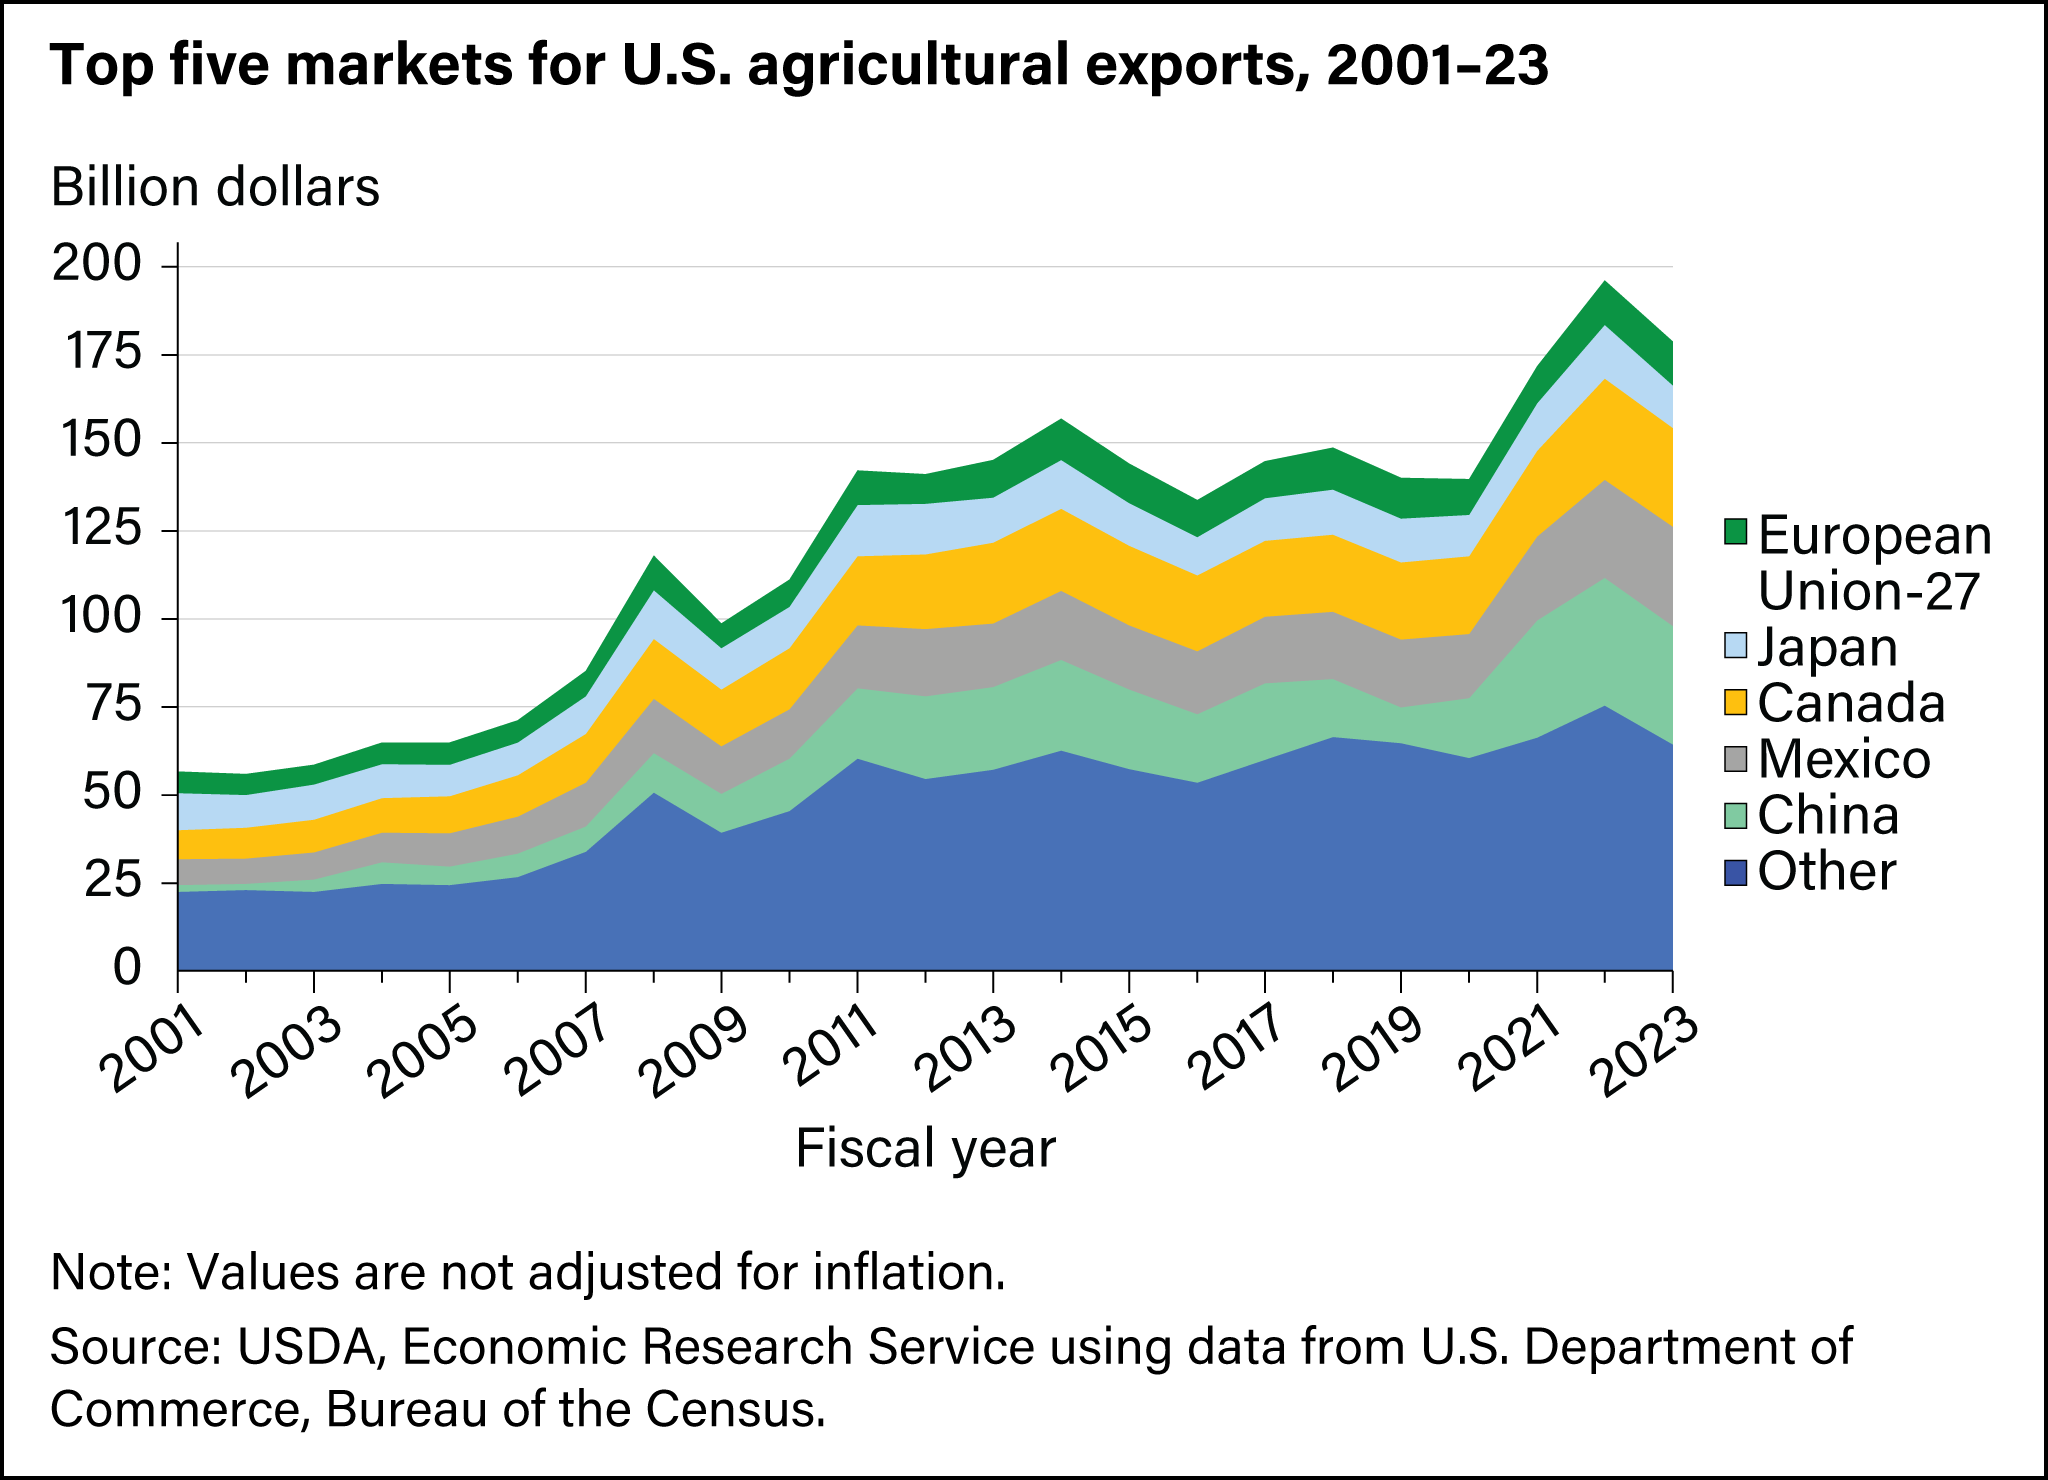
The top 5 U.S. markets accounted for 61 percent of the total value of U.S. agricultural exports in 2024. Mexico surpassed China and Canada in 2024 to become the top market at a record $30.3 billion, a 7-percent increase from 2023. Top U.S. agricultural exports to Mexico included corn, pork, dairy, soybeans, poultry, and beef. Exports to Canada, the second largest export market, were $28.4 billion. Top U.S. agricultural exports included bakery goods, fresh vegetables and fruits, ethanol, non-alcoholic beverages, and food preparations. China fell to third place with U.S. exports valued at $24.7 billion, down 15 percent from 2023, as soybean and corn sales fell amid rising competition from South America. U.S. agricultural exports to the European Union reached a record $12.8 billion in 2024, a 1-percent increase from 2023, led by strong tree nut and record distilled spirit sales. -
Mexico and Canada are the two largest agricultural exporters to the United States, followed by the European Union
- by James Kaufman
- 4/1/2025
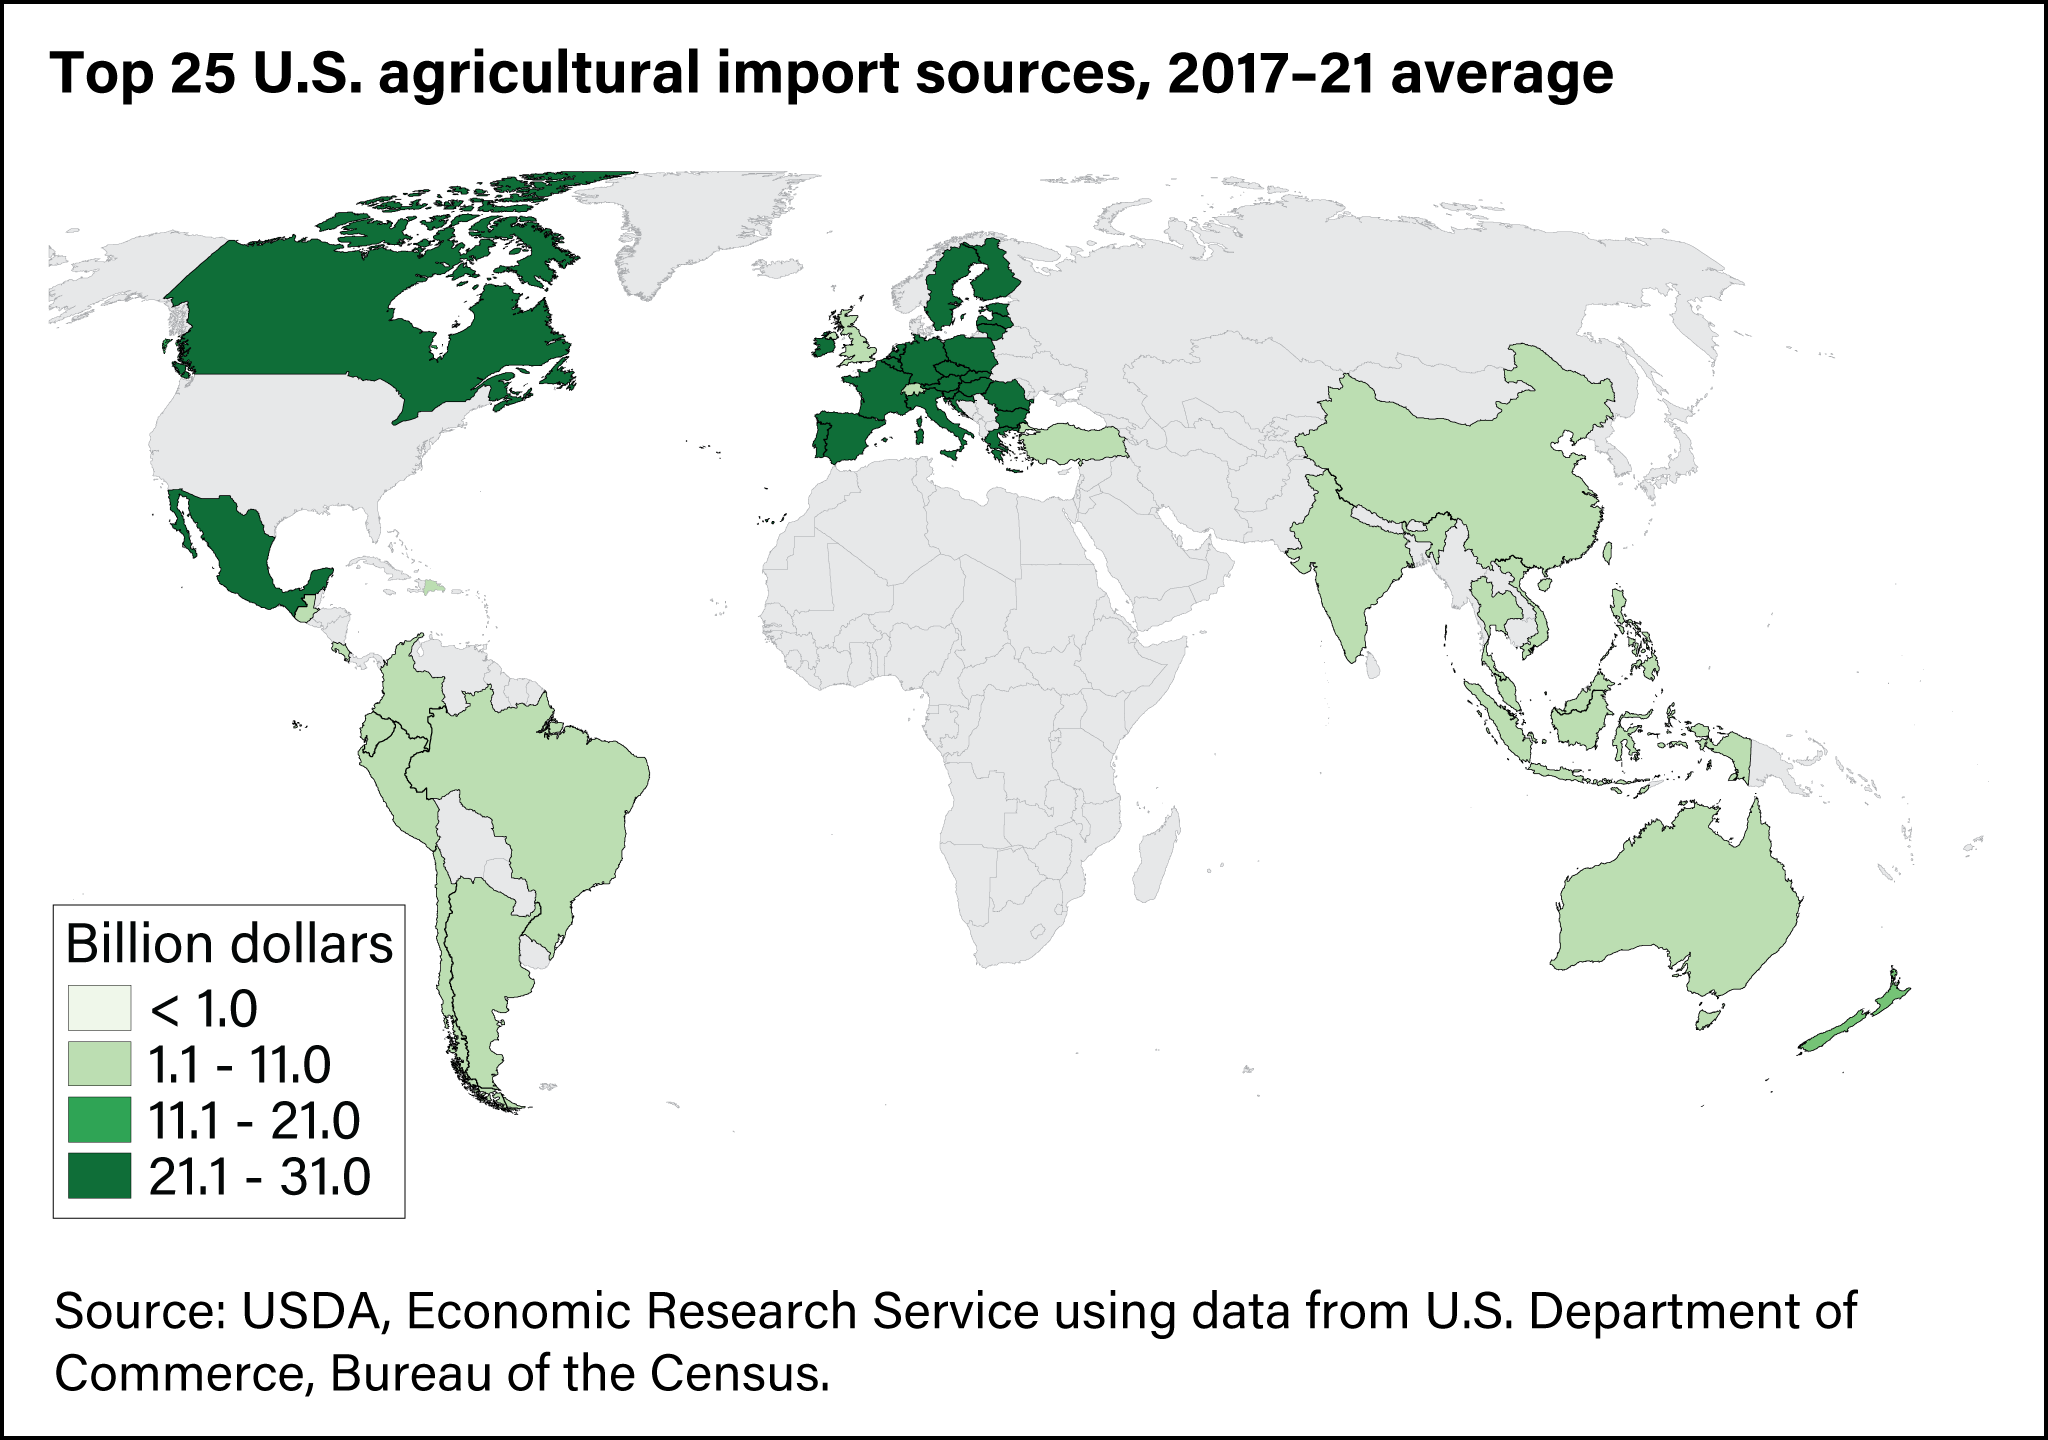
The top three agricultural exporters to the United States are Mexico, Canada, and the European Union, accounting for almost 60 percent of all agricultural sales to the United States between 2020–24. Mexico and Canada are the first and second largest suppliers, averaging $41.6 billion and $35.0 billion annually in 2020–24, respectively. Mexico supplied roughly one third of U.S. horticultural product imports—including fruit, vegetables, and alcoholic beverages. Canada is a large supplier of processed food products (baked goods), meat, vegetable oils and vegetables. The European Union is the third largest source, averaging $32.9 billion in 2020–24—with high-value products such as wine, spirits, and essential oils accounting for most of the value. South America (led by Brazil, Colombia and Peru) averaged $20.5 billion in U.S. agricultural imports from 2020–24—mostly in horticultural, and sugar and tropical products that have comparative or seasonal advantages. -
East Asia and North America remain top regions for U.S. agricultural exports
- by James Kaufman
- 4/1/2025
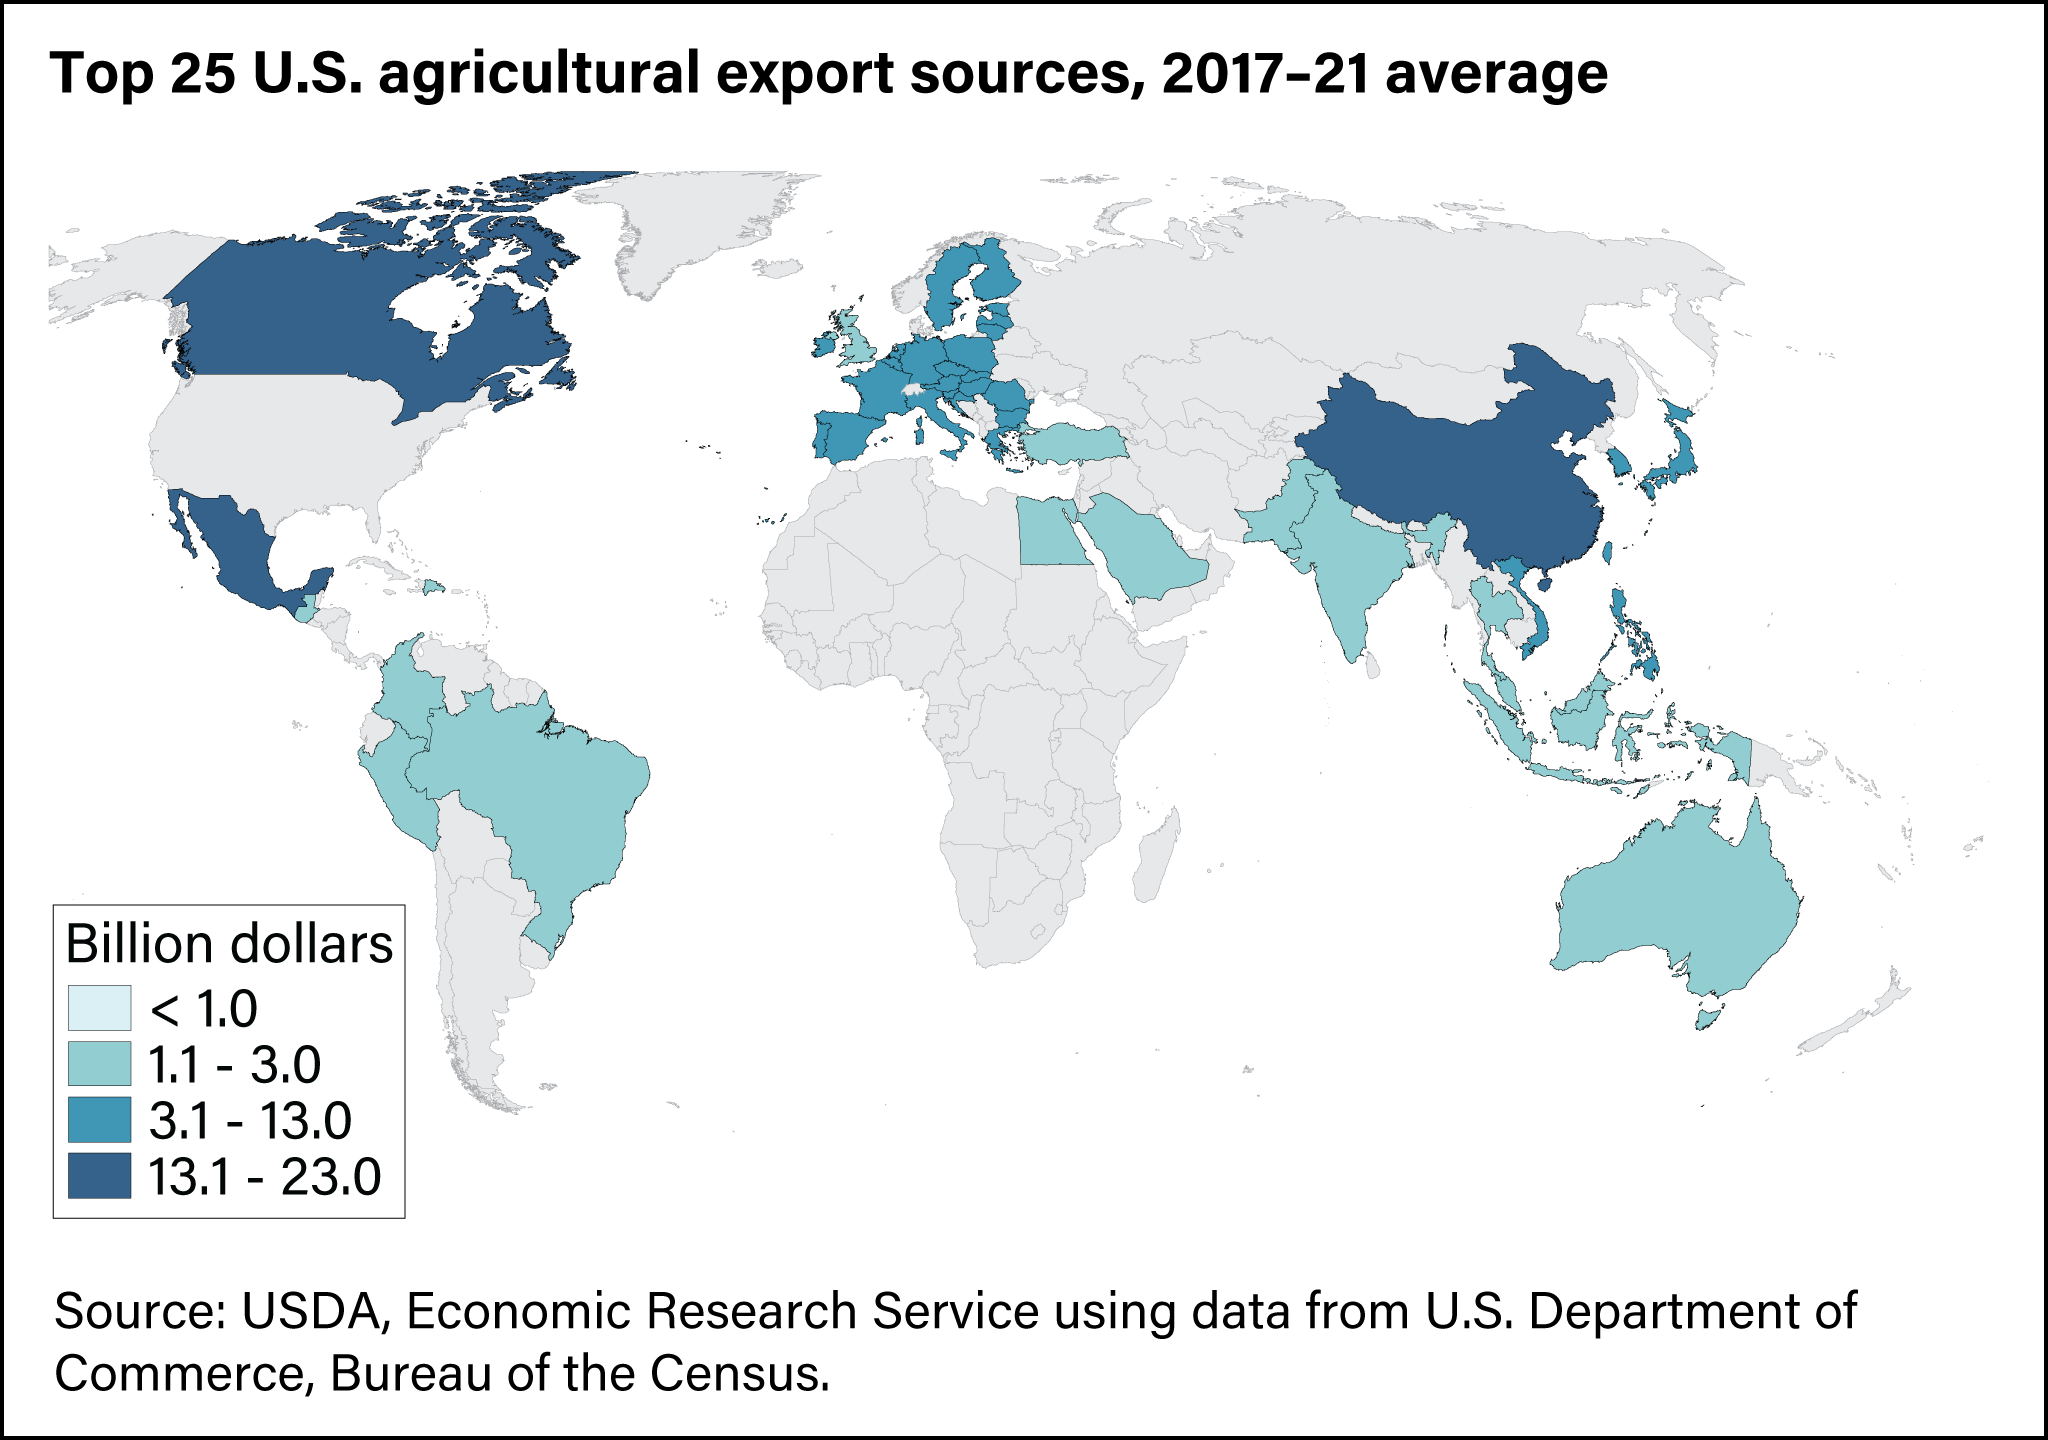
Between 2020–24, 63 percent of U.S. agricultural exports went to markets in East Asia and North America. East Asia (led by China, Japan, and South Korea) was the largest market, with a collective 31 percent share. The top three commodity groups exported to East Asia included oilseeds, grains, and meats. The share of U.S. agricultural exports to Canada and Mexico has been growing to account for 30 percent of world exports in 2020–24. The third largest regional destination is Southeast Asia (led by the Philippines, Vietnam, and Indonesia), followed closely by the European Union. -
Exports expand the market for U.S. agricultural products
- by James Kaufman
- 4/1/2025
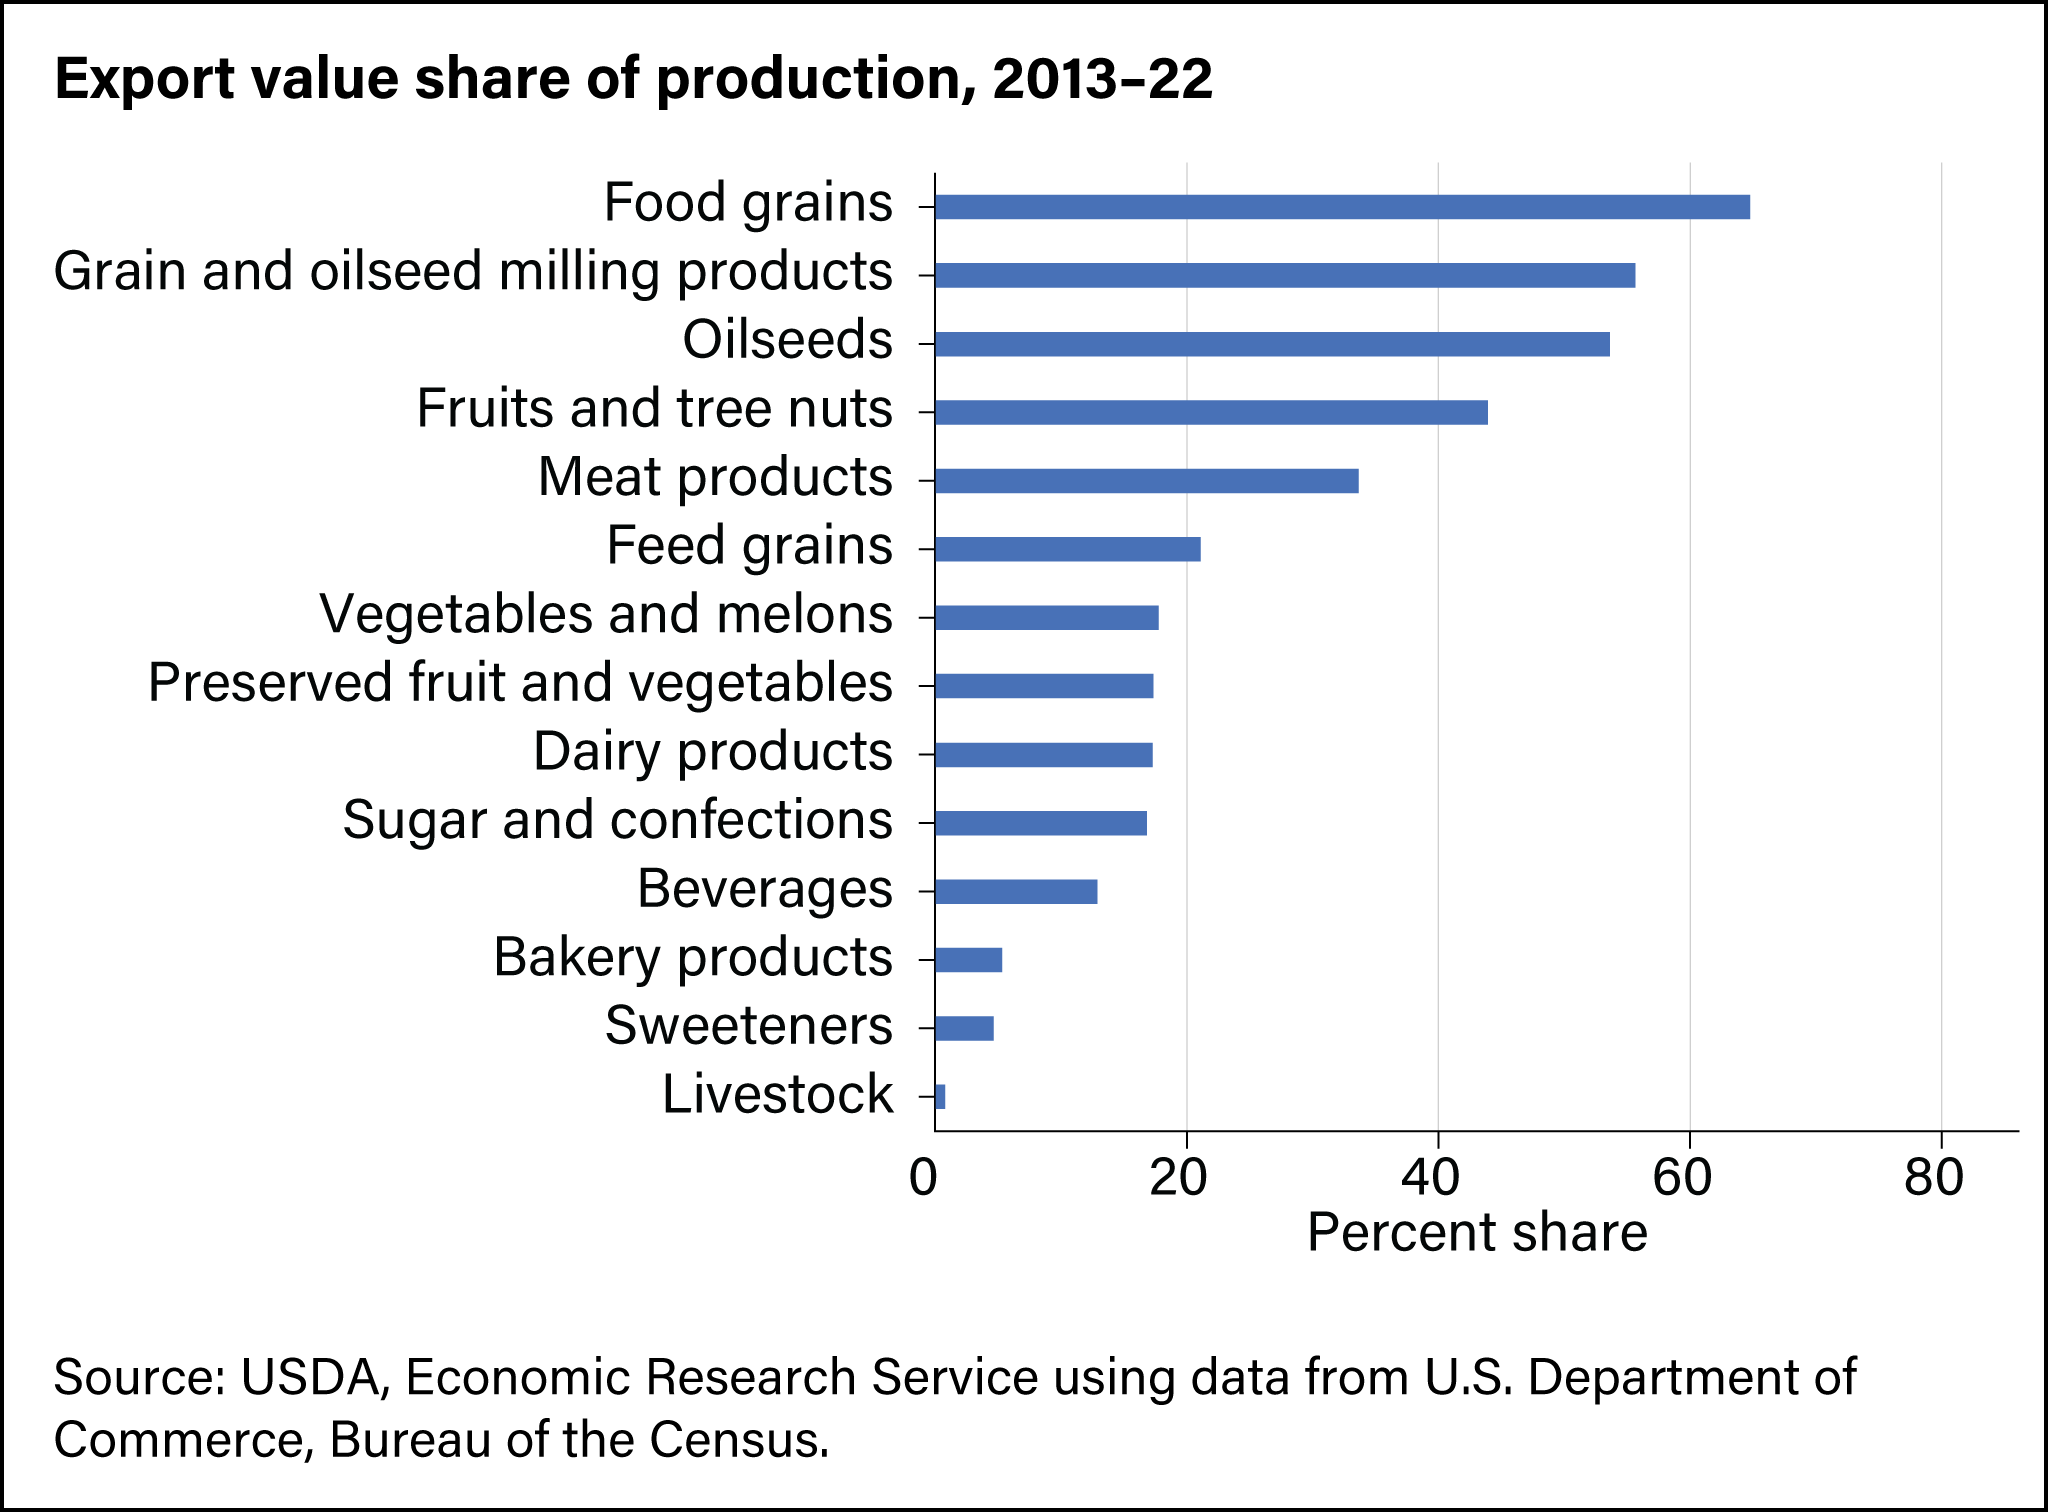
The share of U.S. agricultural and food production sold outside the country indicates the level of these sectors’ dependence on foreign markets. The agricultural commodities with the highest export share (whose export shares account for 40 percent or more of their total market value) include fruits and tree nuts, oilseeds, and food grains such as rice and wheat. The United States tends to export a higher share of non-manufactured products than manufactured products. Non-manufactured products include food grains such as rice and wheat, oilseeds—and tree nuts such as almonds. The United States exports a lower share of manufactured products—such as sweeteners, bakery products, and dairy products. Since 2008, the overall export share of U.S. agricultural production has remained relatively constant, at approximately 20 percent. -
U.S. consumer preference for high-value products is reflected in imports
- by James Kaufman
- 4/1/2025
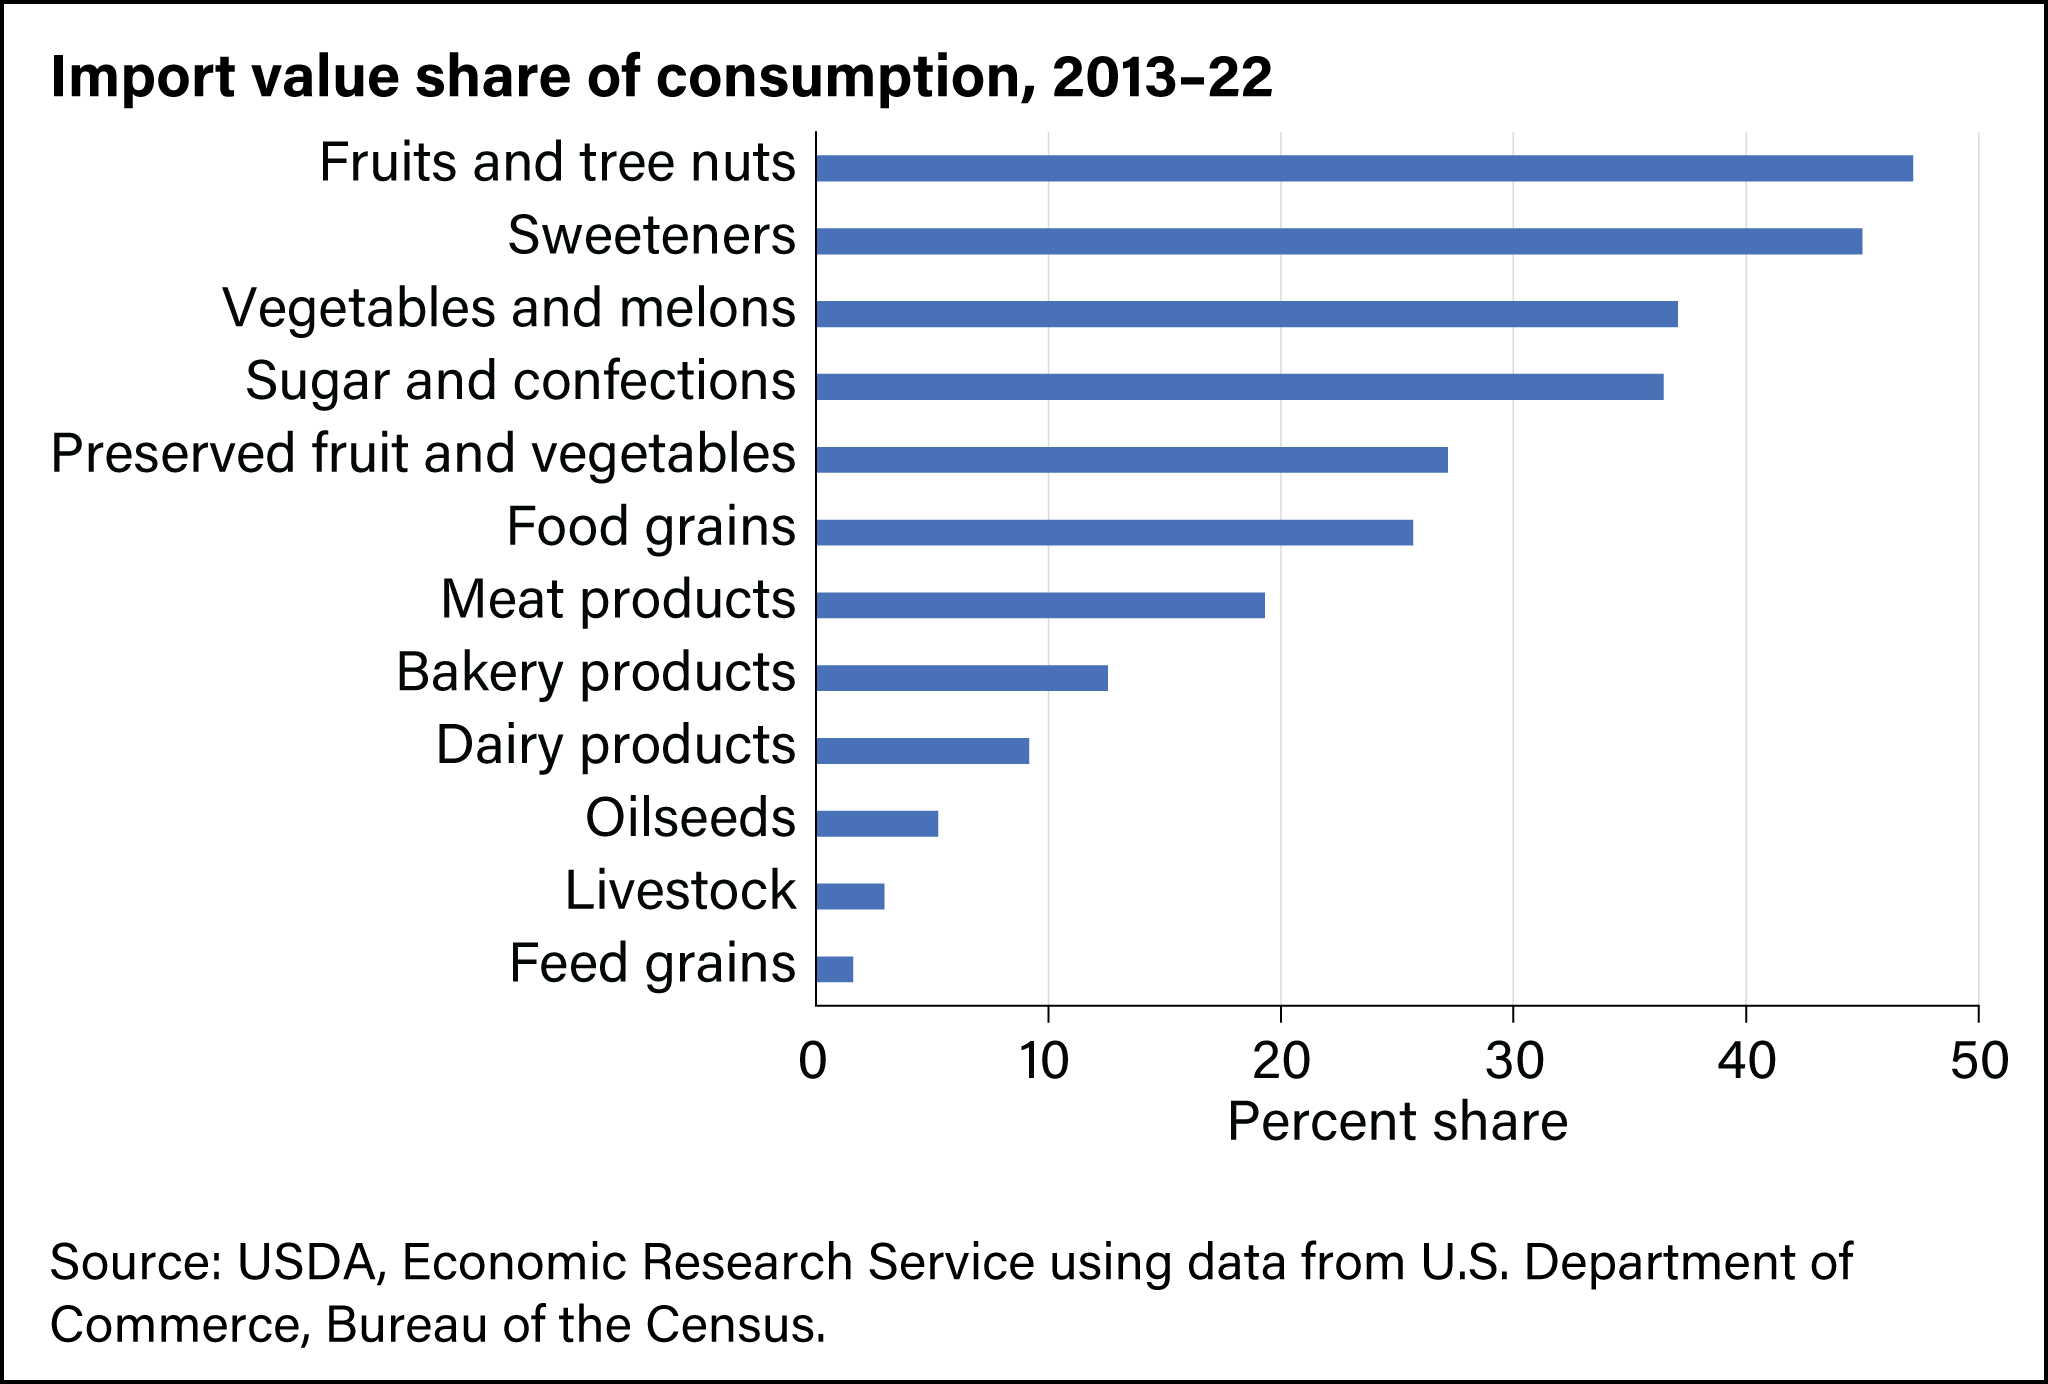
The U.S. share of agricultural consumption sourced from imports tends to be higher for higher-value agricultural product groups. This higher share is due to numerous factors—including the relative competitiveness in production, seasonal availability, consumer preferences, and others. Groups of products where the United States is more reliant on imports include sweeteners, processed sugar, and confections. Fruits, nuts, and vegetables are also frequently imported. The United States tends to have a lower reliance on imports for unprocessed agricultural commodities such as feed grains, livestock, and oilseeds. The total import share of consumption across all food and beverages between 2013 and 2022 was 16 percent, steadily growing over the period.