
U.S. Soybean Production Expands Since 2002 as Farmers Adopt New Practices, Technologies
- by Kate Vaiknoras
- 7/26/2023
Highlights
- U.S. planted soybean acreage increased 18 percent from 2002 to 2022, and in most years had the second-highest planted acreage, behind corn. Yields also increased during this time.
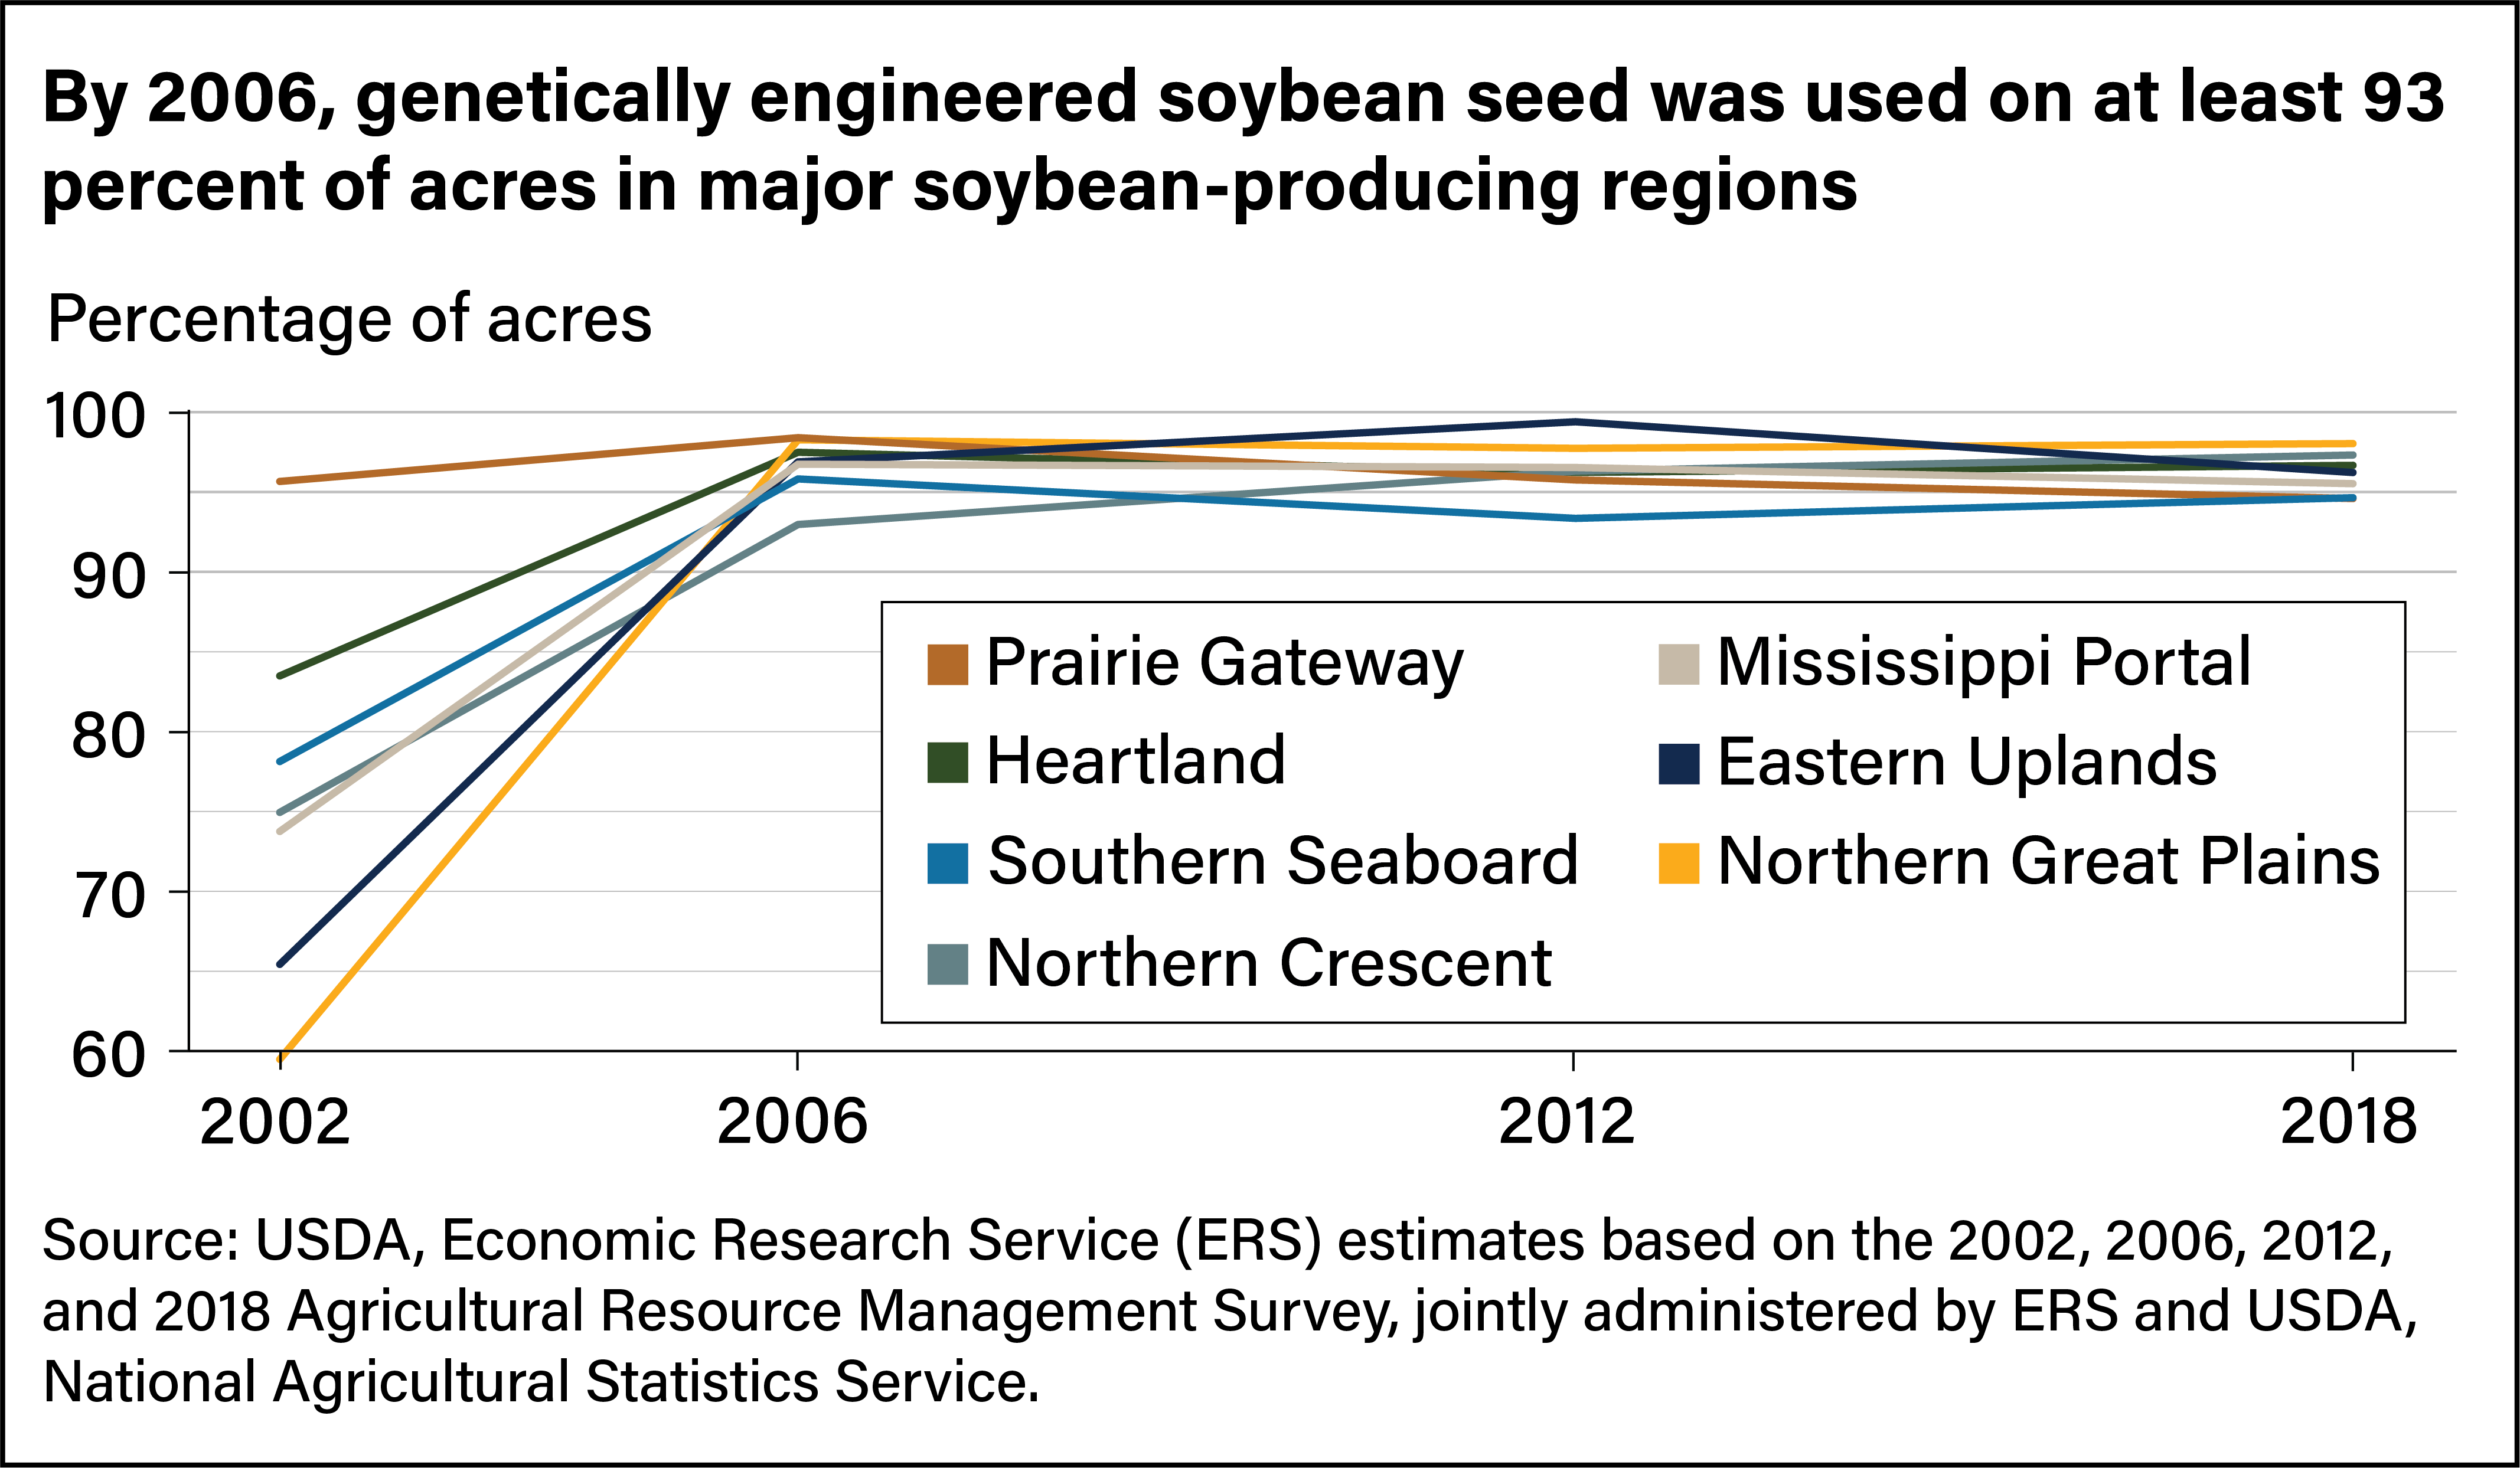
- Genetically engineered seed varieties, first introduced commercially in the mid-1990s, saw rapid adoption among soybean farmers. By 2006, more than 93 percent of soybean acres in major U.S. soybean-growing regions were planted with genetically engineered seed.
- U.S. farmers applied fertilizer, fungicides, and insecticides to a larger share of soybean acres in 2018 than in 2002. Use of precision agriculture technology also increased.
- Per-acre soybean production costs rose from 2002 to 2018. However, because yields also rose, the cost of producing a bushel of soybeans, when adjusted for inflation, fell during that time, indicating an increase in U.S. soybean productivity.
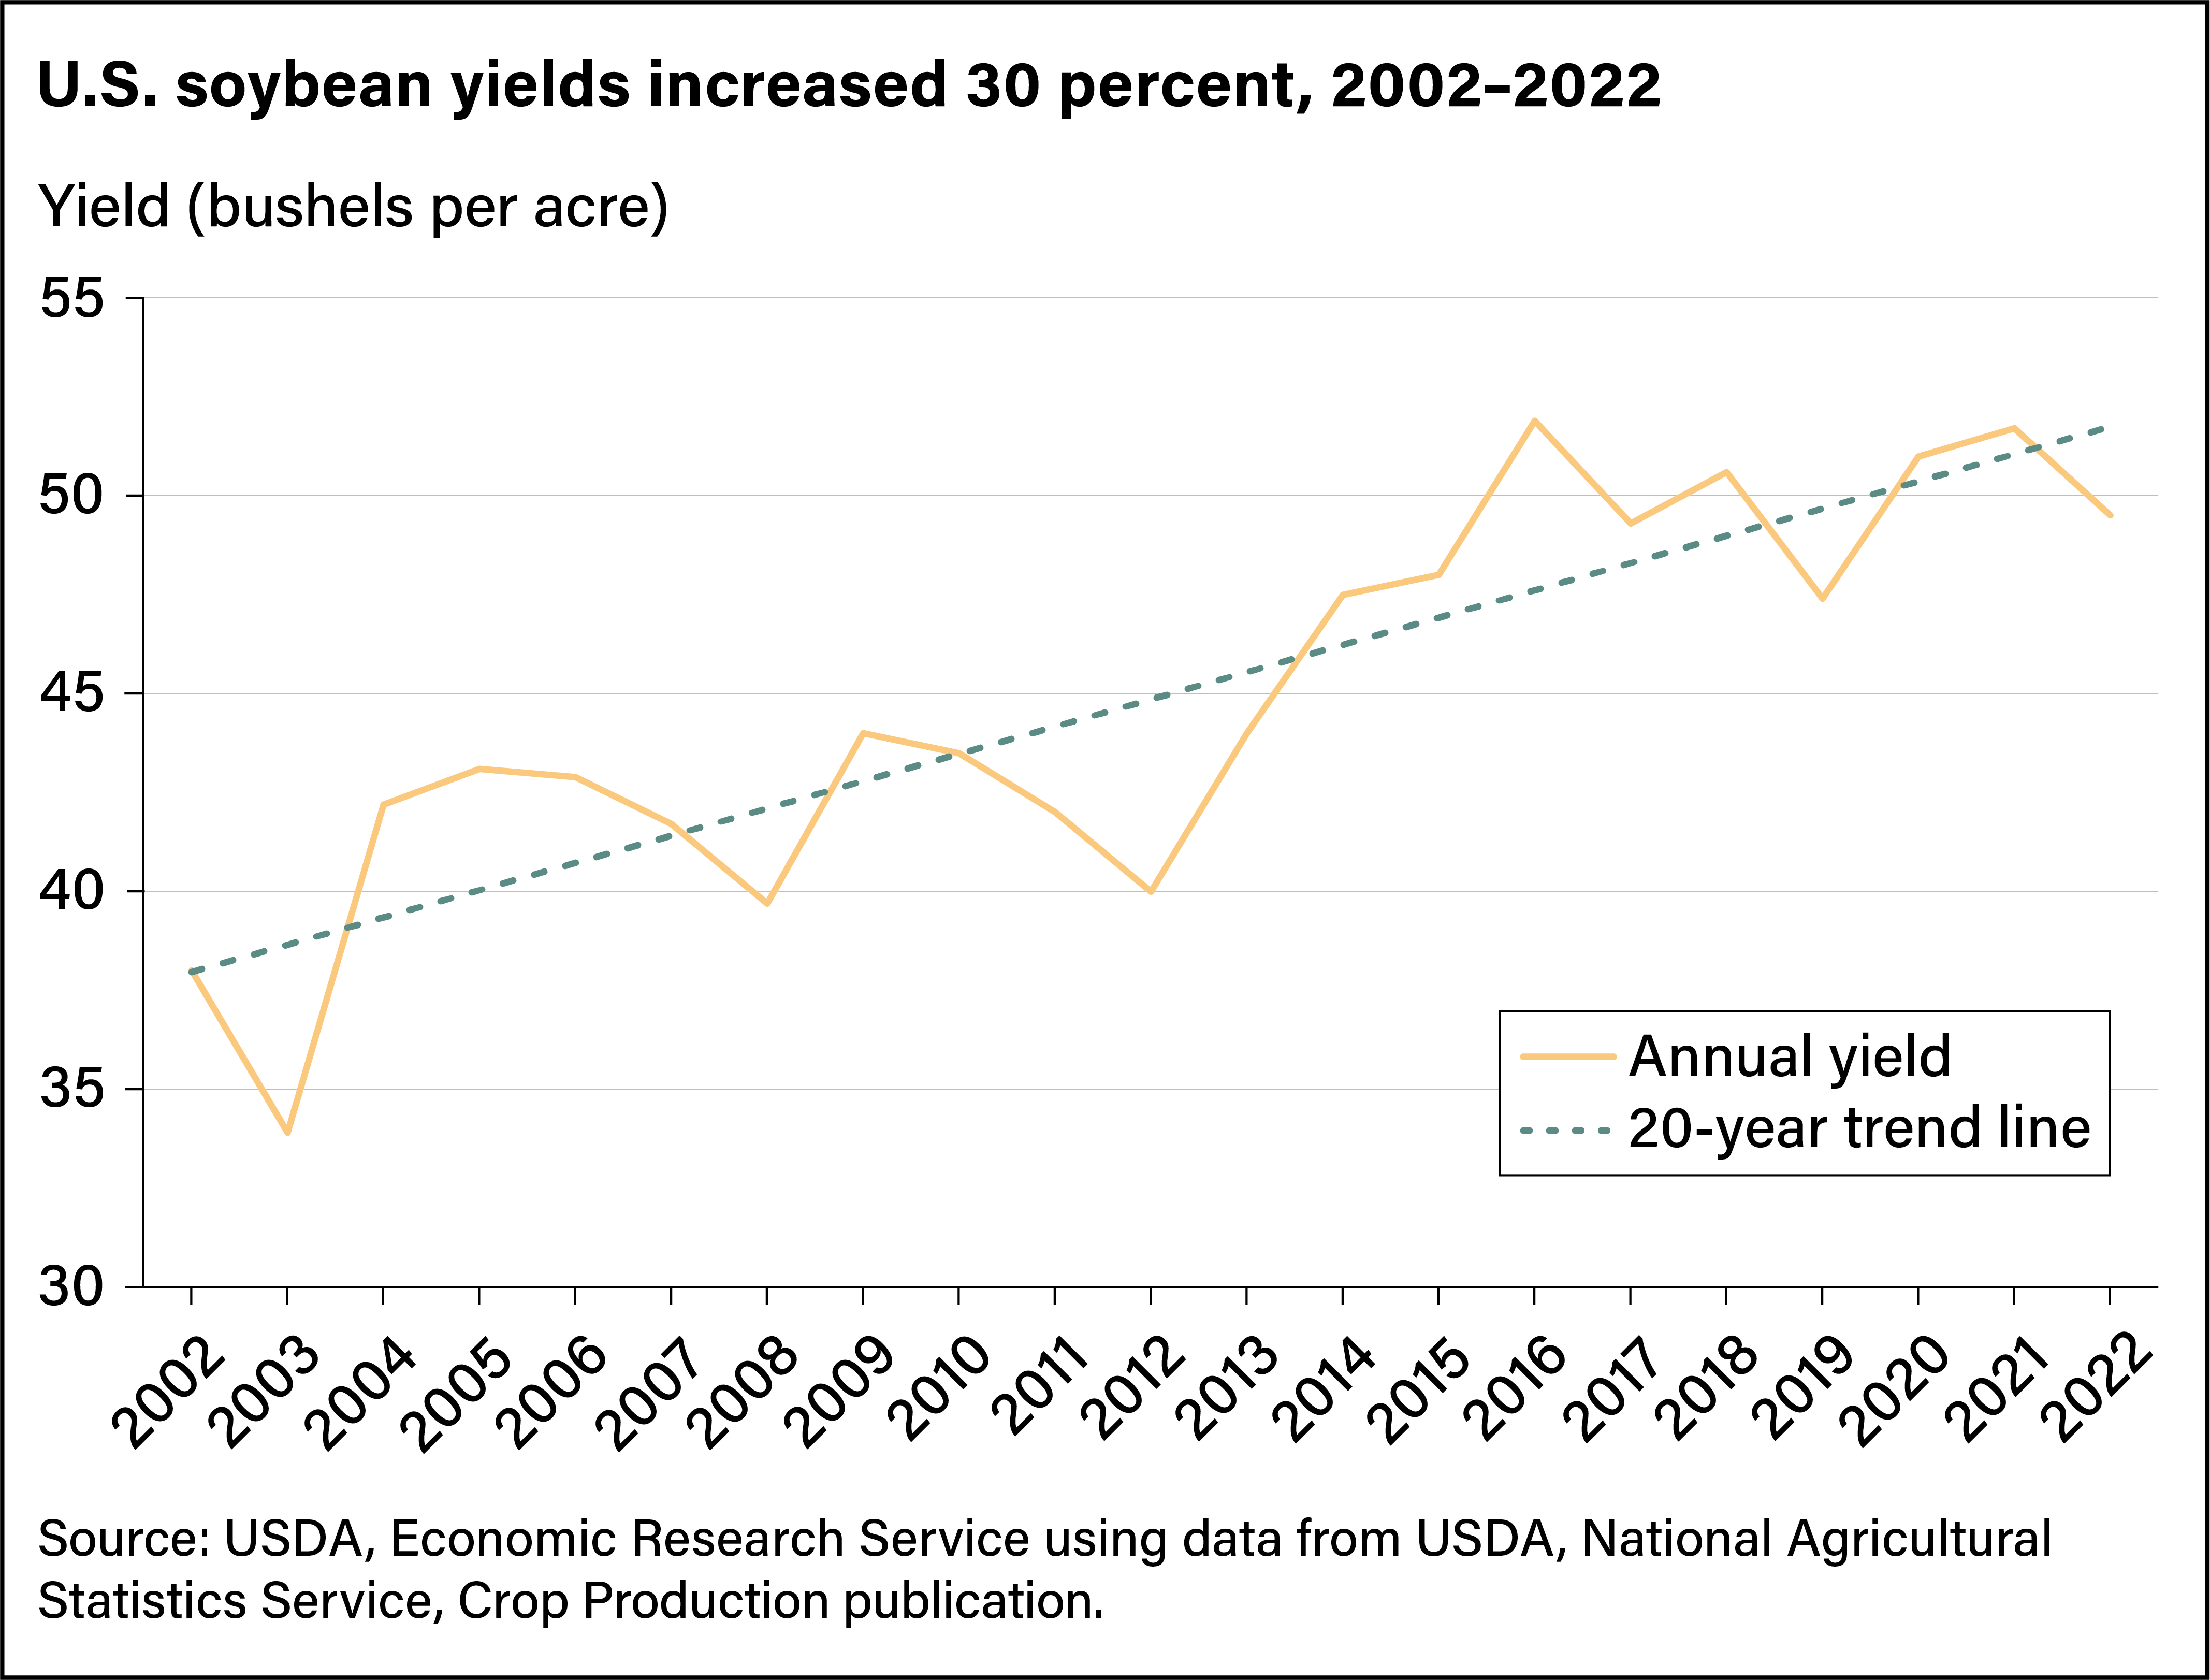
U.S. soybean production accounted for more than 30 percent of the world supply in recent years. In most years, U.S. soybeans—a key source of livestock feed and an export crop—come in second in planted acreage behind corn. Since 2002, U.S. acreage planted to soybeans has increased 18 percent, growing at an average rate of about 1 percent a year. As production practices have changed, soybean yields have increased 30 percent.
A USDA, Economic Research Service (ERS) report published in June 2023 set out to identify and examine the drivers of those changes. Using nationally representative data from the 2002, 2006, 2012, and 2018 Agricultural Resource Management Surveys (ARMS) produced by ERS and USDA’s National Agricultural Statistics Service (NASS), researchers tracked changes in soybean production practices over time. They also examined trends in national acreage, yield, and production costs using ERS’ Commodity Costs and Returns, and NASS’ Census of Agriculture, along with other sources. The report found soybean farmers have increased the use of fertilizer, fungicides, insecticides, and precision agriculture technology over time. In addition, researchers found genetically engineered seed was planted on almost all soybean farms from at least 2006 onward. These changing practices have contributed to an increase in per-acre production costs. However, they have also contributed to increased yield, which offsets the higher expenses, leading to expanded productivity.
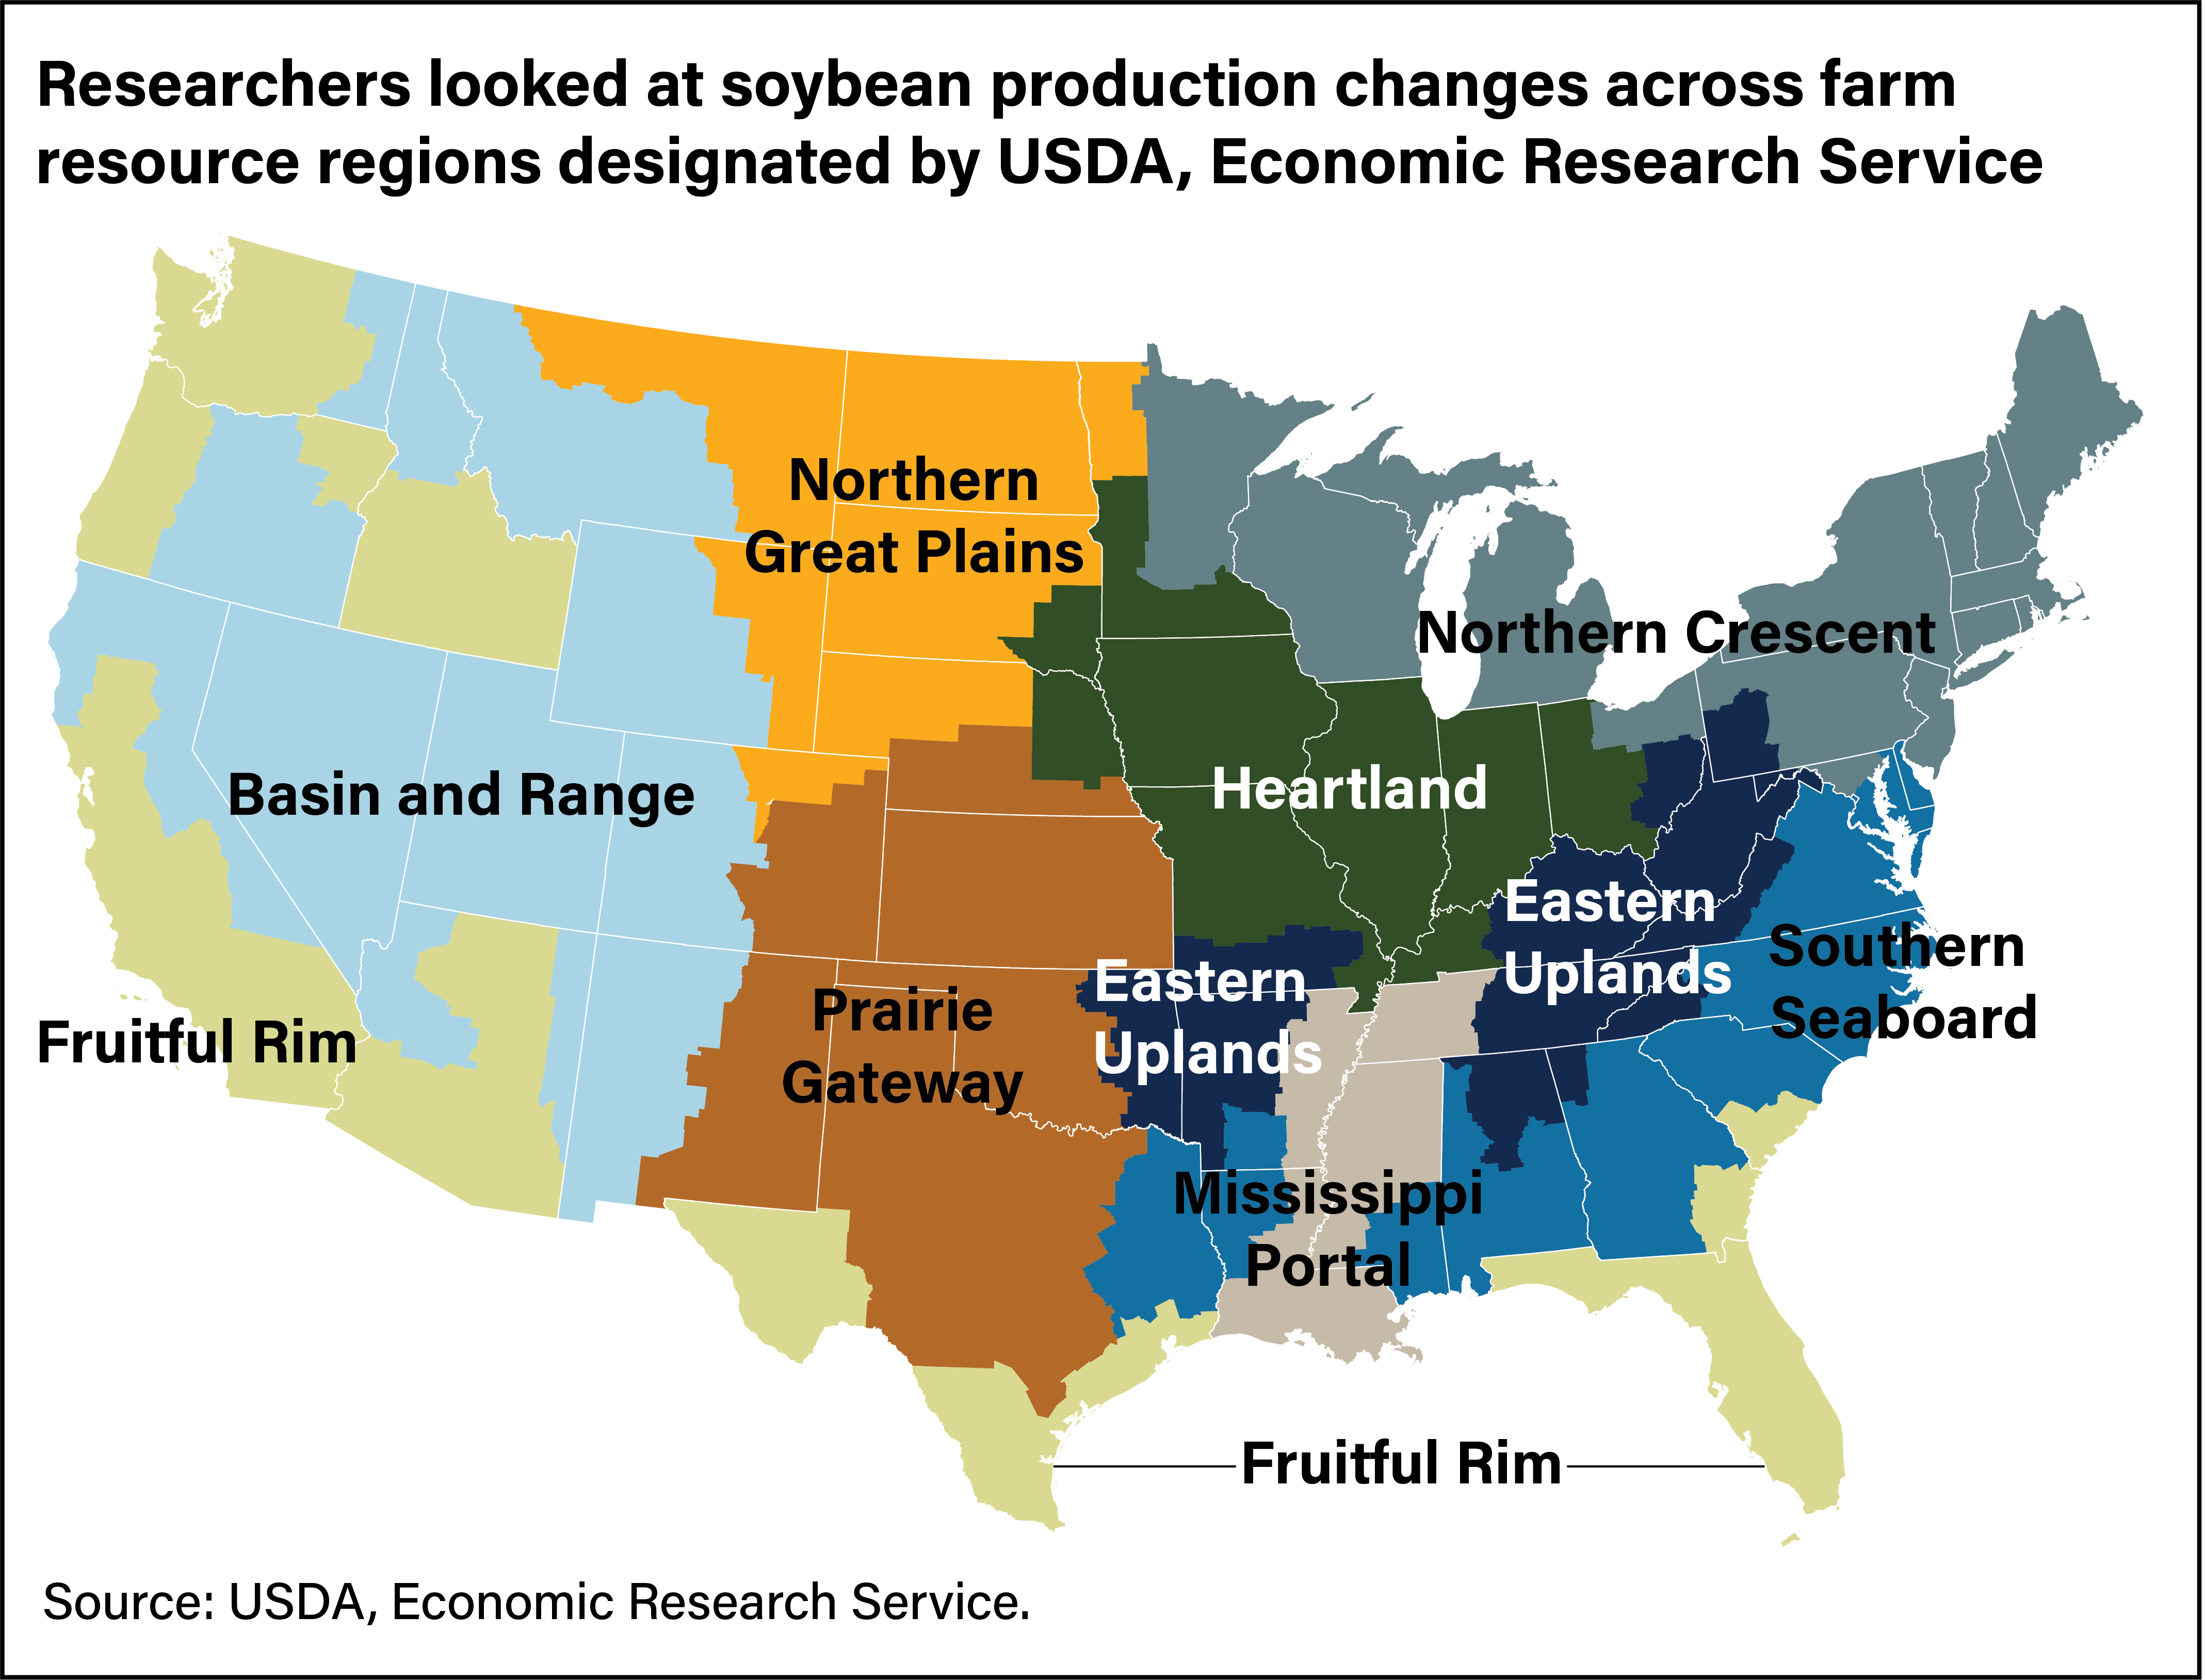
Researchers examined trends in the seven Farm Resource Regions that produce the most soybeans in the United States. ERS defines these regions as the Eastern Uplands, Heartland, Mississippi Portal, Northern Crescent, Northern Great Plains, Prairie Gateway, and Southern Seaboard regions (see map below). The Heartland region is the biggest producer of U.S. soybeans with 52 percent of soybean acres in 2018. The Northern Crescent region was next with 14 percent of acres. The remaining regions had between 4 and 9 percent of U.S. soybean acres in 2018.
Soybean Acreage, Yields Trend Upward
The amount of U.S. acreage planted to soybeans grew 18 percent in the last two decades, from 74 million acres in 2002 to 87 million acres in 2022. In all but 1 year during that time, corn was the only crop with higher planted acreage. Notably, soybean acreage grew at a faster rate than area planted to corn, which increased 12 percent in those 20 years. By contrast, planted acres of wheat, the third-most planted U.S. crop, declined 22 percent. Some wheat acreage was planted to soybeans or other crops. For example, the Northern Great Plains region, a major wheat-producing region, saw a large increase in soybean acreage.
With the expansion of soybean acreage, yields were also on the rise. Changes in production practices such as adoption of genetically engineered seed and the growing use of precision agriculture technologies, along with increased application of fertilizer and pesticides, combined to support yield gains. Between 2002 and 2022, U.S. soybean yields rose from an average of 38 bushels an acre to more than 50 bushels an acre.

Weed Control Challenges Drive Adoption of New Seed Varieties
Genetically engineered seed varieties for major crops like corn and soybeans became commercially available in the United States in the mid-1990s. Most genetically engineered soybeans are herbicide-tolerant, meaning the soybeans have traits to create a tolerance for certain herbicides such as glyphosate, dicamba, and glufosinate. When this technology was first introduced, adoption was uneven across U.S. soybean-producing regions. In 2002, 81 percent of U.S. soybean acres were planted with genetically engineered seed, with regional adoption rates ranging from 60 to 96 percent. By 2006, this regional variation had decreased, and adoption of genetically engineered seed was nearly universal. ARMS data from 2006, 2012, and 2018 showed that at least 93 percent of acres in every major U.S. soybean-producing region were planted with genetically engineered seed.
According to 2018 ARMS data, the most common type of genetically engineered soybean seed varieties instill tolerance for the widely used herbicide glyphosate. With this seed, farmers can apply glyphosate to kill broadleaf weeds and grasses without harming the soybean plant. However, some weed species have developed a resistance to glyphosate, leading to the use of other herbicides, such as dicamba, in soybean fields. That, in turn, has led to the development of seed types resistant to these herbicides. Dicamba-tolerant soybean seeds became commercially available in 2016, and adoption has been rapid. In 2018, 43 percent of U.S. soybean acres were planted with dicamba-tolerant seed, even though not all were treated with dicamba.
Soybean Farmers Increase Use of Insecticides, Fungicides, Fertilizer, and Precision Agriculture
ARMS surveys have shown that since at least 2002, farmers have applied herbicides to nearly all U.S. soybean acres. In addition, farmers increased the use of other inputs, such as foliar (for leaves) insecticides and fungicides. In 2002, fungicides were applied to just 1 percent of soybean acres. By 2018, 15 percent of soybean acres were sprayed with insecticides and 14 percent with fungicides. The 2004 discovery in the United States of soybean rust, a disease that can reduce yield if untreated, led to an increased use of fungicide. Use of insecticides and fungicides varies by region based, in part, on agronomic need. Farmers in southern U.S. regions, specifically the Mississippi Portal and Southern Seaboard, apply these treatments to higher shares of acres than those in other regions. These Southern regions have longer soybean planting periods than the Northern parts of the country, and the warm, wet Southern climate can be conducive to disease.
The percentages of soybean acres receiving fertilizer in the form of nitrogen, phosphorous, and potassium increased from 2002 to 2018. By 2018, potassium was applied to 42 percent of soybean acres, followed by phosphorous (41 percent) and nitrogen (29 percent). As legumes, soybeans benefit from bacteria that live in nodules on the roots of the soybean plant. These bacteria produce nitrogen that is then absorbed by the soybean plant. As a result, farmers typically apply less nitrogen to soybeans than other crops such as corn, although nitrogen is a common ingredient in phosphorous fertilizers.
Soybean farmers also use many types of precision agriculture technology. Examples include yield monitors and yield maps, which identify high- and low-yielding parts of fields. With this technology, farmers can adjust management decisions such as chemical application levels according to need. Increasingly, combines and tractors are guided by Global Positioning Systems (GPS), enabling auto-steering. That improves the precision with which sprays are applied and helps align the seeding of field crop rows. Variable-rate technology allows farmers to change the rate of input applications within a field based on geolocation data from yield or soil maps. Despite generally higher upfront costs, precision agriculture technology was used on a higher share of acres in 2018 than in 2002.
Production Costs Per Acre Have Increased; Profitability Has Fluctuated
Production costs for soybeans include:
- Operating expenses such as seed, fertilizer, chemicals, fuel, and repair costs, and
- Allocated overhead expenses such as land, machinery depreciation, and farm taxes.
Between 2002 and 2018, the national per acre average for soybean production costs rose 114 percent, from $232 to $496, with increases in almost all individual categories. Operating costs increased as a share of total costs, while the share for allocated overhead costs shrank. Fertilizer costs accounted for 3 percent of total costs in 2002 and 9 percent in 2012, decreasing to 6 percent in 2018. Capital recovery for machinery and equipment, as well as chemicals, repairs, and seed accounted for increasing portions of the cost to produce soybeans over time. While the use of fertilizer, chemicals, seed, and machinery increased, their prices also increased between 2002 and 2018. The price of fertilizer was particularly high in 2012, causing that input to contribute to an unusually large share of costs that year.
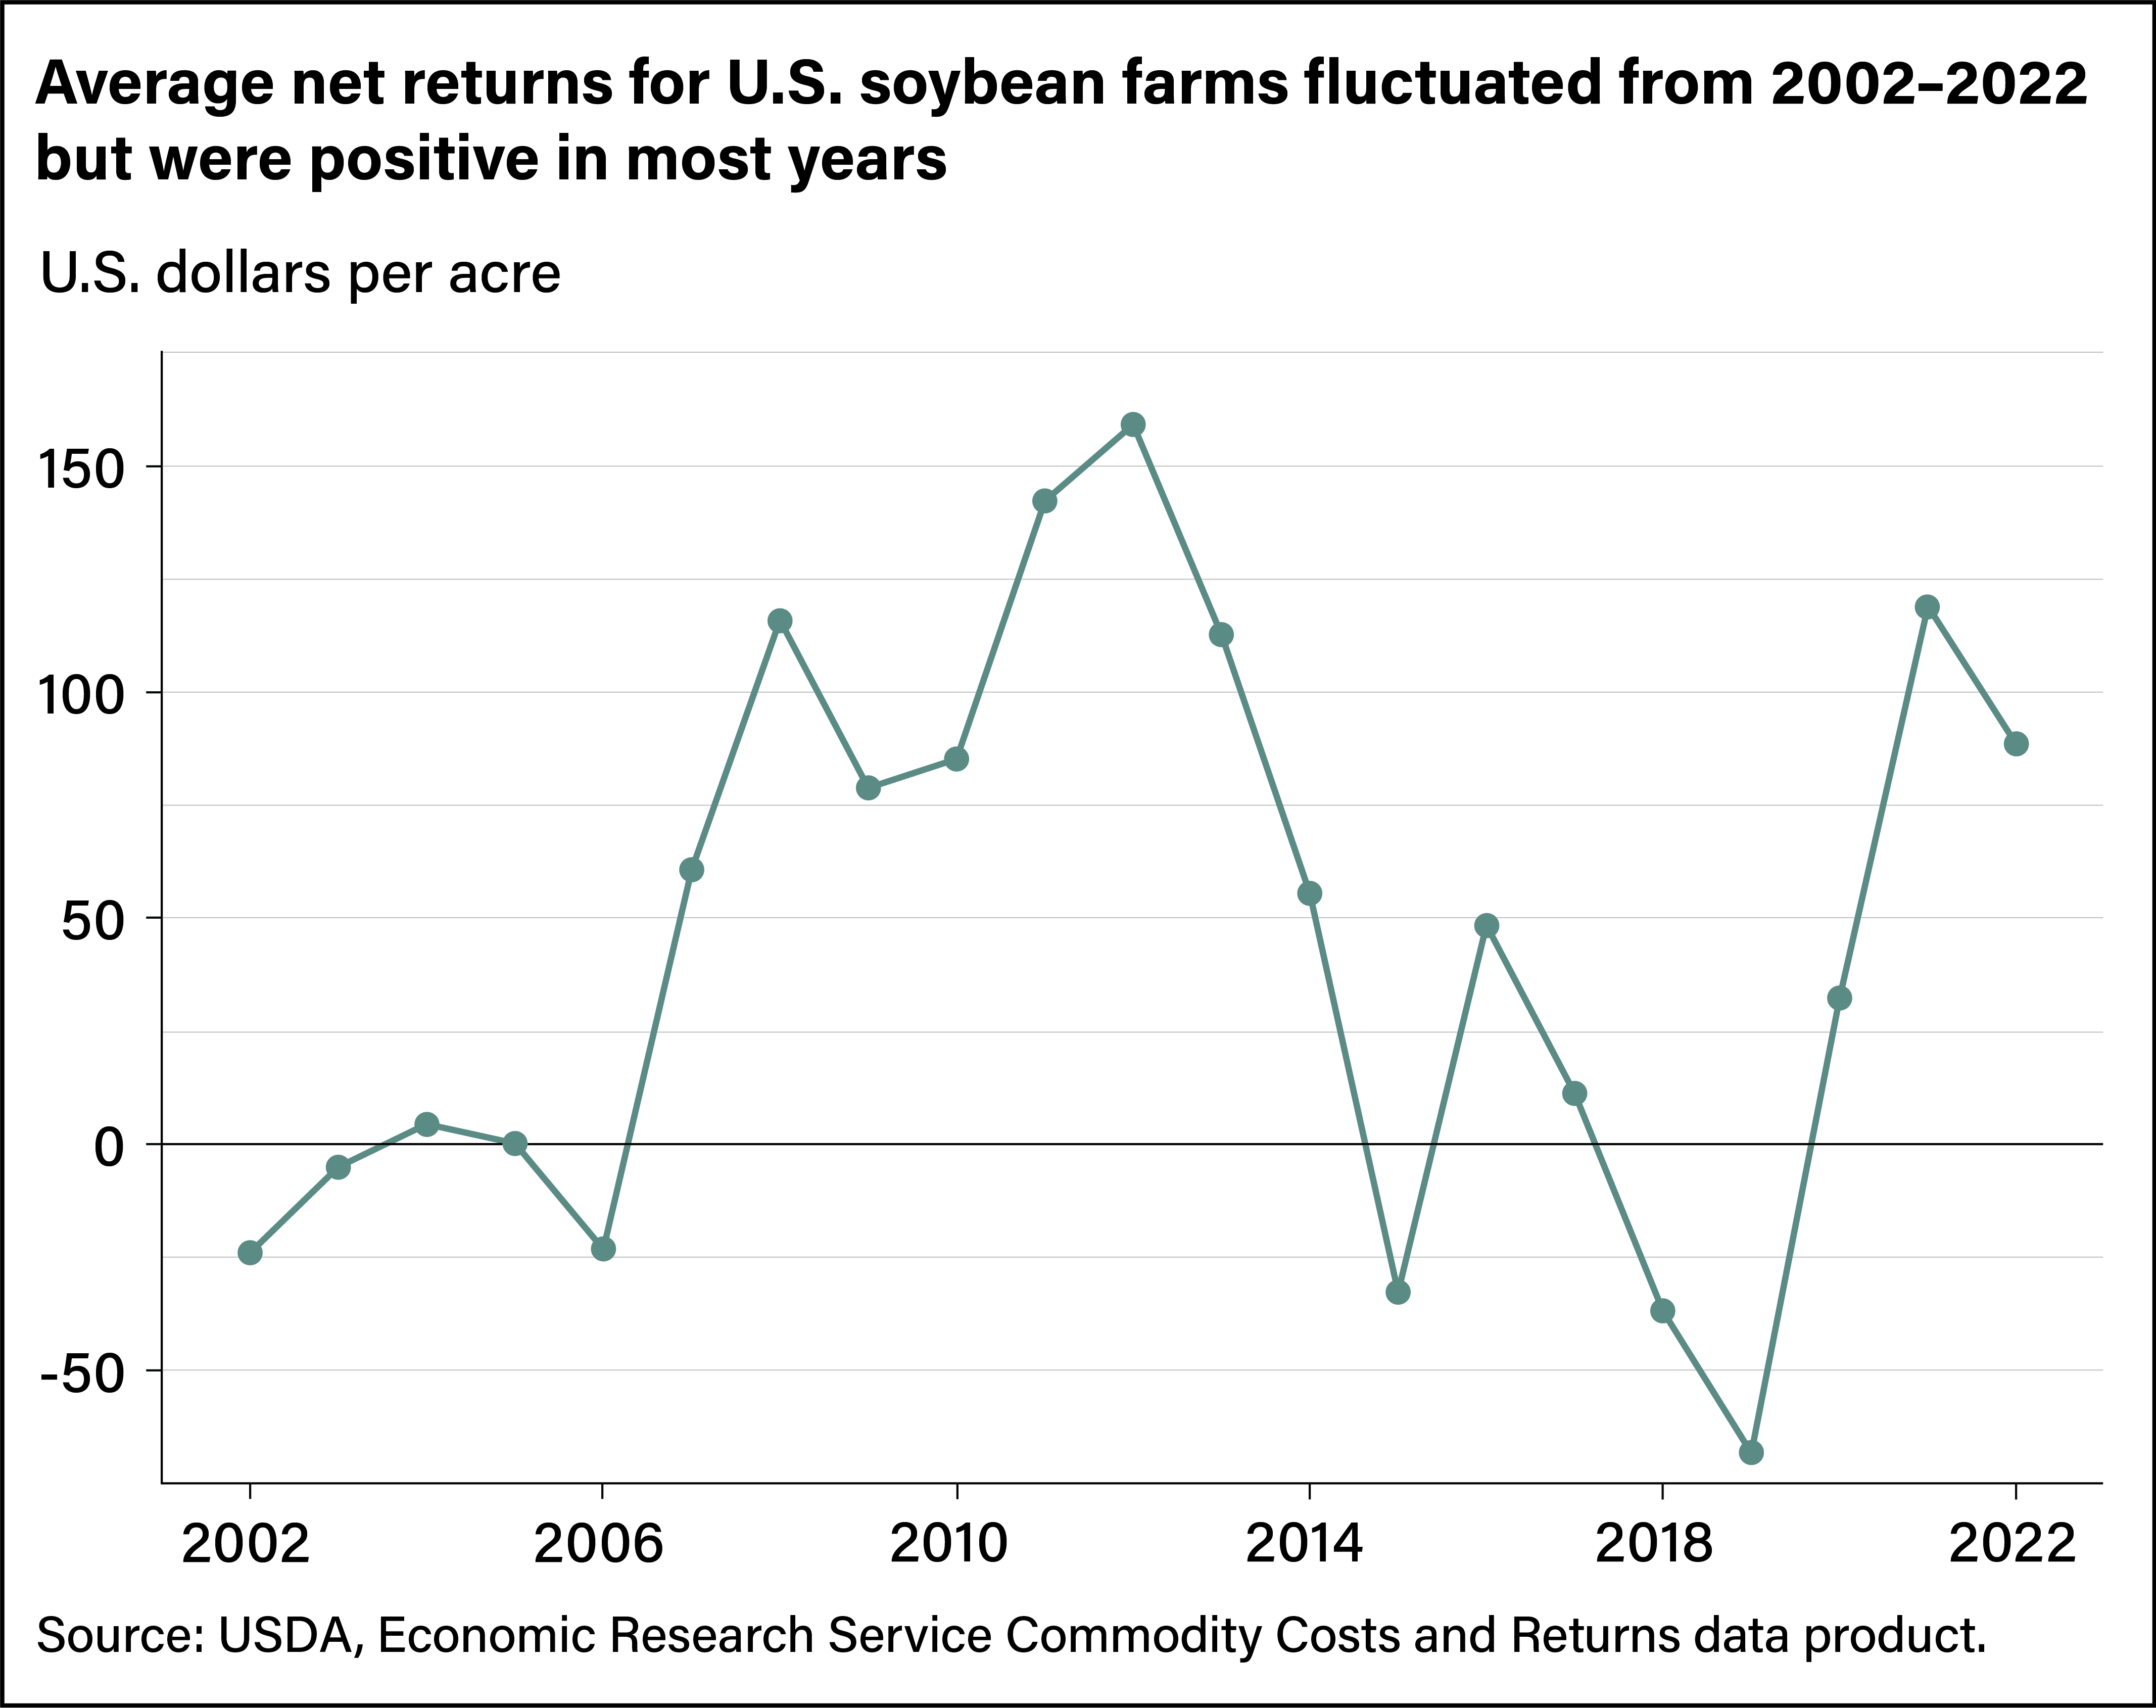
Production costs are critical to the profitability of soybean farming. Net returns, one measure of profitability, are equal to the value of soybean production minus total costs. The value of production, or the income from soybean farming, equals the price of soybeans times the yield. Therefore, net returns fluctuate with changes in production costs, yield, and price. Some years are much more profitable for soybean farmers than others. Since 2002, average net returns have fluctuated from negative values (-$68) in 2019 to $159 in 2012. In 2019, trade disputes reduced global demand for U.S. soybeans and, in turn, soybean prices. In 2012, yields were low compared with other years, but the price of soybeans was high, leading to higher returns.
Productivity Increasing Over Time
The cost of producing a bushel of soybeans is calculated as the cost per acre divided by the yield. While the total cost of producing an acre of soybeans has increased, yield gains from 2002 to 2022 have resulted in declining costs per bushel. After adjusting for inflation, the unit cost of producing one bushel of soybeans in the United States was $10.21 in 2002, $8.93 in 2006, $9.26 in 2012, and $9.07 in 2018. The realization of declining costs per bushel can be interpreted as an increase in soybean productivity over time.
While soybean costs per bushel have generally decreased, yields, expenses per acre, and production practices vary across individual farms. Variability is greatest between farms exhibiting high and low costs of production. In 2018, farms with the lowest costs produced soybeans for an average of $6.75 per bushel; farms with the highest costs averaged $15.36 per bushel. Precision agriculture technology, dicamba-tolerant seed varieties, dicamba, and fungicides were used by more low-cost farmers than high-cost farmers. In contrast, a greater share of high-cost farmers applied fertilizer, possibly because they have low soil fertility and thus a greater demand for fertilizer. Also, as the share of irrigated acres increases, costs rise.
This article is drawn from:
- Vaiknoras, K. & Hubbs, T. (2023). Characteristics and Trends of U.S. Soybean Production Practices, Costs, and Returns Since 2002. U.S. Department of Agriculture, Economic Research Service. ERR-316.
You may also like:
- Effland, A., Saavoss, M., Capehart, T., McBride, W.D. & Boline, A. (2022, April 4). Innovations in Seed and Farming Technologies Drive Productivity Gains and Costs on Corn Farms. Amber Waves, U.S. Department of Agriculture, Economic Research Service.
- Childs, N., Raszap Skorbiansky, S. & McBride, W.D. (2020, May 4). U.S. Rice Production Changed Significantly in the New Millennium, but Remained Profitable. Amber Waves, U.S. Department of Agriculture, Economic Research Service.