
ERS Food Dollar's Three Series Show Distributions of U.S. Food Production Costs
- by Quinton Baker and James Chandler Zachary
- 12/21/2023
The USDA, Economic Research Service’s Food Dollar Series measures annual spending by U.S. consumers on domestically produced food with three series that help answer the question “where does the money spent on food go?” Using different models of the same food supply chain, the three series break down the distribution of a representative $1 of annual consumer food expenditures (a food dollar) on purchases for eating at home and away from home. First, the marketing bill series shows how much farm establishments receive for the sale of farm commodities as a proportion of total food sales. Second, the industry group series shows how the costs of producing and marketing food are distributed across 12 links in the supply chain. Lastly, the primary factor series shows how the value added in food production is split among people, capital assets, and other factors in food production.
One way to show how the three series can be useful is to examine how much money spent on food in the United States goes back to farm establishments under each model.
Marketing Bill Series: Farm Share and Marketing Share
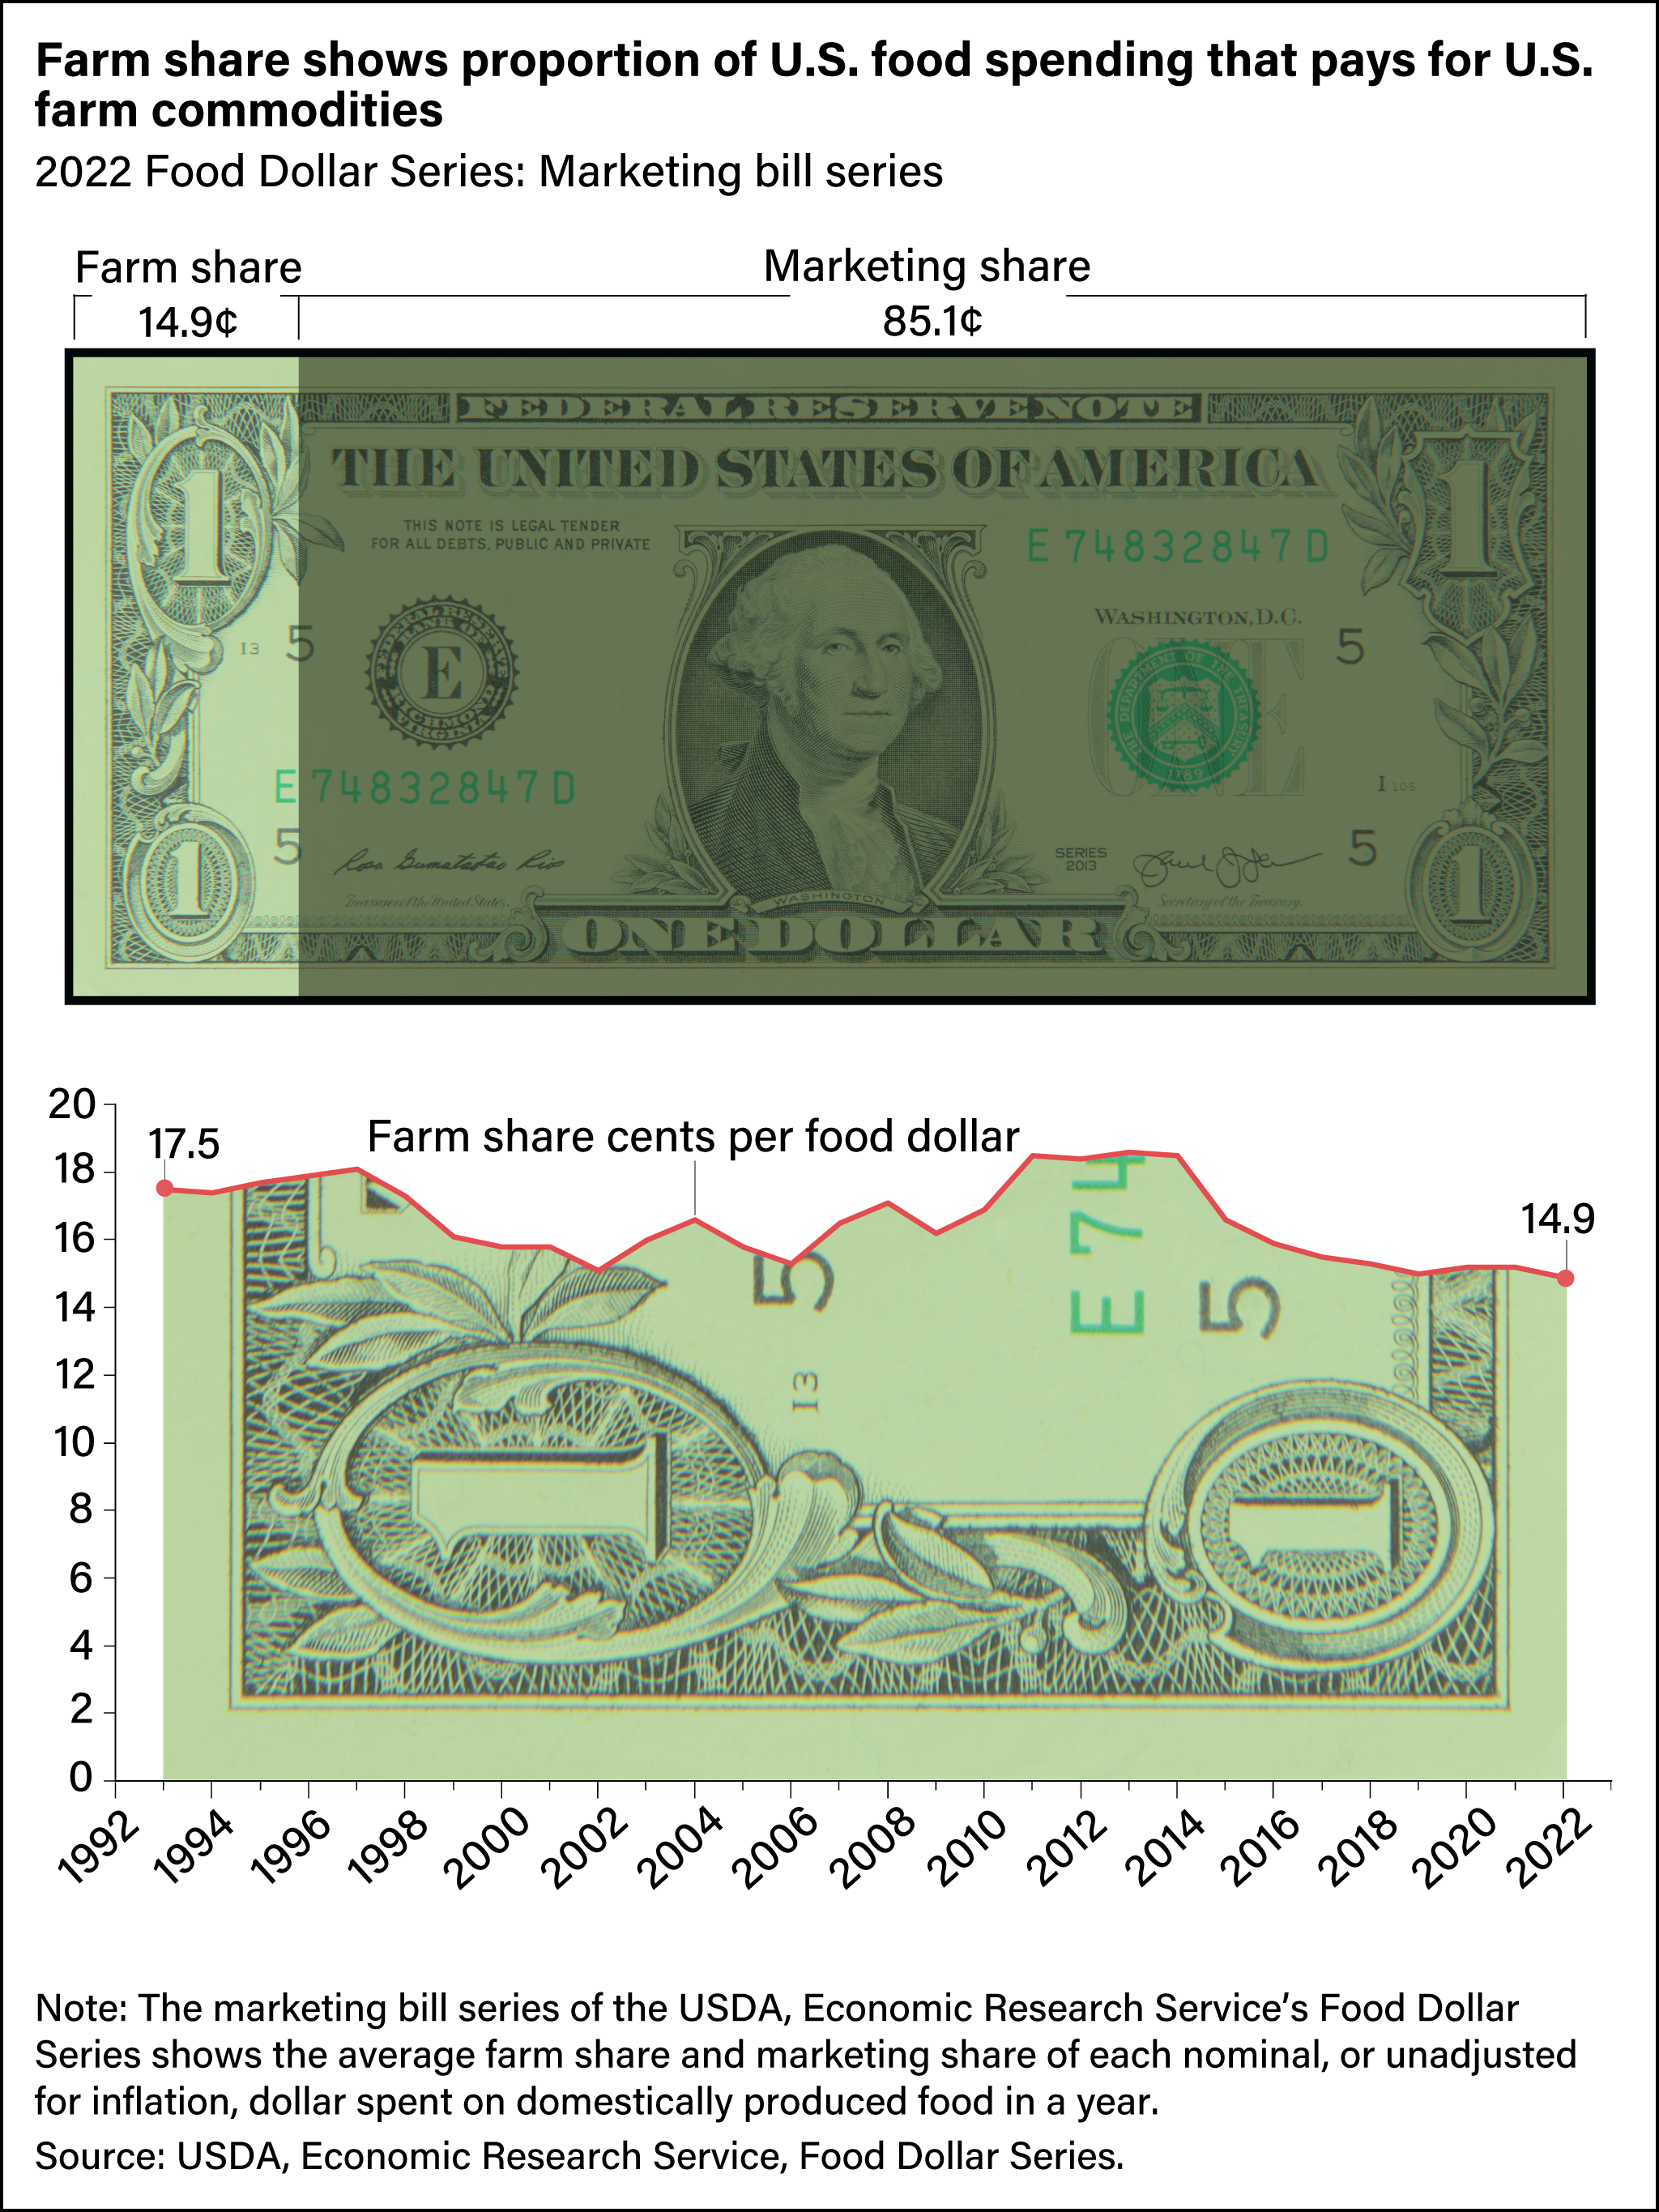
The marketing bill series is divided into two components: the farm share and the marketing share. The farm share represents the value of total raw commodity sales by U.S. farm establishments (excluding farm-to-farm transactions) as a proportion of the total amount U.S. consumers spent on domestically produced food. In 2022, the farm share was 14.9 cents of each dollar spent. The revenues represented in the farm share pay the costs of farm production (such as labor and farm operator expertise), and agribusiness establishments for inputs such as land, seed, and machinery. While most of the farm share comes from food commodity sales, a portion of it comes from the sale of farm commodities that are used as nonfood inputs throughout agricultural-food supply chain. An example of this would be the purchase of cotton towels by restaurants. Finally, the farm share also pays establishments for nonagricultural goods and services used in farm operations such as bookkeeping, electricity and fuel to power equipment, and transportation.
The portion of the marketing bill left after subtracting the farm share is the marketing share. This is the share of total food purchases that pays the other industries that bring food to various points of purchase. In 2022, the marketing share was 85.1 cents.
Farm Production Share of Industry Bill Series
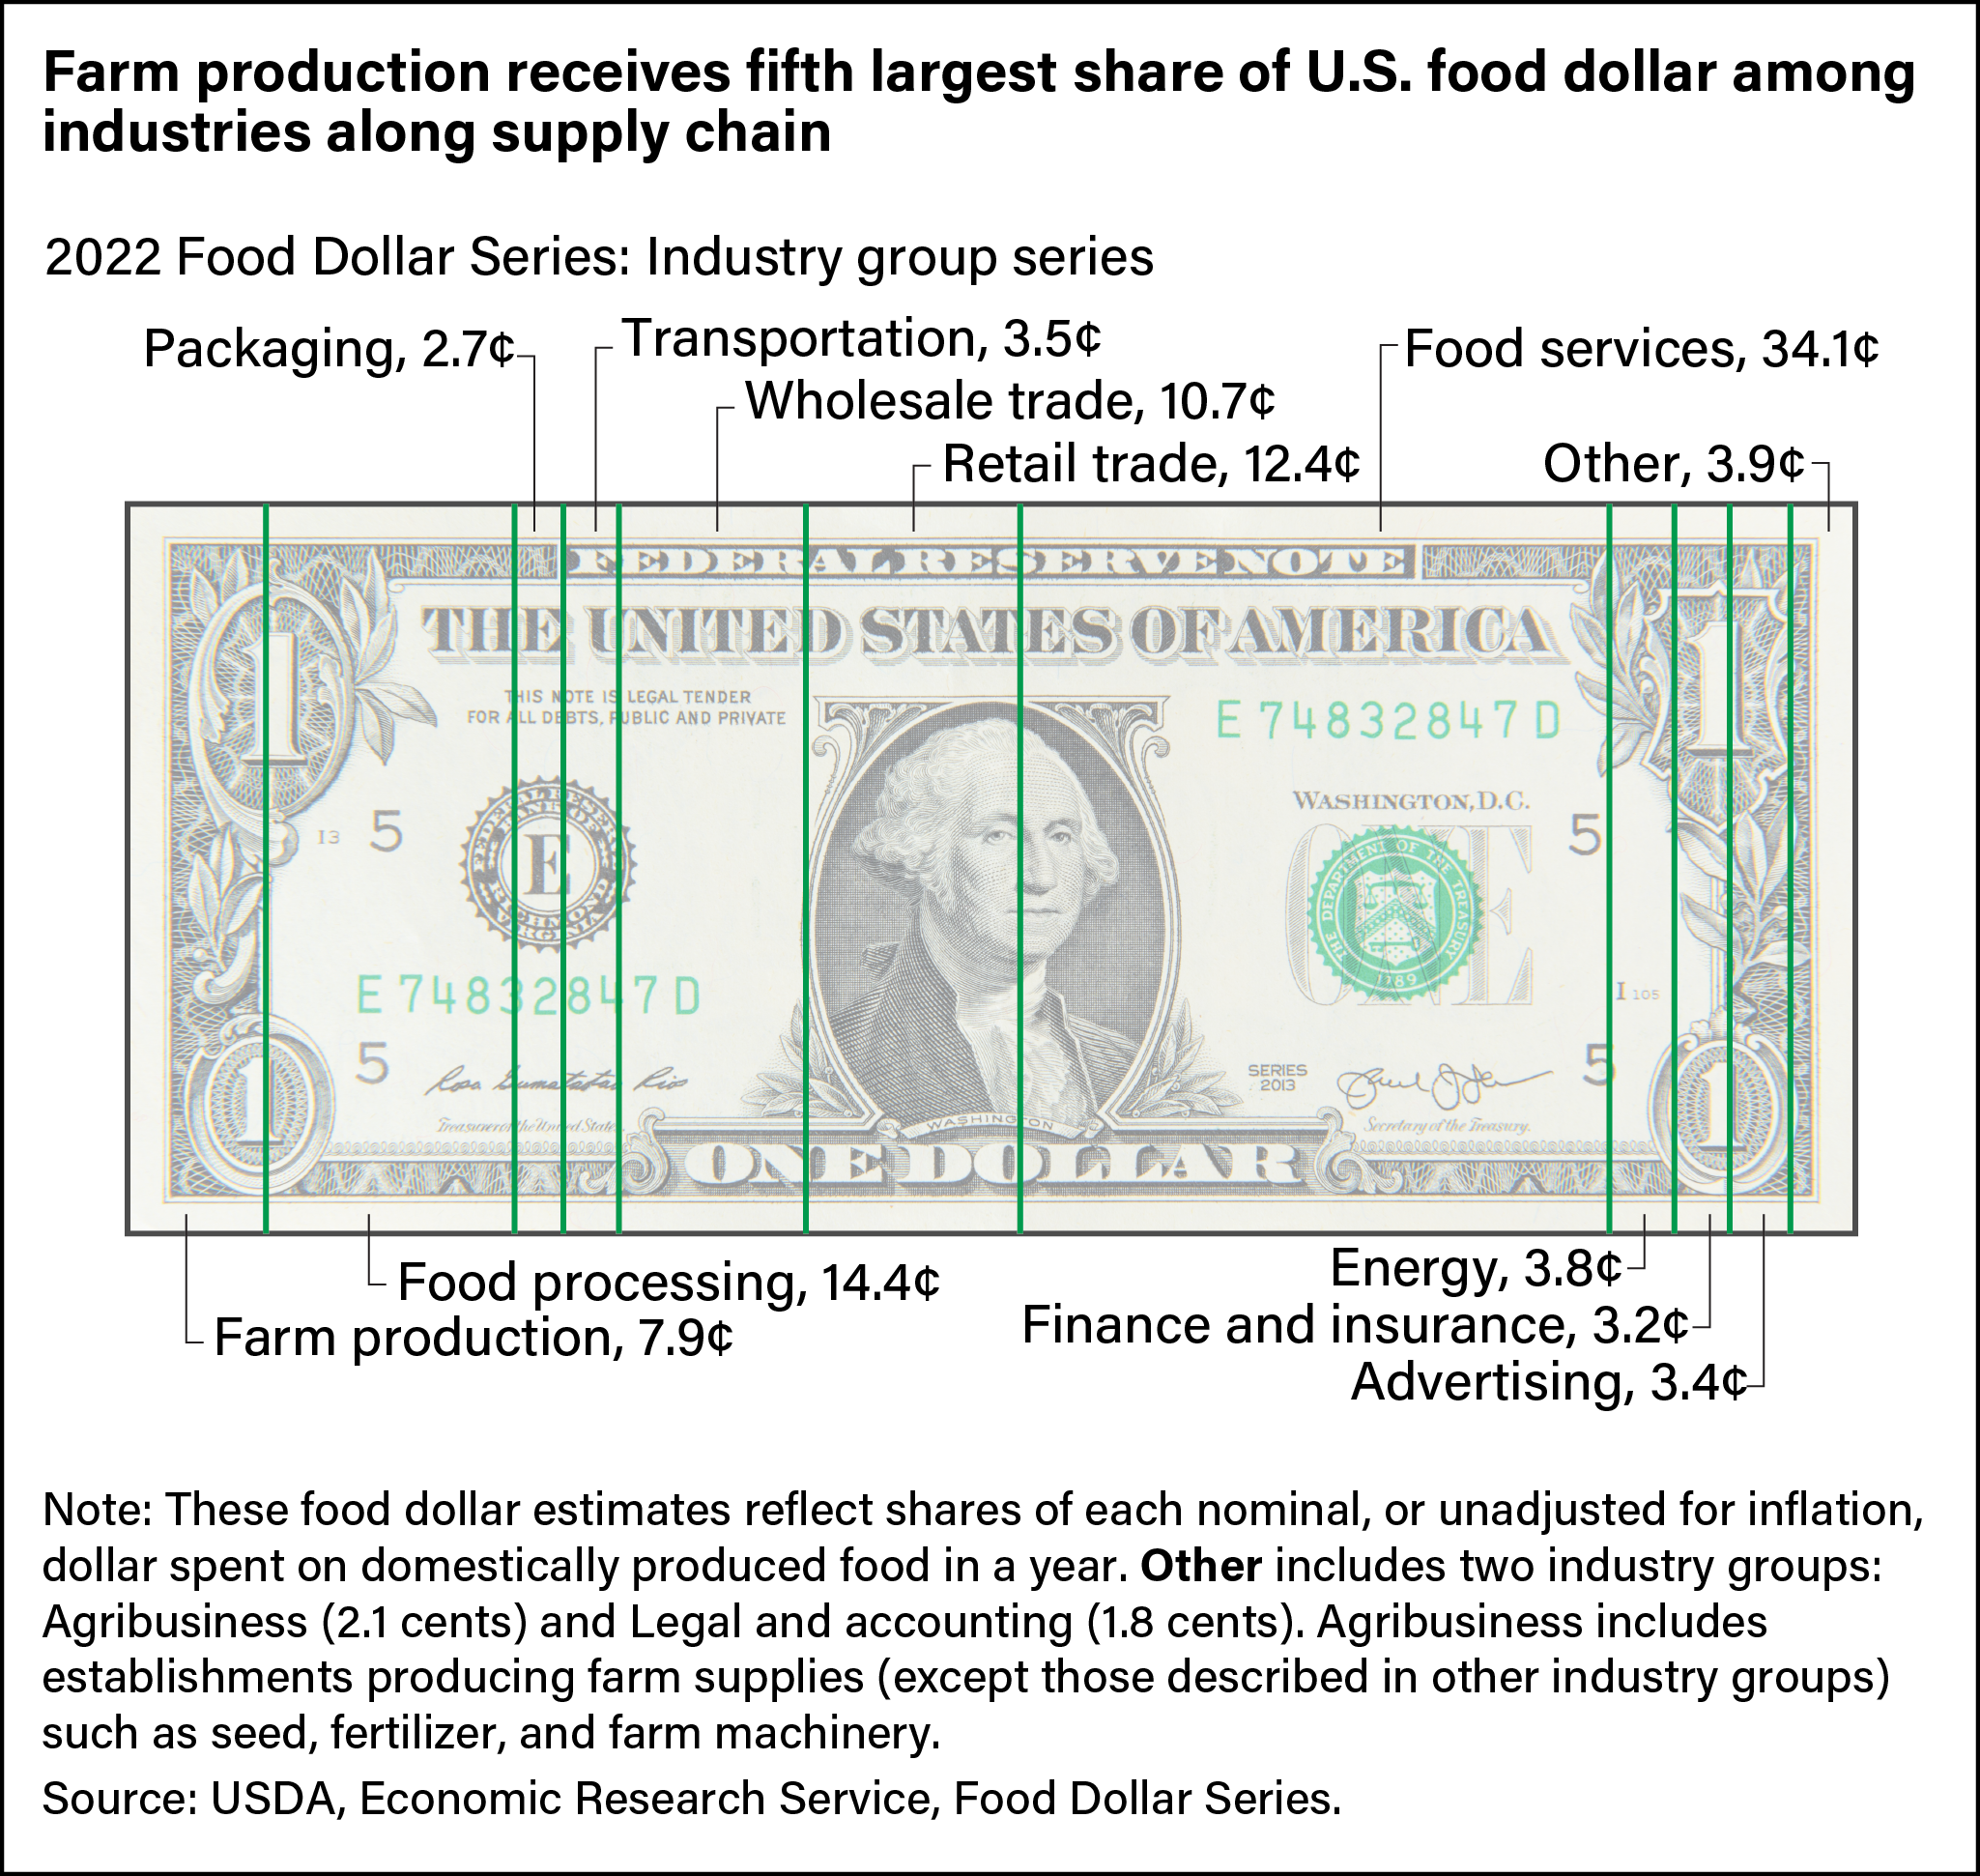
Another way to measure how much food spending goes back to the farm is the farm production share, which is included in the industry group series. This series matches a dollar of food spending with the distribution of food production costs among 12 industries that make up the domestic food supply chain. A key difference between the farm production share in the industry group series and the farm share in the marketing bill series is that the farm production share does not include costs from agribusinesses and nonagricultural establishments that supply goods and services to farms. The farm production share of the food dollar was 7.9 cents in 2022. This means that, per food dollar spent, about 8 cents went to farms for producing food.
Included in the “other” industry group category is the agribusiness share, which represents the industry group that supplies inputs such as seed, fertilizer, and farm machinery to farm production. It accounted for 2.1 cents per food dollar in 2022.
Three Components to Farm Share
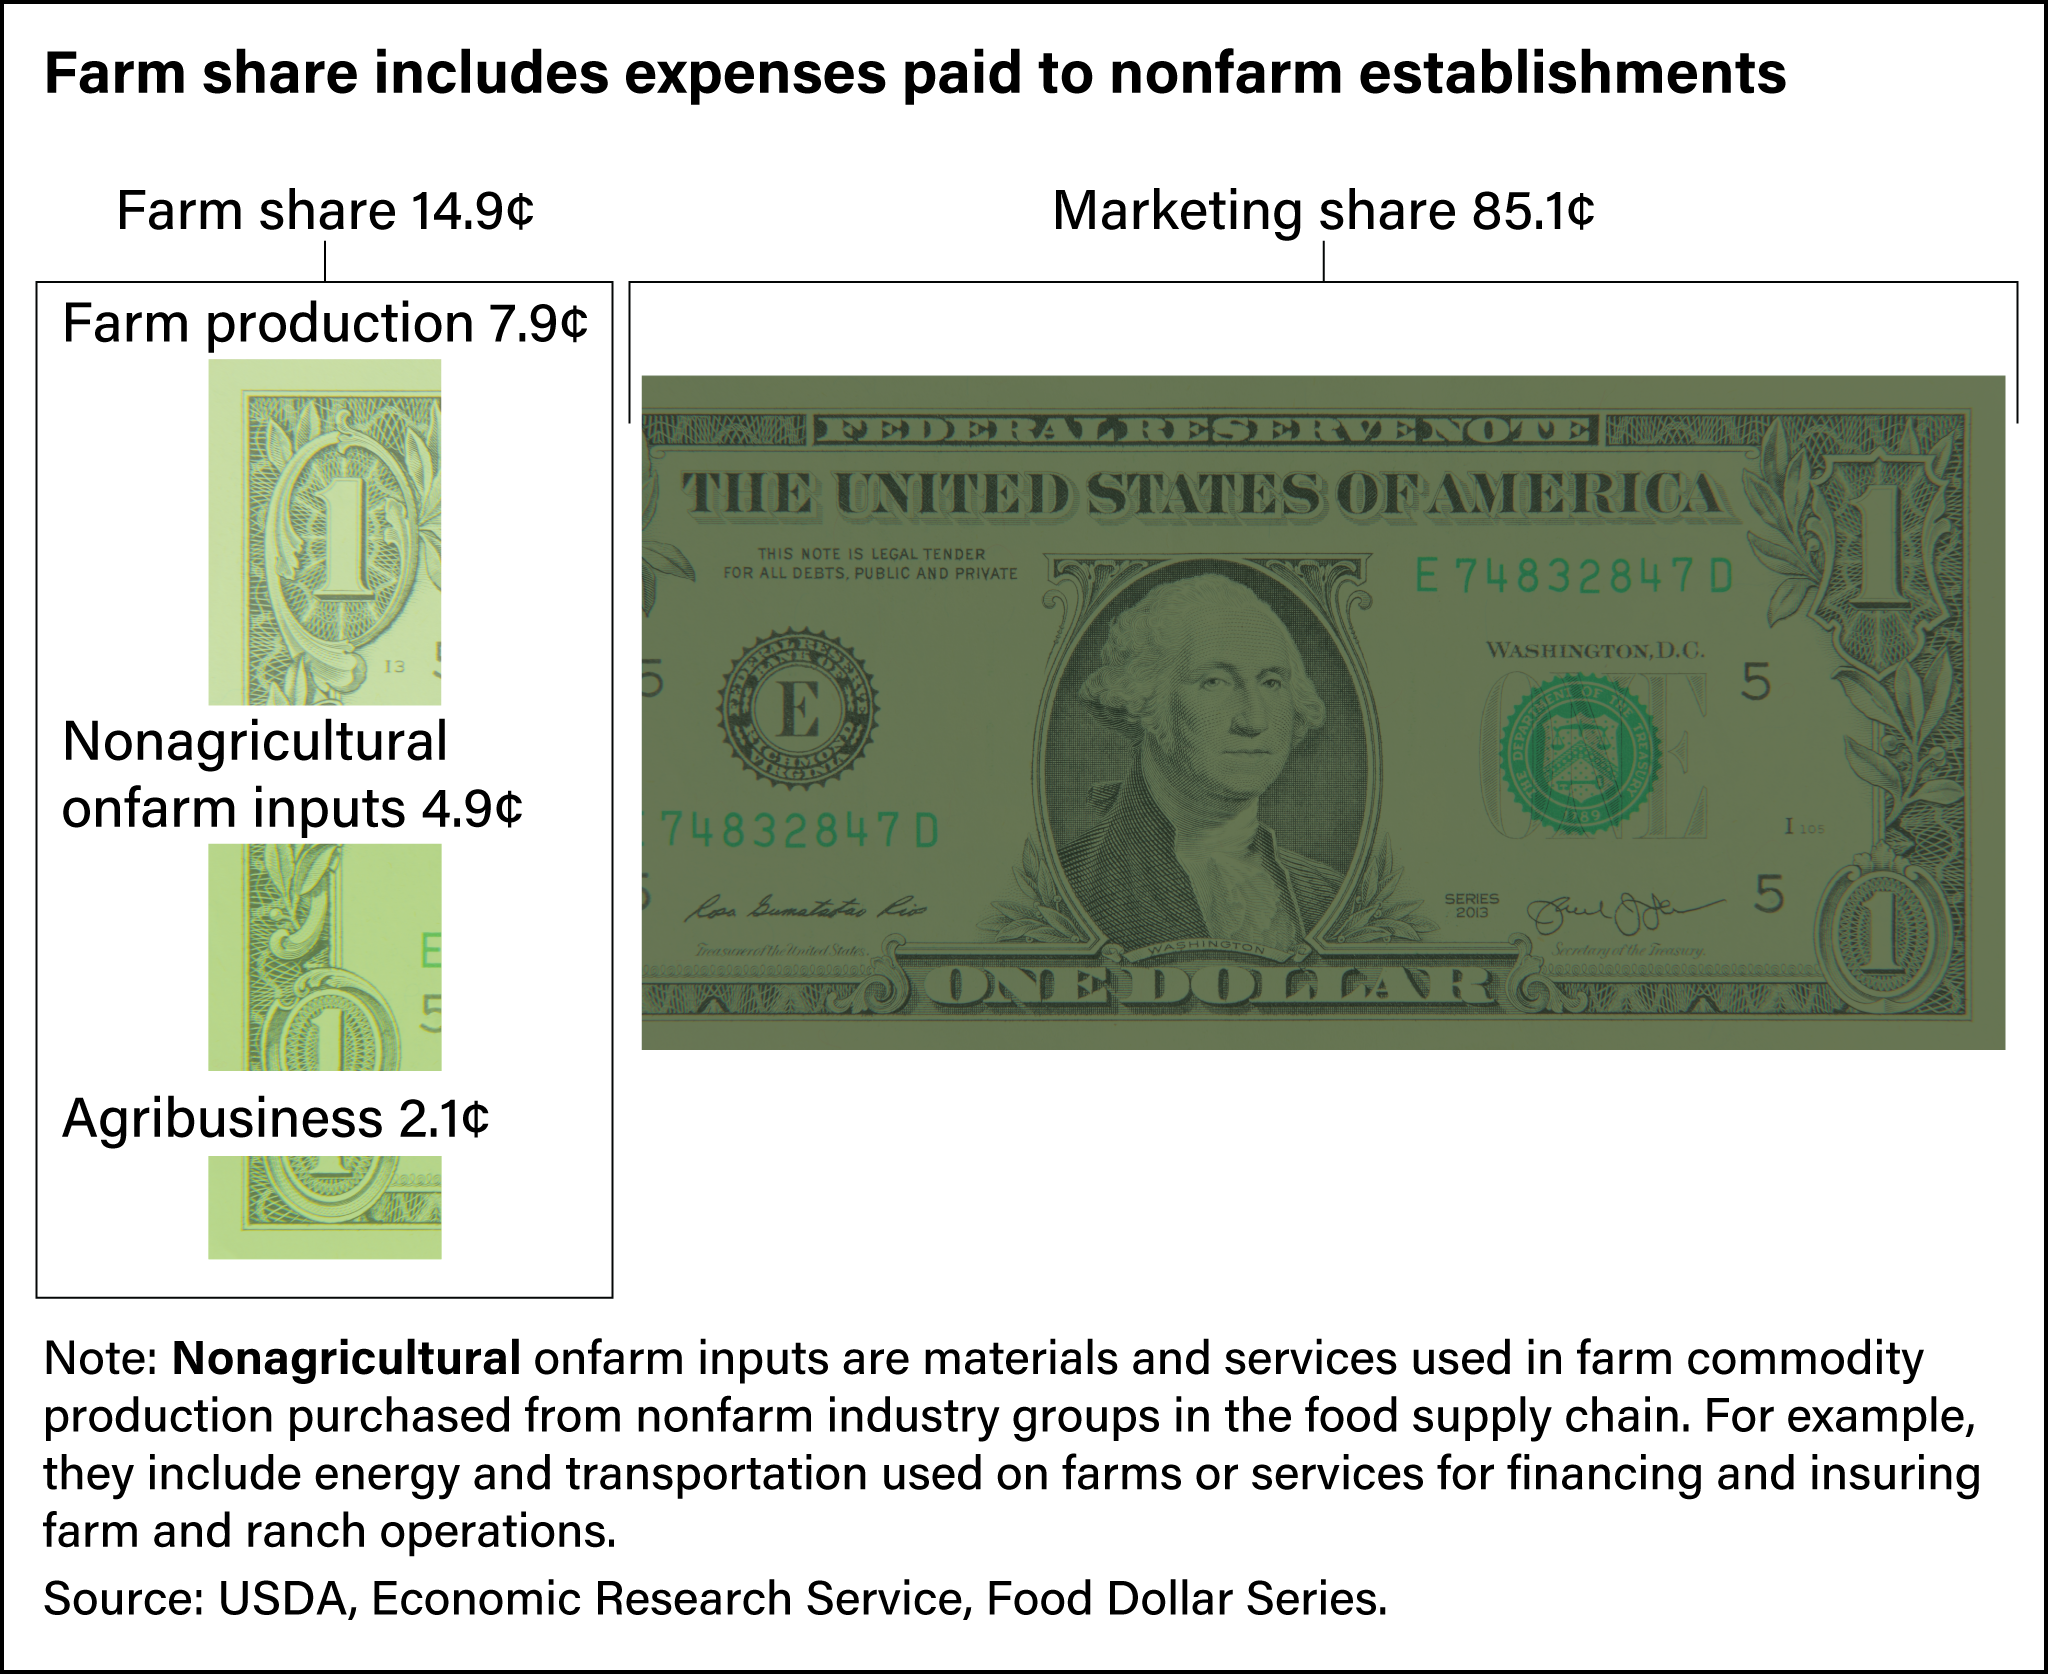
Most of the farm share of the food dollar goes to farm production and agribusiness. The rest covers costs from other industry groups that do not primarily support agriculture but still supply goods and services to farms for commodity production, such as energy and transportation. The 2022 value for these other costs was 4.9 cents. Since 1993, the earliest year measured in the current Food Dollar Series, they have ranged from 4.6 to 6.3 cents and averaged about 5.4 cents.
Primary Factor Series: Measuring Market Value Added
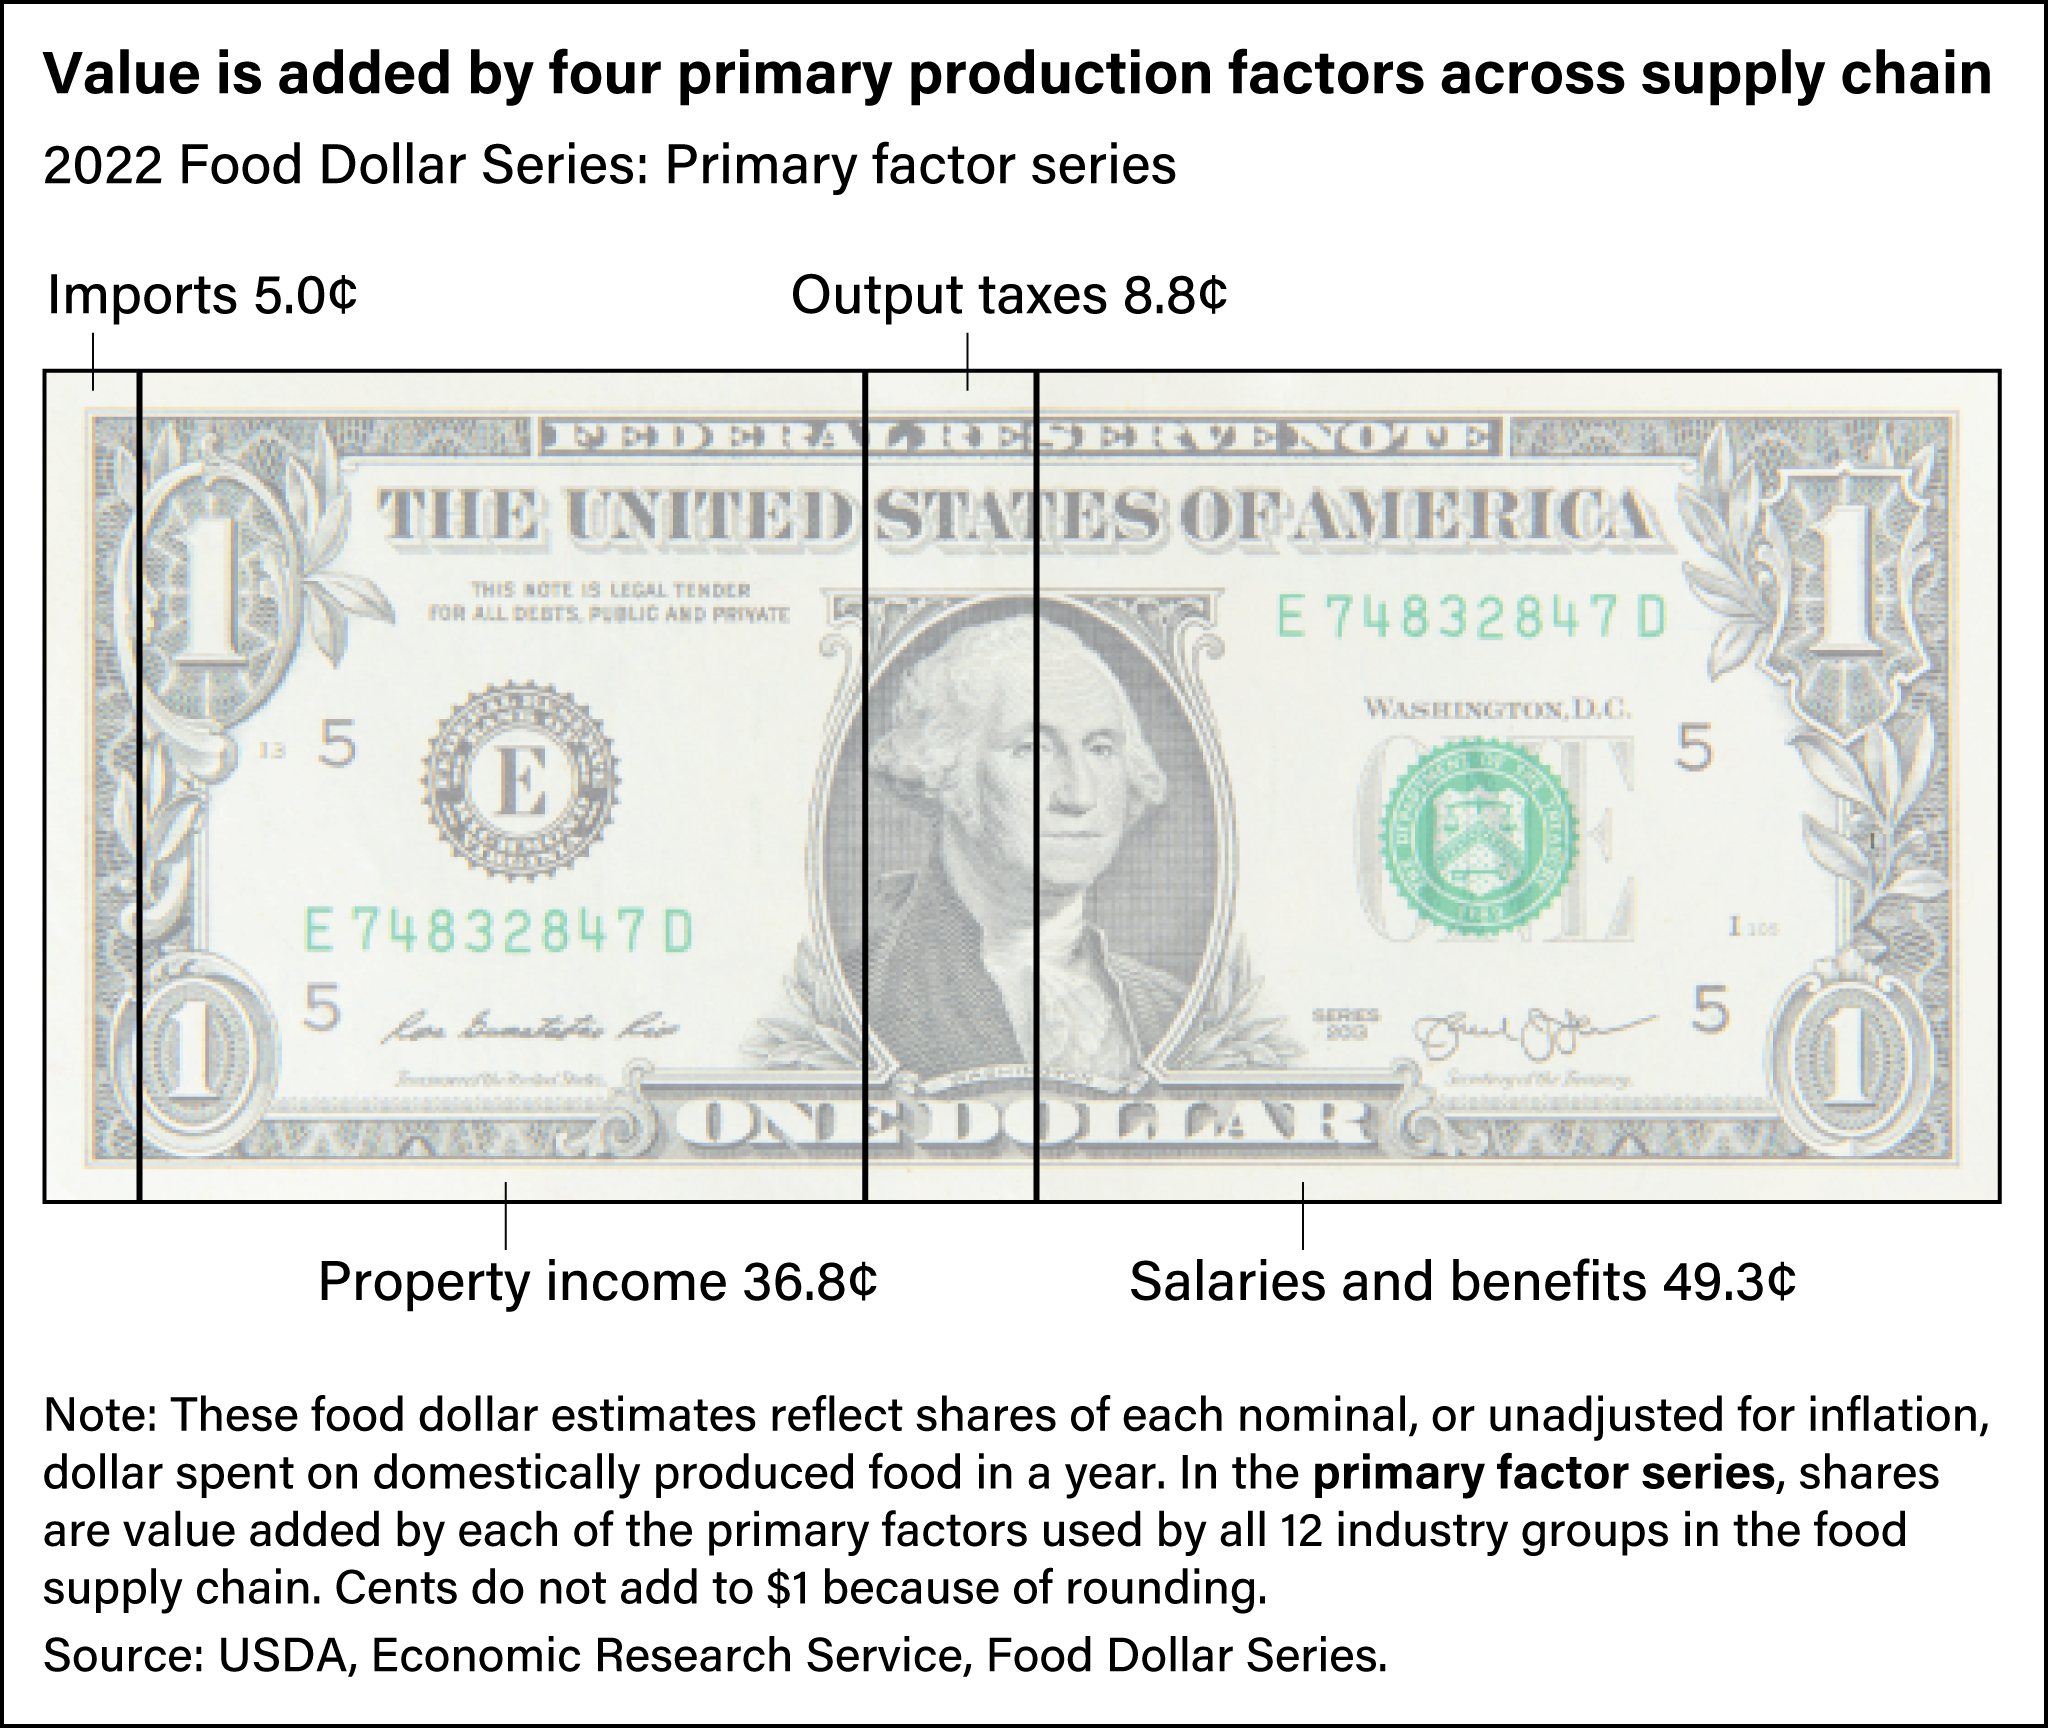
Primary factors are resources such as labor and capital used to transform intermediate materials into products purchased by other establishments or final sales to consumers. Value added is the dollar value of the contributions of these factors to the market value of products and services throughout the economy. The Food Dollar Series sums the value added by all industry groups contributing to the U.S. food supply to create the primary factor series, which shows how a dollar of food expenditures is distributed among four components:
- Salary and benefits — compensation to employees in the form of pretax salaries and employee benefits.
- Output taxes — excise, sales, and other taxes and fees levied on production, less subsidies.
- Imports — the cost of imported materials, ingredients, and equipment used in domestic food production.
- Property income, sometimes called “gross operating surplus” or the return to capital assets —the portion of an industry group’s revenues remaining after operating costs have been paid but before costs such as depreciation and interest have been paid.
For example, the value added by food processors is the value of their sales (such as to wholesalers and distributors) less the costs of raw food commodities and other intermediate production inputs such as energy and water. This dollar amount pays salaries and wages, taxes on production, imported inputs for production, and operating surplus for their contributions to the market value of the food processors products.
The third way to measure how much food spending goes back to the farm is by breaking down the components of value added at the farm level into primary factors. This allows, as an example, the ability to differentiate how much food spending goes back to farm labor versus to the owners of farm capital assets. For instance, when food processors acquire raw farm commodities, their purchase price compensates farm operators for the primary factors that were used up to the purchase point, and the processors’ outputs then become input costs for industries at the next stage.
The Food Dollar Series shows the breakdown of payments to the four production factors by each industry group. For example, in 2022, of the 7.9 cents per dollar spent on food received by the farm production industry group, 1.5 cents paid salaries and benefits, 5.4 cents paid property income, and 1.0 cent paid for imports used in domestic production. Output taxes amounted to 0.0 cent, indicating that taxes paid were equal to subsidies received.
| Breakdown of the farm share of the food dollar, 2022 | |||
|---|---|---|---|
| Farm share | |||
| Raw farm commodity sales | 14.9 cents | ||
| Total value added at farmgate | 14.9 cents | ||
| Purchases by farm establishments | |||
| Agricultural inputs | 2.1 cents | ||
| Other onfarm, nonagricultural inputs | 4.9 cents | ||
| Total cost of inputs | 7.0 cents | ||
| Value added by farm establishments | |||
| Salaries and benefits | 1.5 cents | ||
| Output taxes less subsidies | 0.0 cent | ||
| Imports | 1.0 cent | ||
| Property income | 5.4 cents | ||
| Total farm production costs | 7.9 cents | ||
| Source: USDA, Economic Research Service, Food Dollar Series. | |||
This article is drawn from:
- Food Dollar Series. (n.d.). U.S. Department of Agriculture, Economic Research Service.
You may also like:
- Rehkamp, S. & Canning, P. (2015, July 6). Accounting for Direct and Embedded Imports in the U.S. Food and Beverage Dollar. Amber Waves, U.S. Department of Agriculture, Economic Research Service.
- Canning, P. (2011, June 16). A New Look at Where Our Food Dollars Go. Amber Waves, U.S. Department of Agriculture, Economic Research Service.
- Canning, P. (2013, July 1). ERS Food Dollar Series Allows an Indepth Look at Farm Level Components of the U.S. Food Dollar. Amber Waves, U.S. Department of Agriculture, Economic Research Service.
- Sweitzer, M., MacLachlan, M., Sinclair, W., Stevens, A., Stewart, H., Zachary, J.C. & Zeballos , E. (2023, July 10). ERS Data Products Show Food-At-Home Price Inflation From Producers to Consumers. Amber Waves, U.S. Department of Agriculture, Economic Research Service.
- Canning, P. (2011). A Revised and Expanded Food Dollar Series: A Better Understanding of Our Food Costs. U.S. Department of Agriculture, Economic Research Service. ERR-114.