
Increases in U.S. Farm Debt and Interest Expenses Minimally Affect Sector’s Financial Position in the Short-Term, as Measured by Liquidity and Solvency Ratios
- by Anil K. Giri and Dipak Subedi
- 8/10/2023
Highlights
- USDA's Economic Research Service forecasts that total farm sector debt will increase to a record high $535 billion in 2023.
- Increases in interest rates and higher debt levels add to farm sector costs.
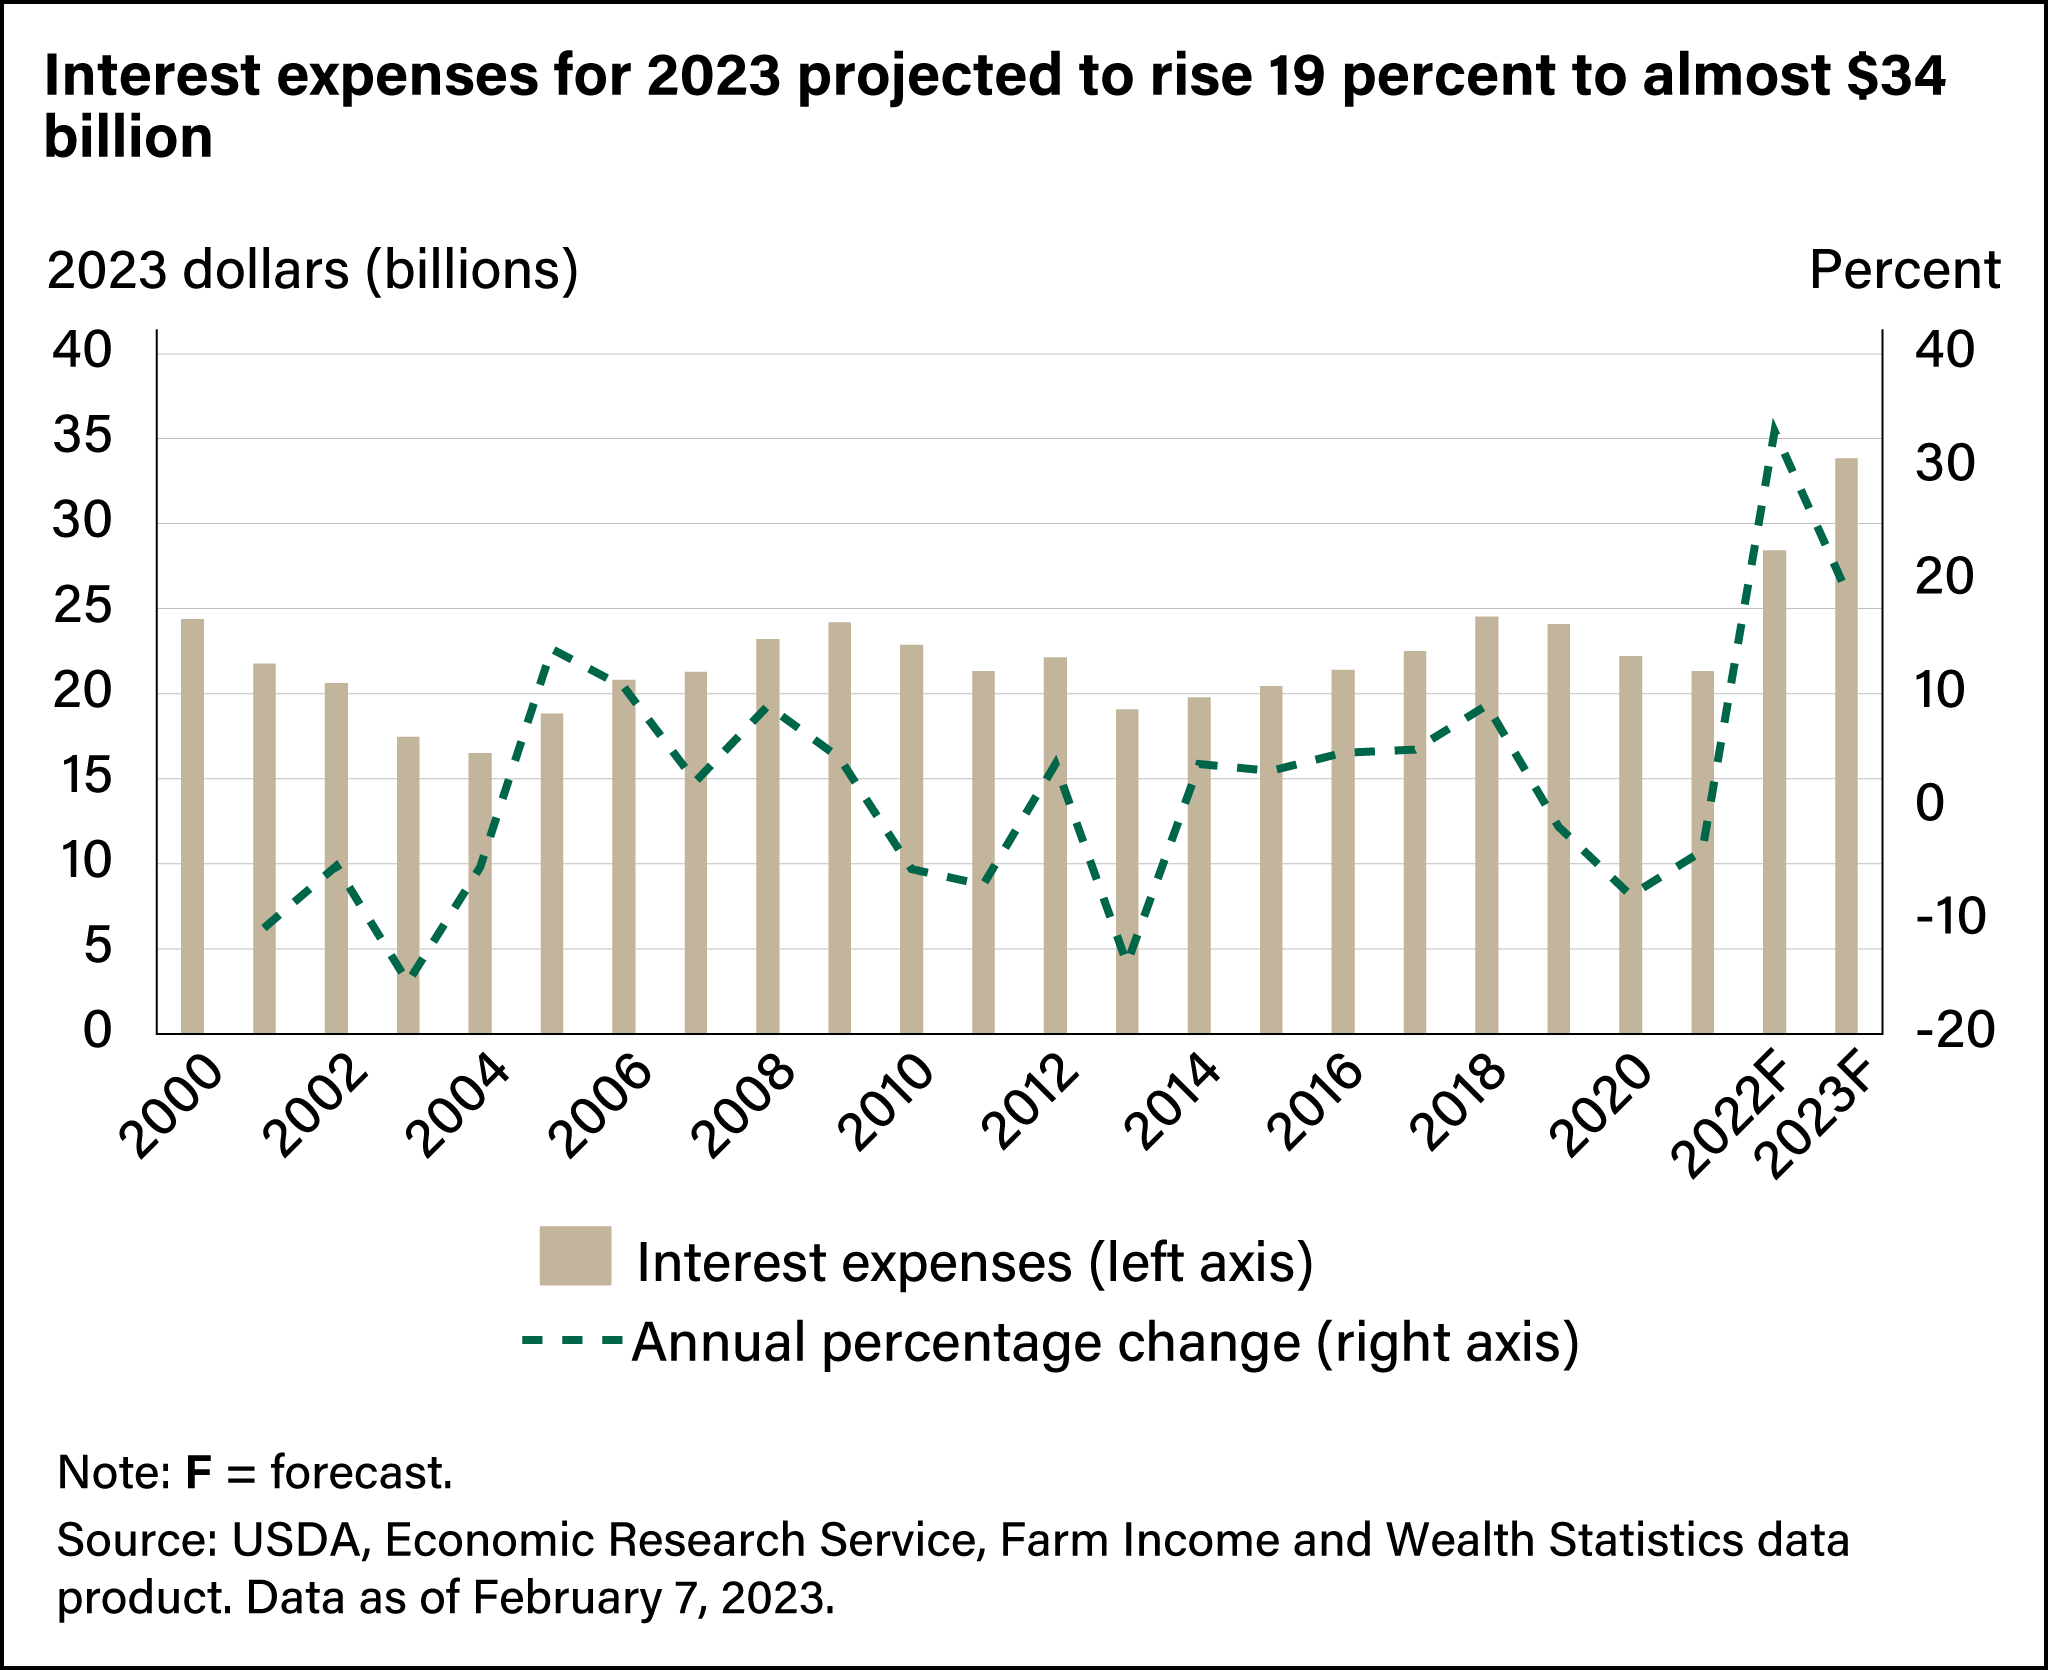
- As a share of production expenses, interest expenses are the third largest (7.4 percent). They also are the fastest growing farm production expense, increasing 19.1 percent in 2023 and 33.2 percent in 2022.
U.S. farm debt is on track to rise to a record level in 2023, the USDA’s Economic Research Service (ERS) projected in its February 7, 2023, Farm Income Forecast release. The projected increases in debt would be across both real estate and nonreal estate obligations. Moreover, interest expenses would be the fastest growing agricultural production cost after a series of rate increases by the Federal Reserve over the past year to address rising inflation. Debt and interest expense increases have implications for liquidity and solvency of the farm sector. Liquidity refers to the ability of farms and ranches to meet short-term debt obligations. Solvency refers to the ability of a farm or ranch to satisfy its long-term debt obligations. Examining some of the key ratios used to measure liquidity and solvency, especially those that use interest expenses or debt in the calculation, can help assess how interest rate increases can affect the farm sector’s financial position.
For the U.S. farm sector, debt-related ratios as a measure of farm financial stress remain within their long-term range even with increased interest expenses. Higher interest rates in the face of a lower net cash income forecast suggest greater use of credit with even higher spending on interest expenses. However, when measured using solvency and liquidity ratios, the potential impact of higher interest expenses, at least in the short term, is minimal.
ERS releases its Farm Income and Wealth Statistics data product three times each year, usually in early February, late August/early September, and late November/early December. The data product includes historical U.S. and State farm income and wealth estimates, U.S. forecasts for the current calendar year, and financial ratios, along with the data underlying those ratios. These projections are intended to help policymakers form farm policies and farmers and other stakeholders to make business decisions. The next forecast is scheduled to be released August 31, 2023.
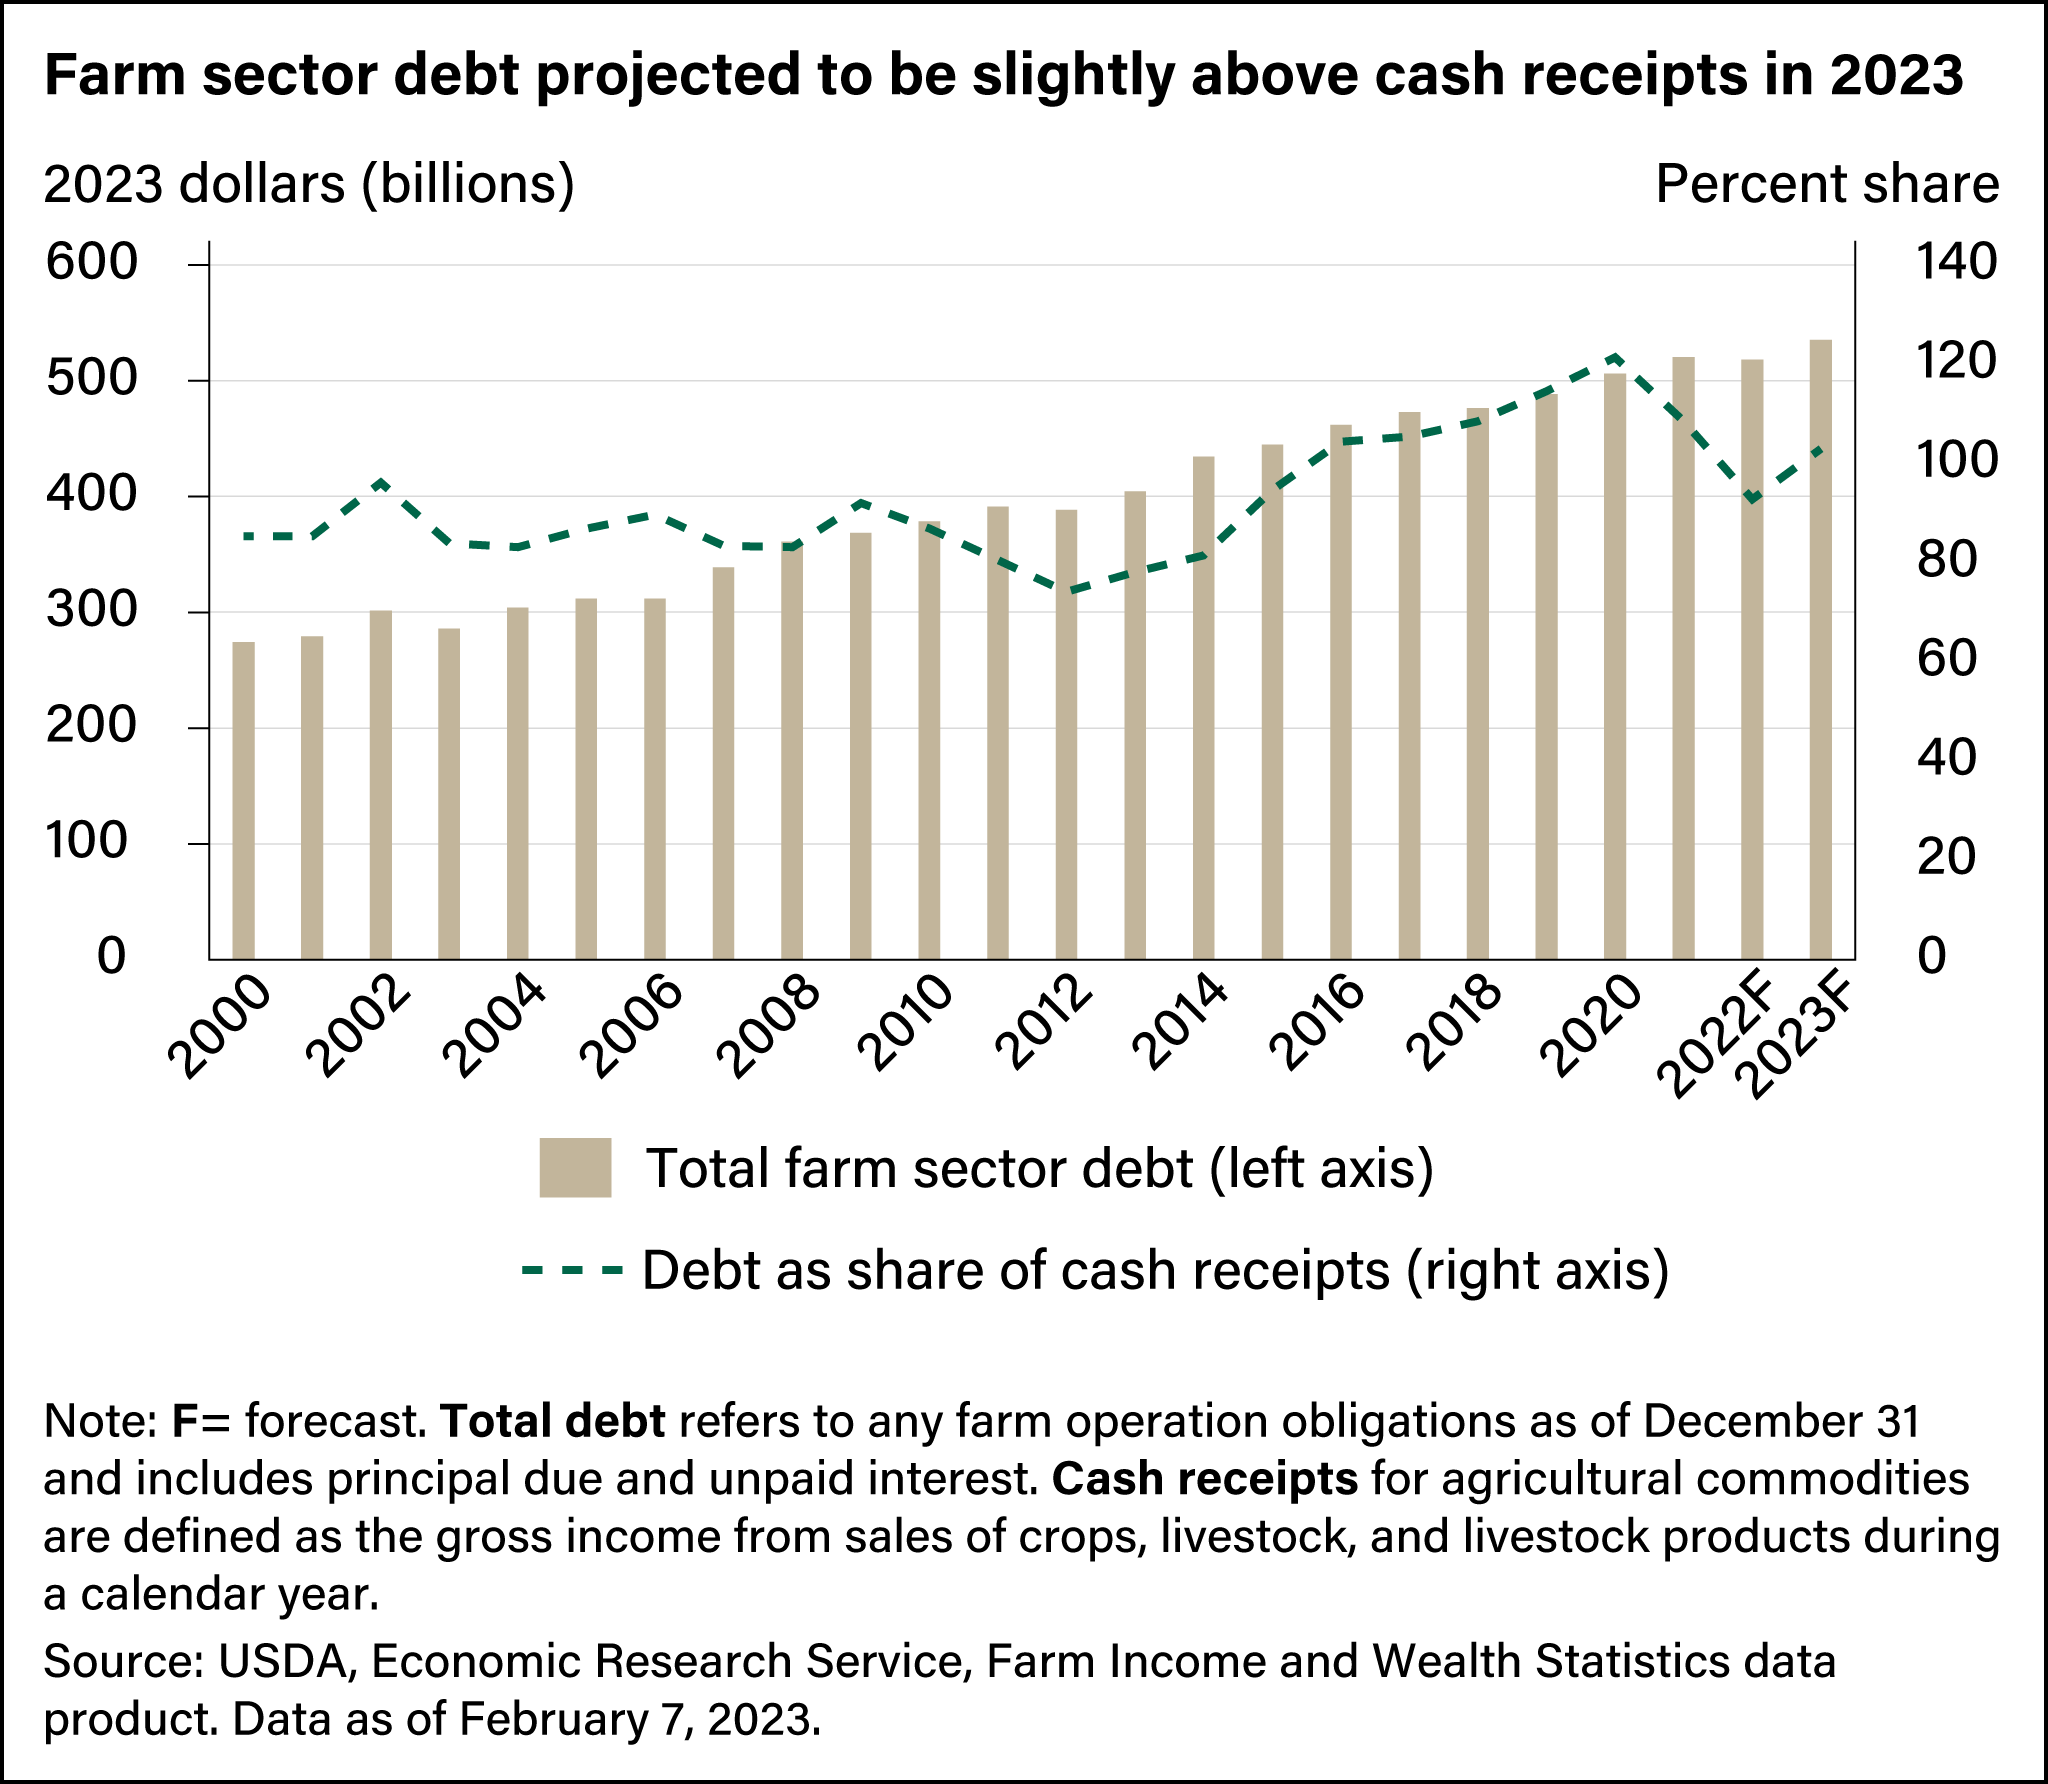
In its February 7, 2023, release, ERS forecast total farm sector debt for the year at a record high $535.09 billion, an increase of $16.95 billion, or 3.3 percent, from 2022. This increase would nearly double the total sector debt compared with the amount in 2000, when it was $274.22 billion (adjusted for inflation). Although actual debt is forecast to reach a record level, another measure—debt as a percent of cash receipts—is still below the high of 121 percent in 2020. Comparing total debt to cash receipts gives a benchmark to evaluate debt in relative terms over the years, just as adjusting actual debt for inflation makes it easier to compare current values with those of the past. Debt as a share of cash receipts compares the amount of debt relative to the sector’s revenue and production across years. This comparison also can indicate if the debt is being used to increase production and revenue and show the ability of the sector to pay back its debt. In 2023, the total sector debt is forecast to be 103 percent of cash receipts, a modest increase after annual decreases in 2021 and 2022.
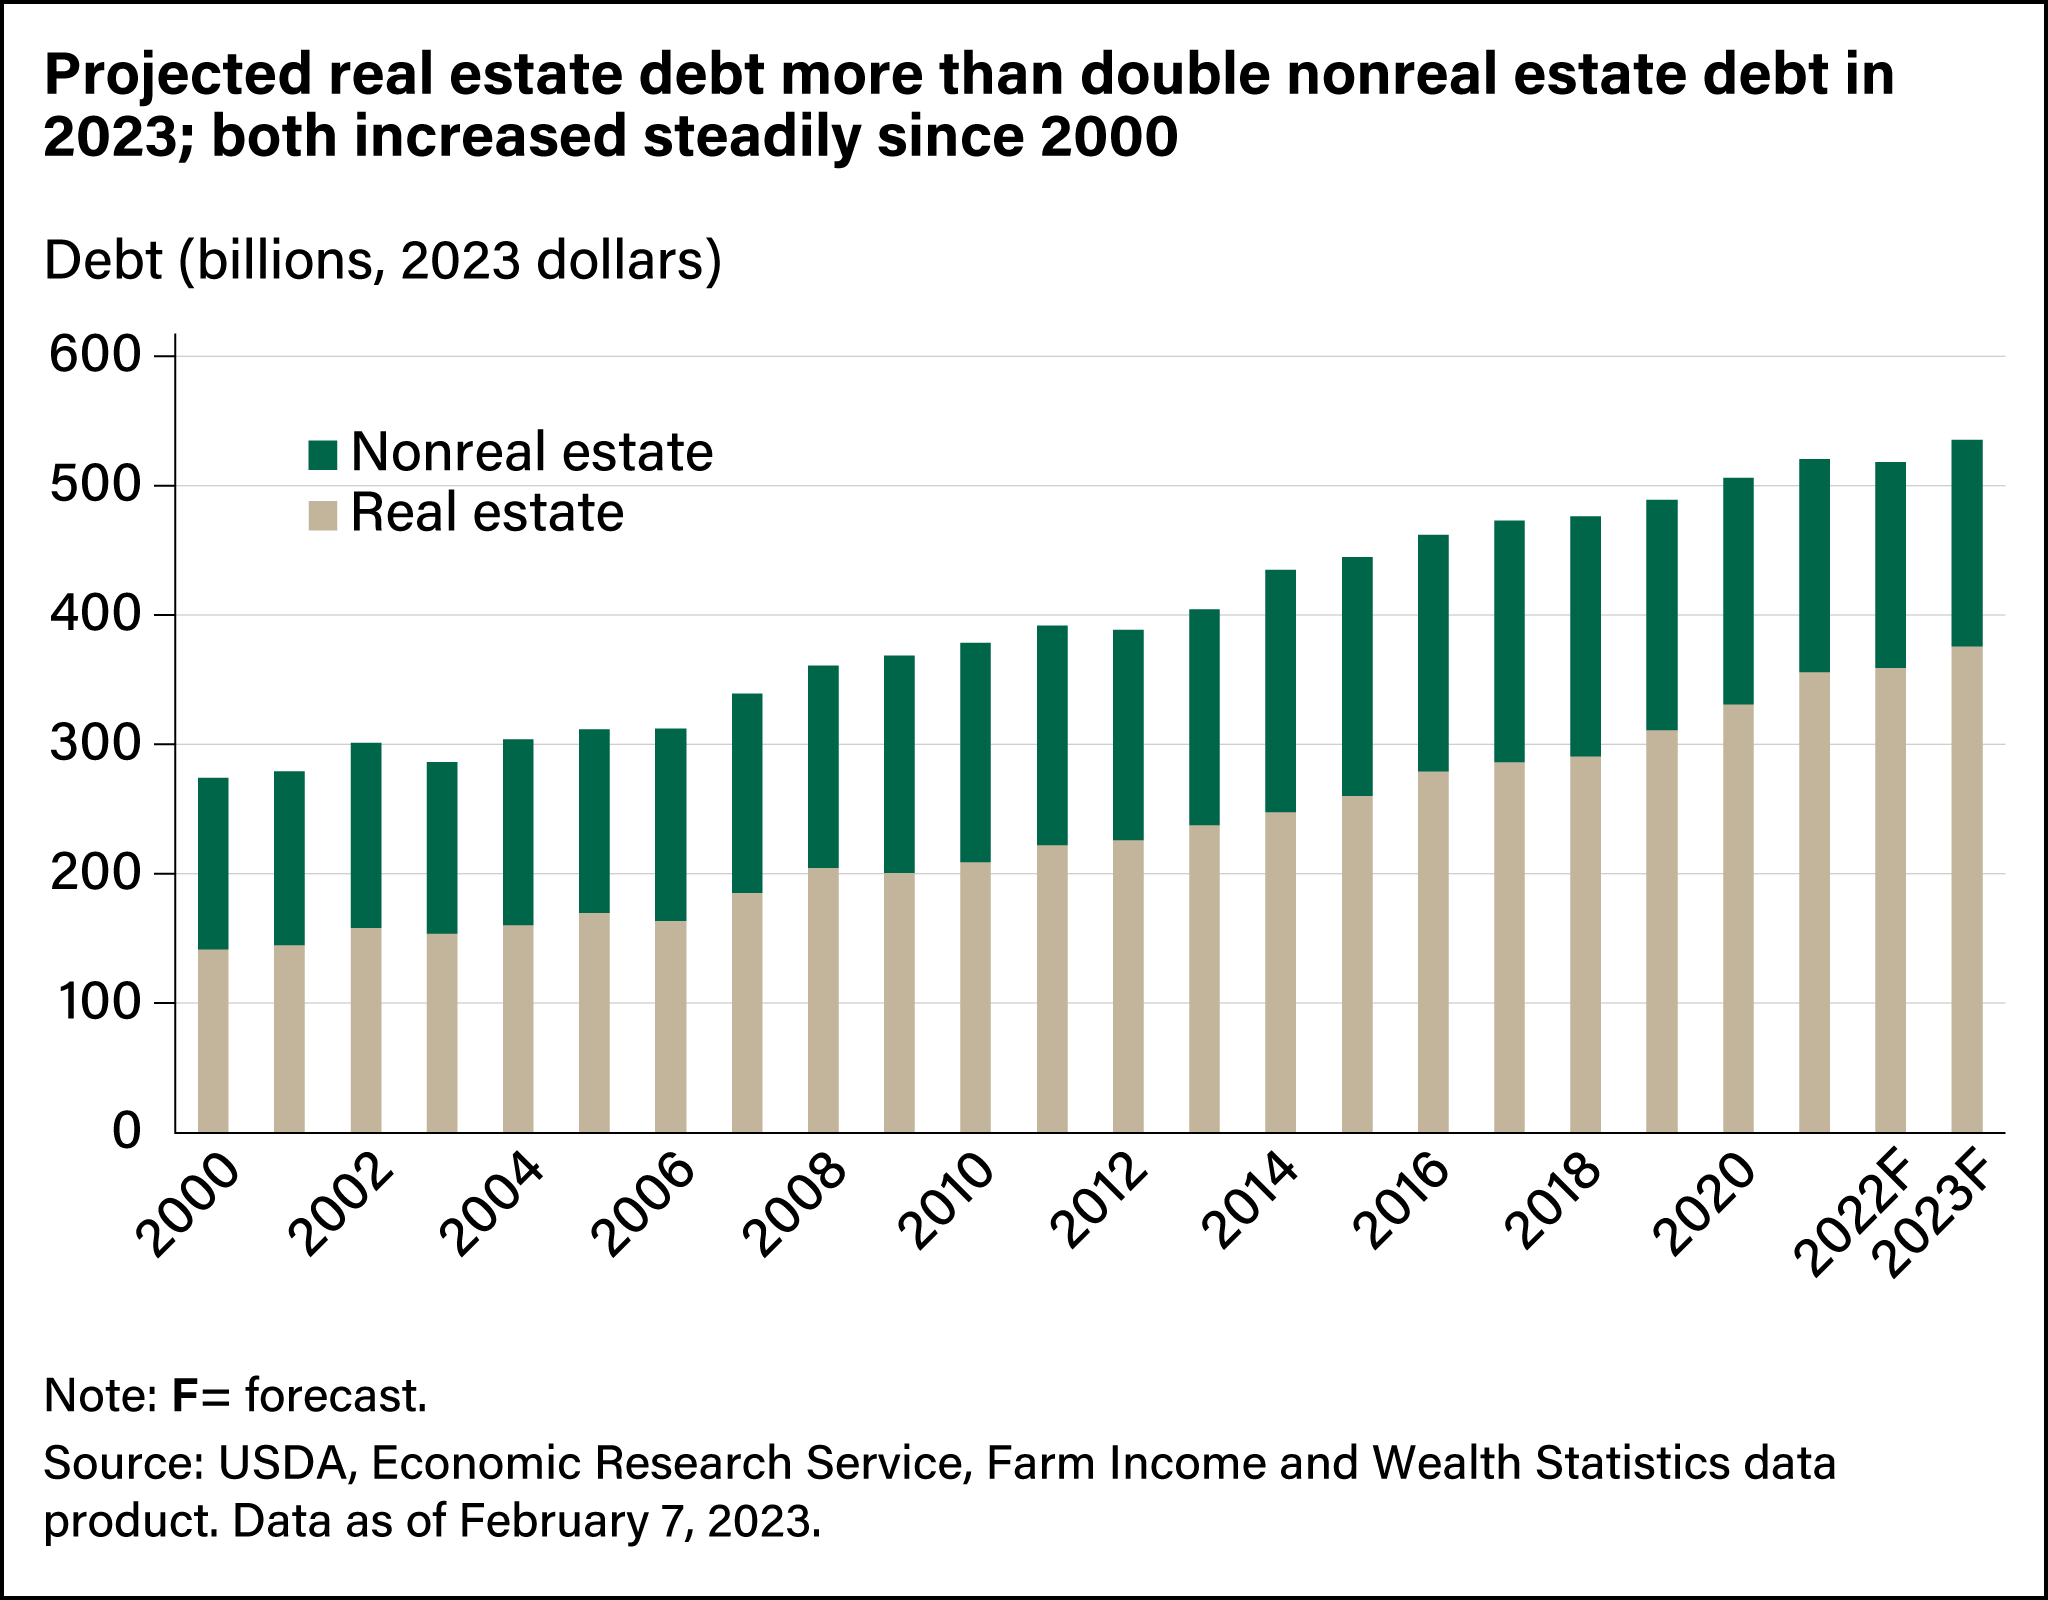
Real Estate and Nonreal Estate Debt Both Forecast To Increase in 2023
USDA tracks two components of total debt—real estate debt and nonreal estate debt (debt not secured by a mortgage). Both are forecast to increase in 2023. Farm real estate debt is expected to reach $375.86 billion in 2023, a 4.7-percent increase from 2022 (adjusted for inflation in 2023 dollars). That would be more than double the farm real estate debt of $141.72 billion (inflation-adjusted) in 2000. Farm nonreal estate debt is expected to increase to $159.20 billion in 2023, a 0.02-percent increase compared with 2022.
One-Fourth of U.S. Farms Carry Some Type of Debt
About one-quarter of U.S. farm operations have some debt. Long-term debt is used to finance or expand farm operations, and short-term debt covers operational expenses. Some farms also take out loans during times of economic hardship. With any type or length of loan, producers incur interest expenses. Interest expenses represent the third largest—and the fastest growing source of—total farm production expenses in 2023. In 2023, interest expenses constitute 7.4 percent of production expenses and are forecast at $33.85 billion. In inflation-adjusted terms, that would be an increase of 19.1 percent over the $28.43 billion in 2022 and 38.9 percent higher than the $24.37 billion in 2000. Even so, interest expenses have risen at a slower rate than total debt, which has doubled since 2000 primarily because of low interest rates during 2008–16 and 2020–21.
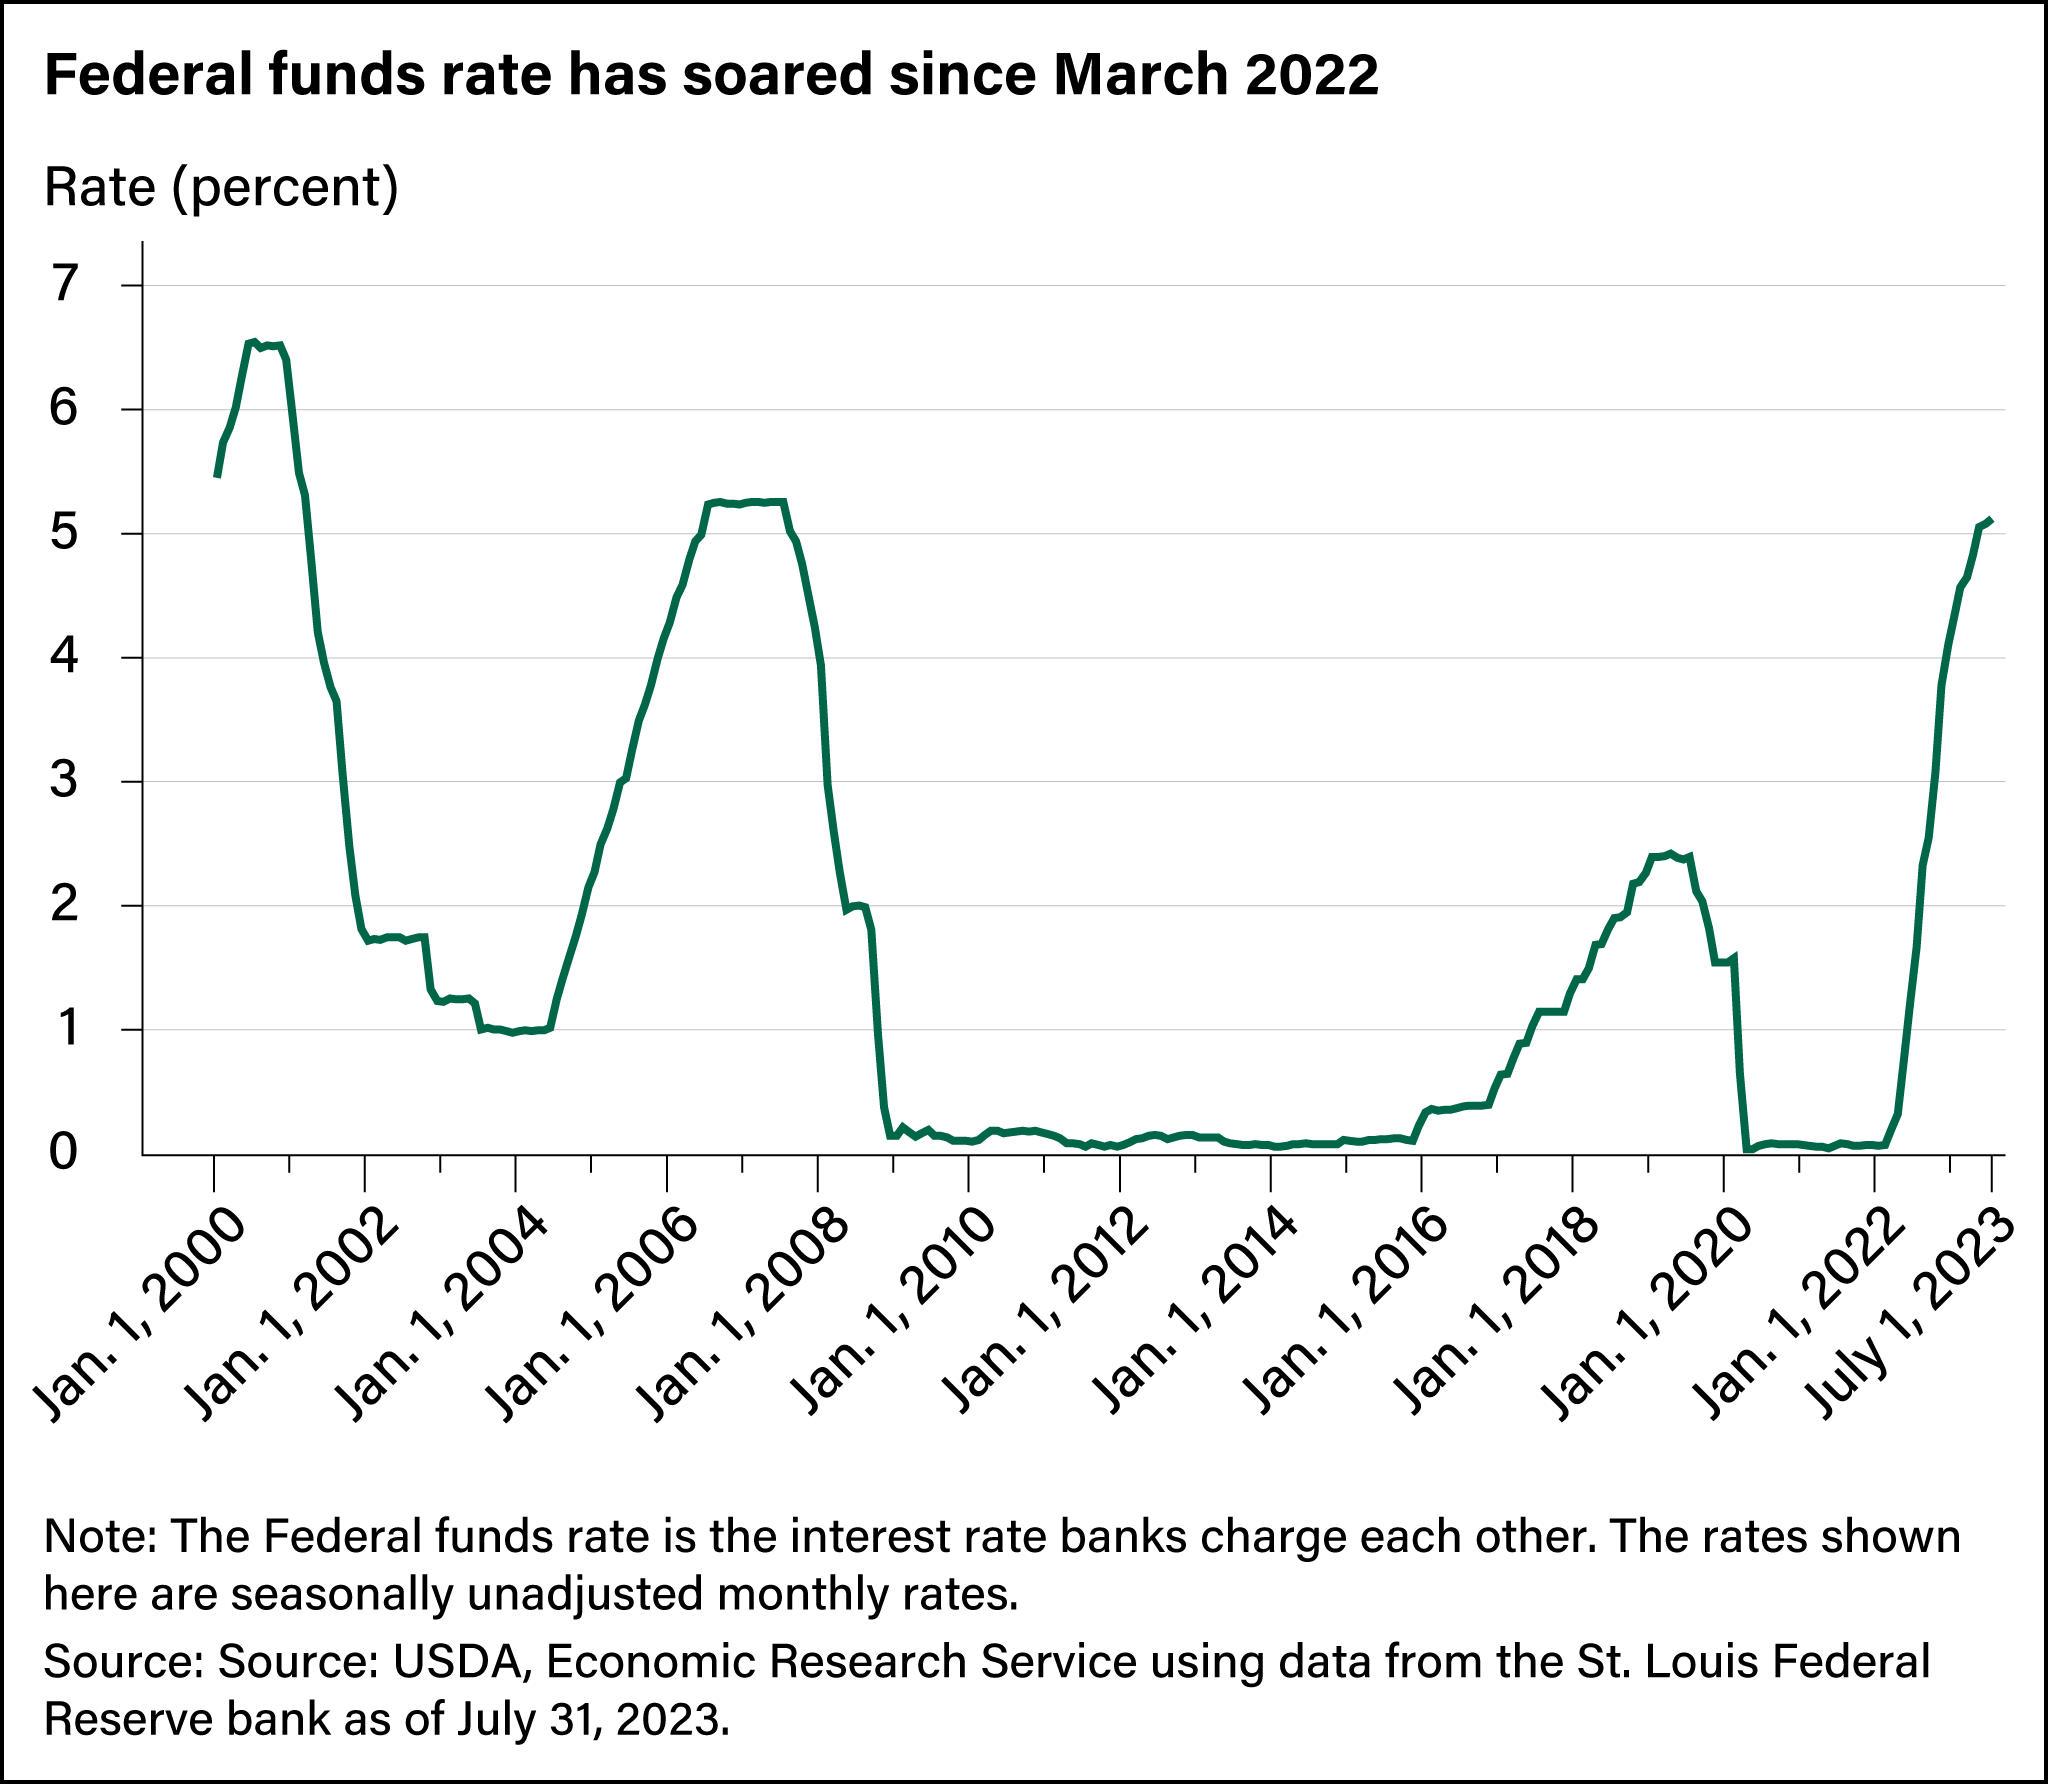
Federal Reserve Has Raised Its Target Rate Significantly Since March 2022
In 2021, prices of goods and services rose a total 7.5 percent, the largest increase in inflation in almost four decades, and stayed high in 2022 compared with recent years, according to the U.S. Department of Labor’s Bureau of Labor Statistics. To tame inflation, the Federal Reserve increased the short-term Federal funds rate 11 times since March 2022. The Federal funds rate is the interest rate banks charge each other for short-term lending. However, the short-term Federal funds rate also directly influences interest rates such as the prime rate that banks charge customers and indirectly influences longer-term rates such as those for mortgages and savings accounts. Federal Reserve Governors and bank presidents meet eight times a year as the Federal Open Market Committee (FOMC) to determine the Federal funds rate, known as their target rate. The FOMC last raised the Federal funds rate July 26, 2023, by 0.25 percent to a target range of 5.25 to 5.50 percent, the highest level in more than 22 years.
On March 1, 2020, at the onset of the pandemic-related shutdowns in the United States, the seasonally unadjusted Federal Funds Effective Rate was at 0.65 percent. On July 1, 2023, the rate was 5.12 percent, still lower than during the periods before the 2001 and 2007–09 recessions, when it was at 6.54 percent in July 2000 and 5.26 percent in July 2007.
What Do Liquidity and Solvency Measures Show?
Liquidity and solvency measures, in the form of ratios, provide insight into the effect of higher interest rates and higher values of debt and assets. ERS provides data on liquidity and solvency ratios in the Farm Income and Wealth Statistics data product. Liquidity ratios are ratios of liquid assets and liabilities and are a way to assess the farm sector’s ability to make scheduled financial payments. They can be early indicators of elevated stress. Solvency ratios compare the amount of debt relative to equity or assets invested in the farm sector.
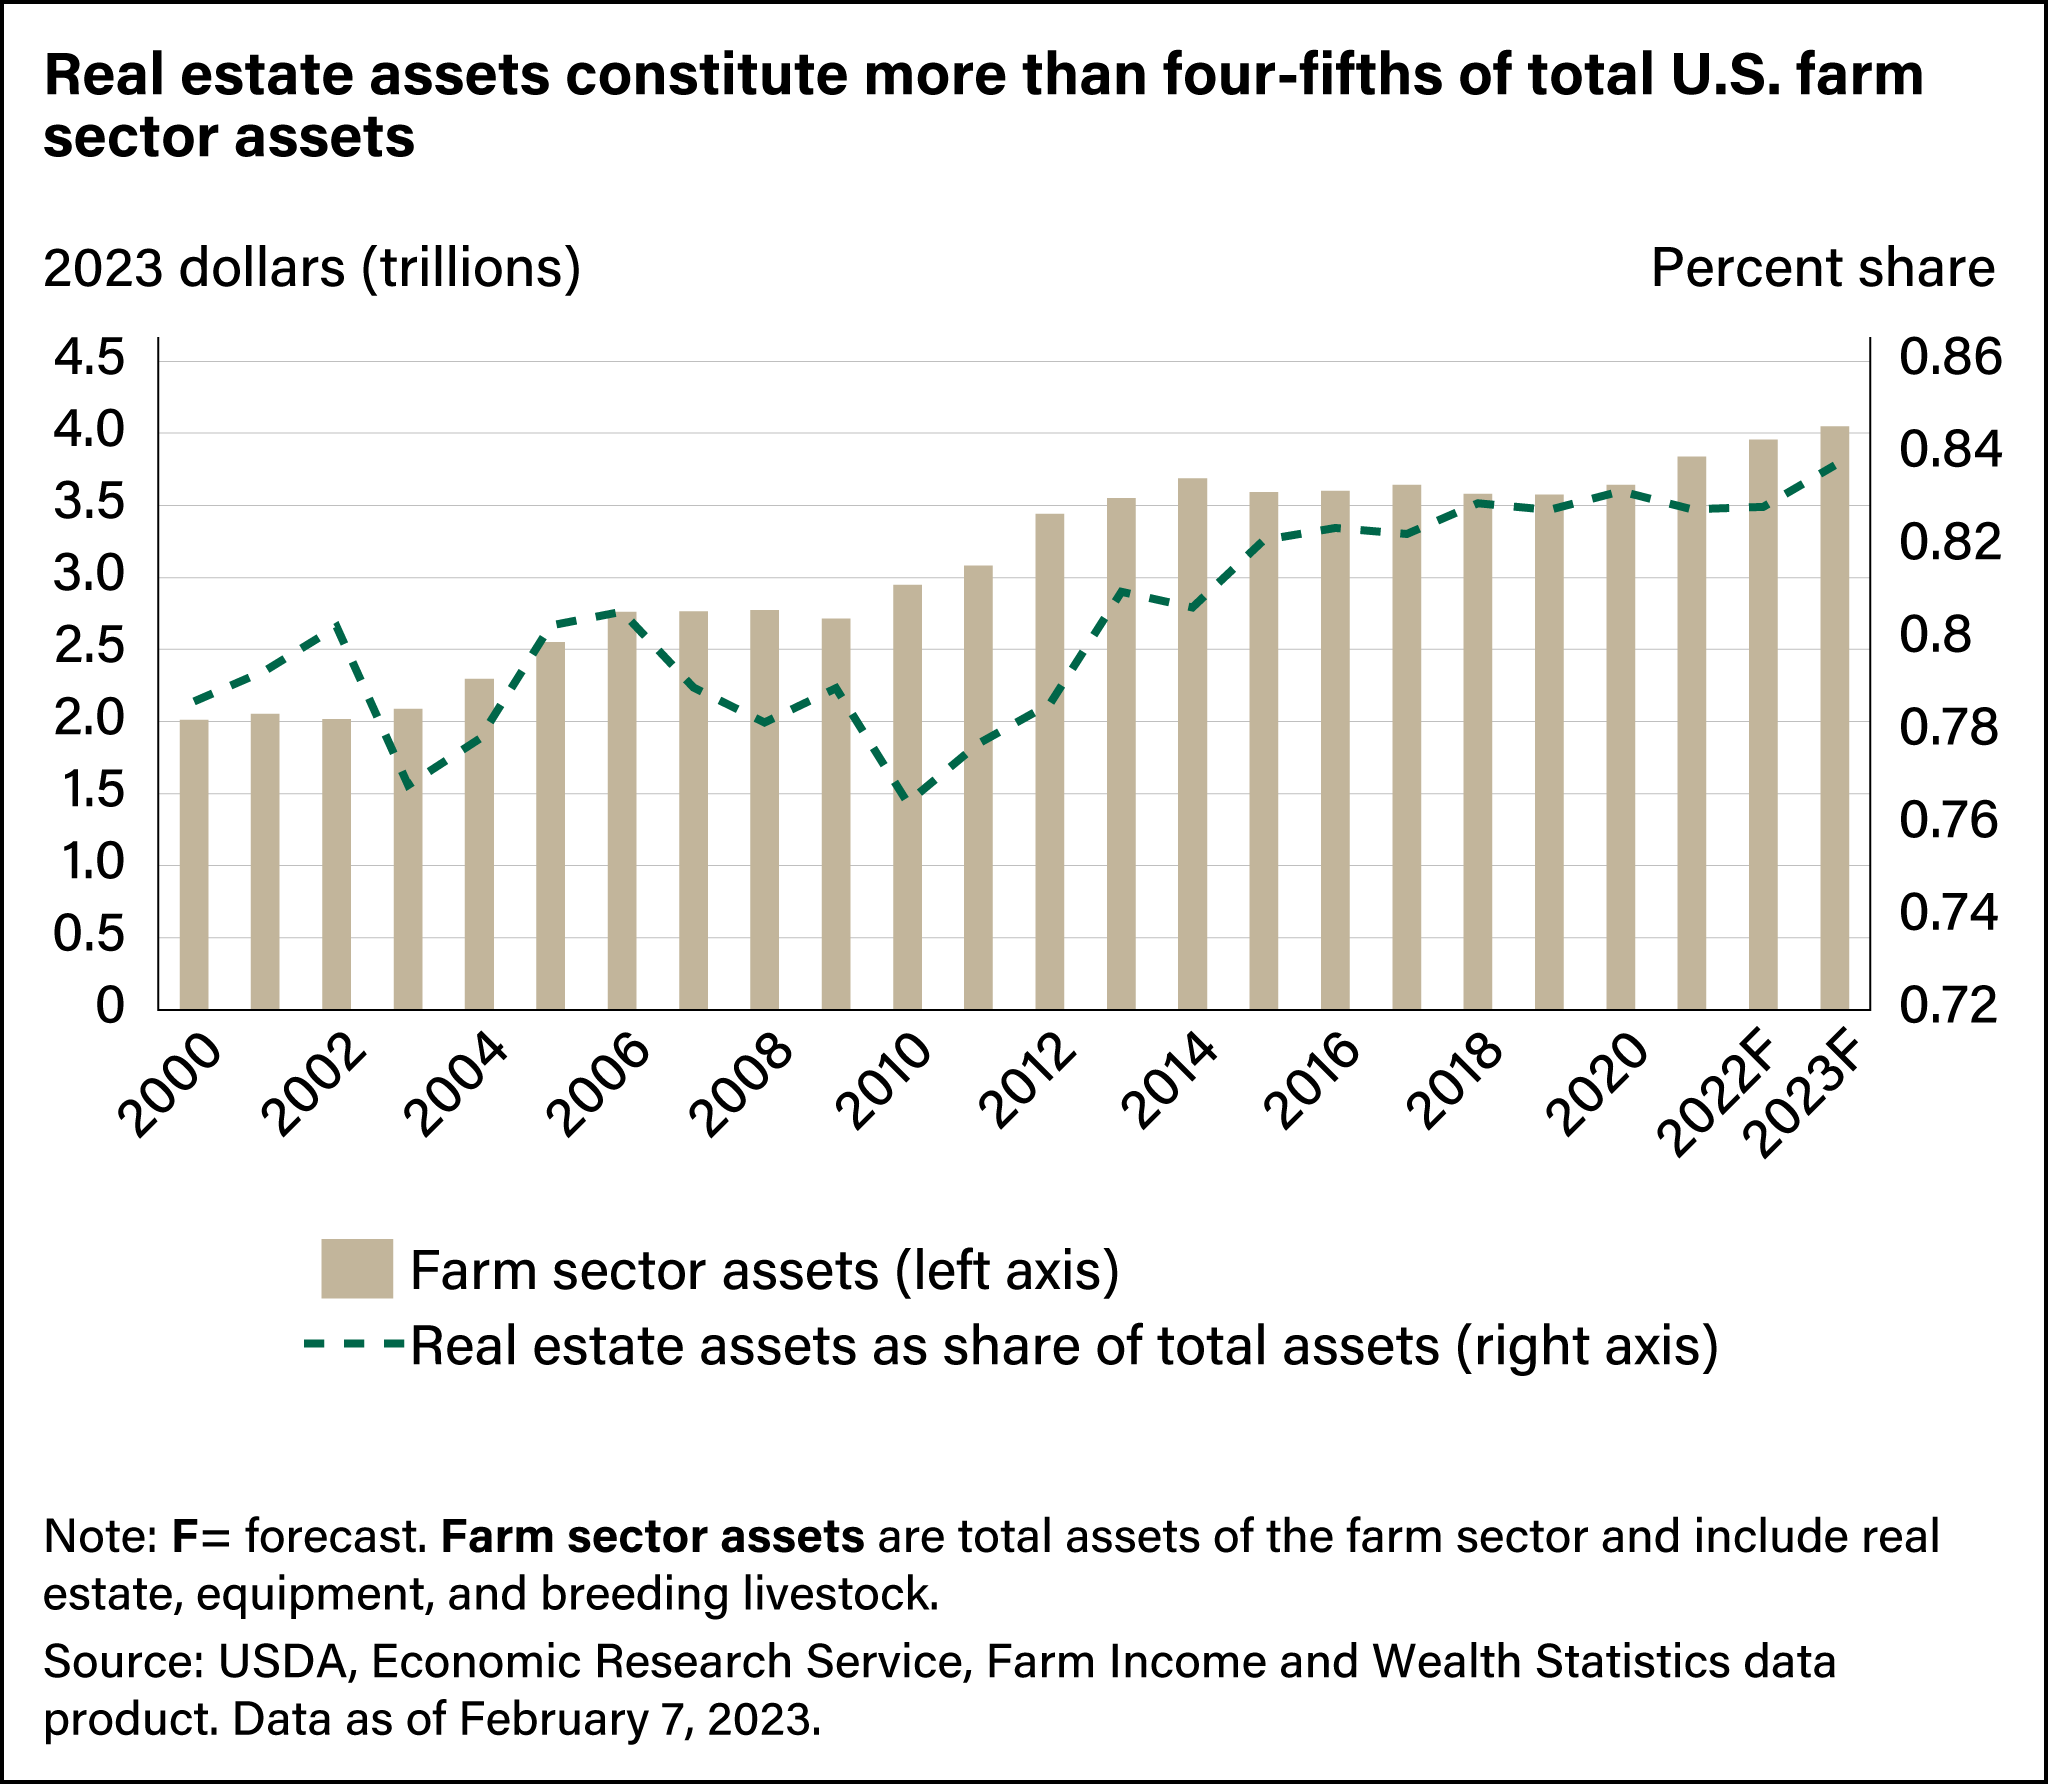
Calculating solvency and liquidity ratios requires information on asset and debt values. For 2023, ERS forecasts total farm sector assets to reach a historic high of more than $4 trillion. This would be more than double the 2000 levels, after adjusting for inflation. Real estate assets account for more than four-fifths of total farm sector assets, and their value is forecast to grow to $3.39 trillion in 2023, a 114-percent increase from $1.58 trillion in 2000.
Three of the most-used liquidity and solvency ratios are:
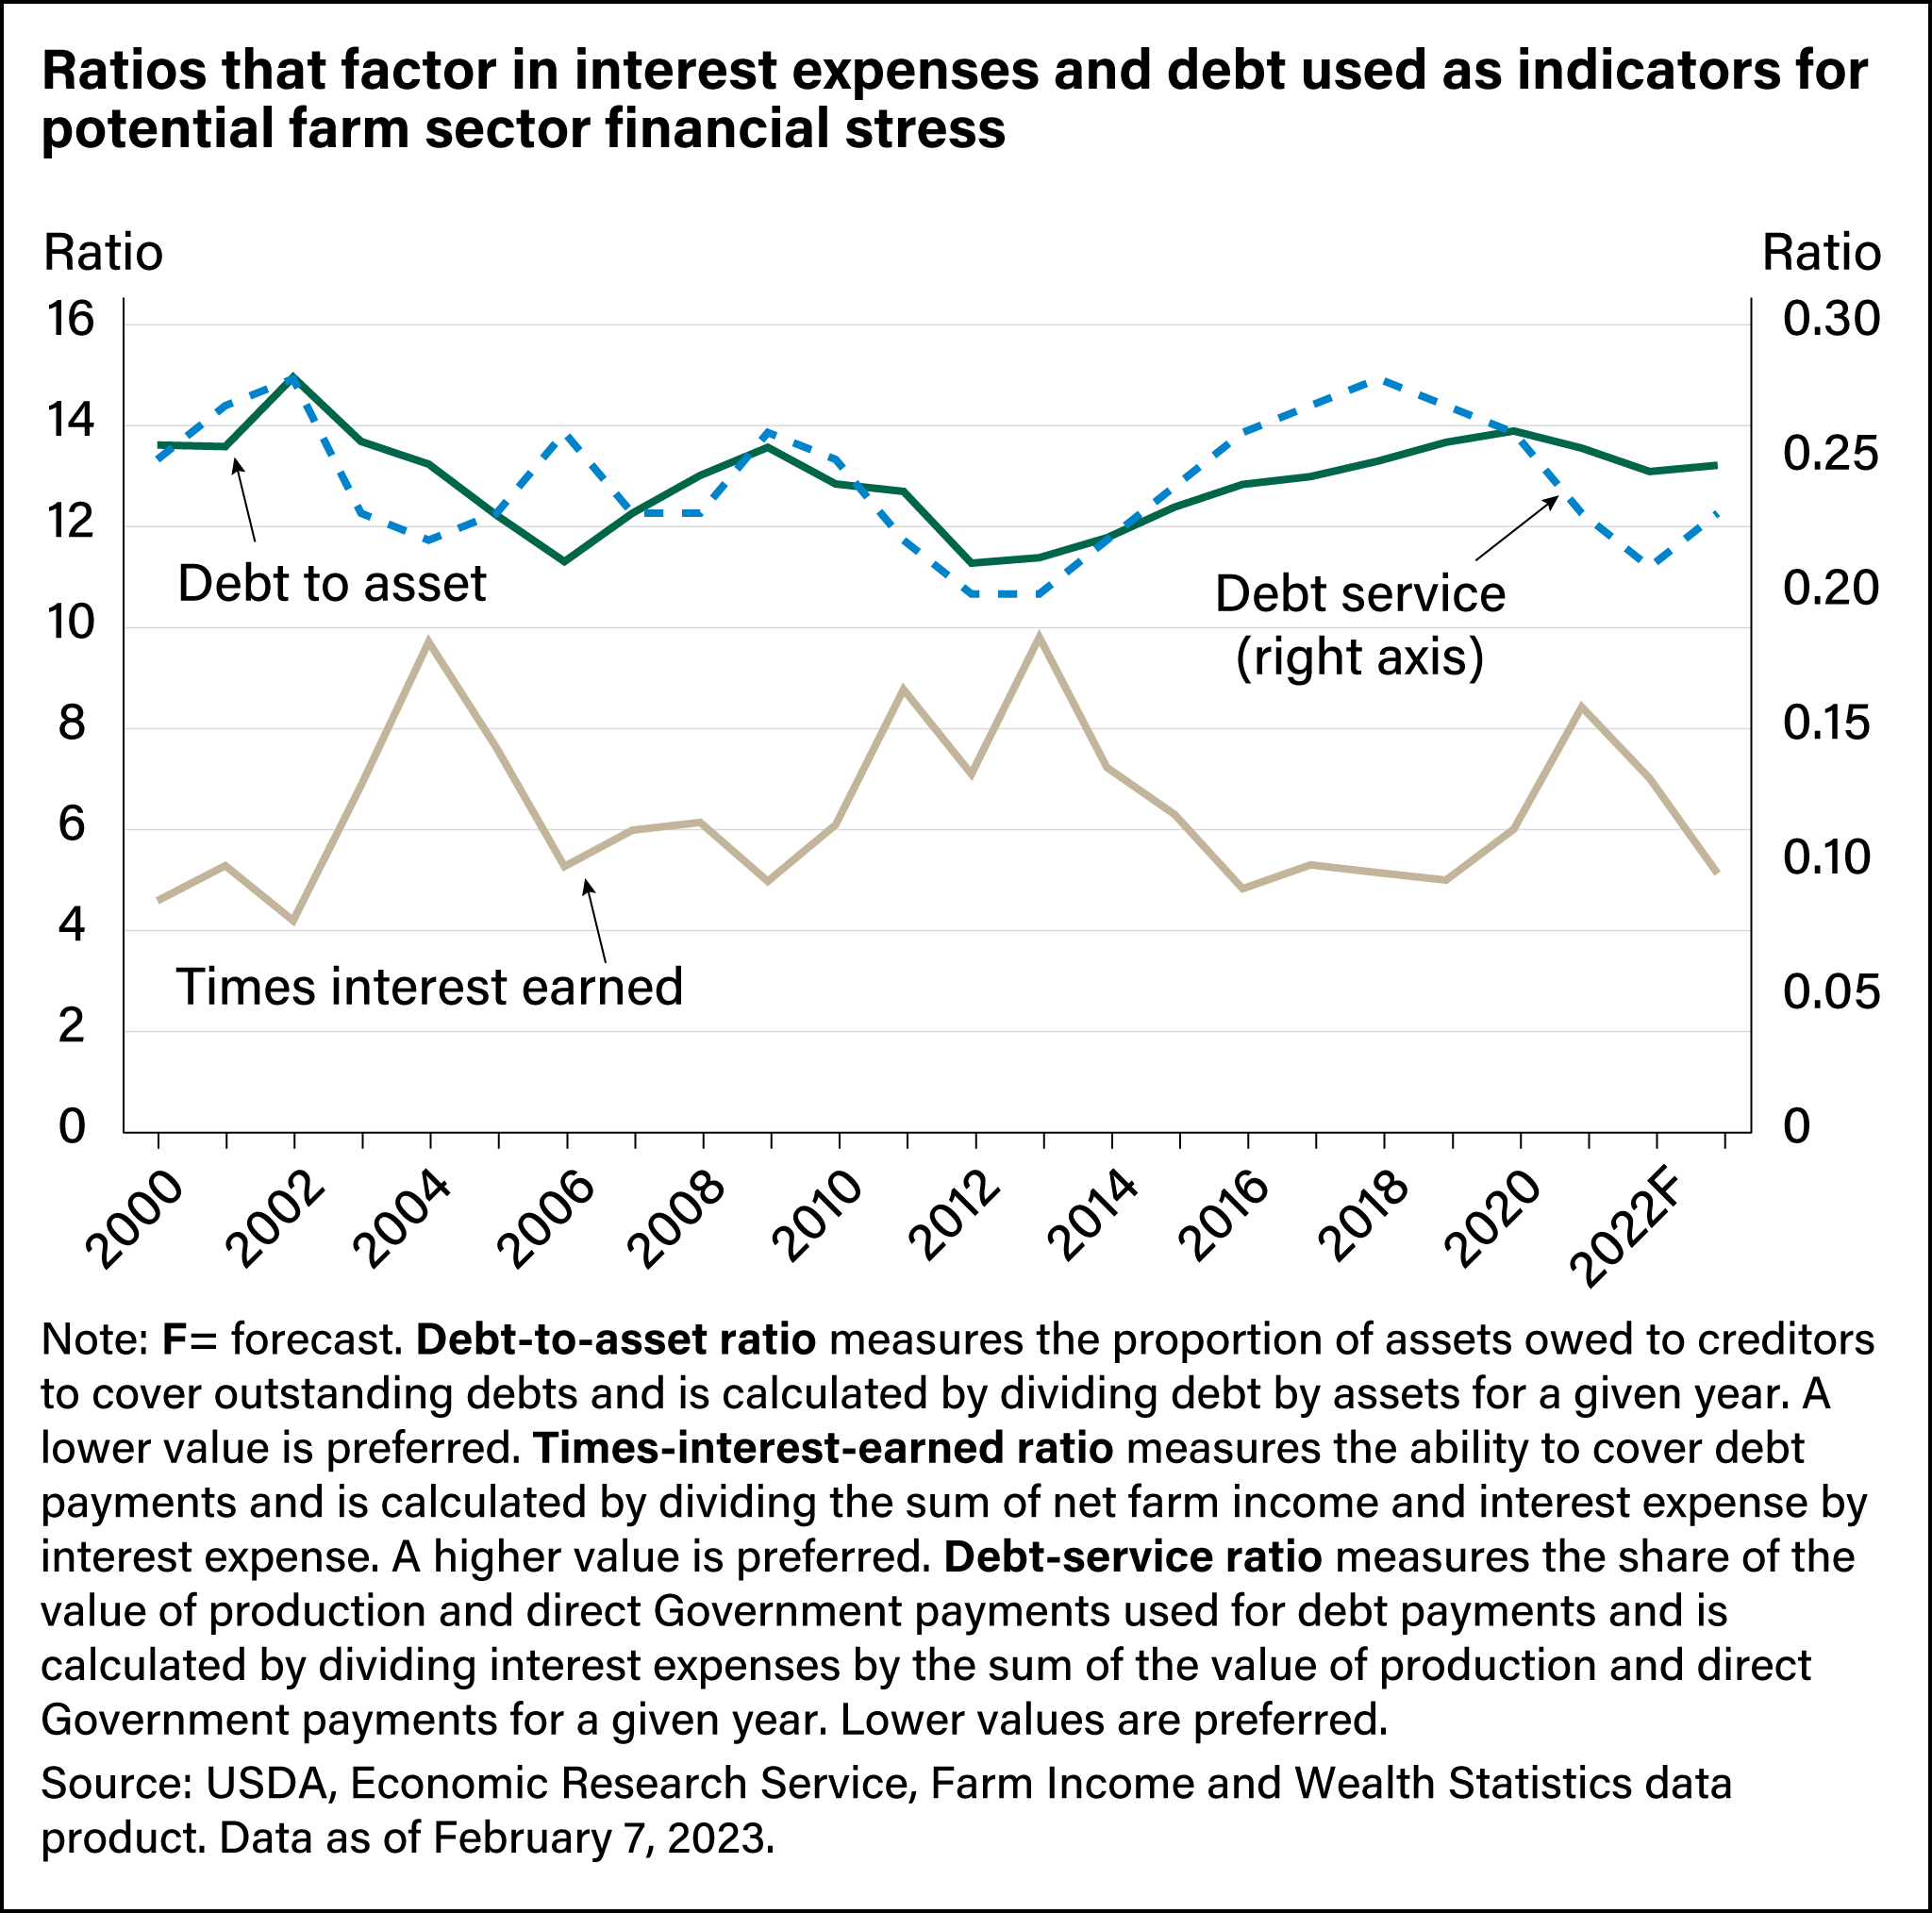
Debt-service ratio: a liquidity ratio that measures the share of production revenue plus direct Government payments used for debt payments. It is calculated by dividing the value of the principal payments and interest expenses by the sum of Government payments and value of production. Lower values indicate better financial position and performance. In 2000, the debt service ratio was 0.25; it is forecast at 0.23 for 2023, which is also lower than the 22-year average (2000 through 2021) of 0.24. This shows that even though interest rate payments are expected to increase, they remain near long-run benchmarks.
Times-interest-earned ratio: a liquidity ratio that measures the ability to cover debt payments, specifically interest payments. It is calculated by dividing the sum of net farm income and interest expense by interest expense. For this ratio, a higher value is preferred. The 2023 forecast value for this ratio is 5.13, which would be lower than the 2000 level and below recent years . The ratio is within the range seen from 2000 through 2020, but it is lower than the 22-year average (2000 through 2021) of 6.40, indicating greater financial stress in 2023 than the average.
Debt-to-asset ratio: a solvency ratio that measures the proportion of assets owed to creditors to cover outstanding debt obligations. This ratio is calculated by dividing debt by assets for a given year, and a lower value is preferred. The 2023 forecasted value of this ratio is 13.22, slightly lower than the 2000 level of 13.62 but higher than the 22-year average of 12.92. This suggests that, at least in recent years, increases in asset values mostly are offsetting increases in debt.
This article is drawn from:
- Farm Income and Wealth Statistics. (n.d.). U.S. Department of Agriculture, Economic Research Service.
- Federal funds effective rate. (2023). Board of Governors of the U.S. Federal Reserve System, Federal Reserve Bank of St. Louis, Federal Reserve Economic Data.
You may also like:
- Giri, A.K., Litkowski, C., Subedi, D. & McDonald, T.M. (2023, August 9). U.S. Farm Sector Financial Measures Show Little Variation From Prepandemic Expectations. Amber Waves, U.S. Department of Agriculture, Economic Research Service.
- Giri, A.K., Litkowski, C., Subedi, D. & McDonald, T.M. (2022). COVID-19 Working Paper: Farm Sector Financial Ratios: Pre-COVID Forecasts and Pandemic Performance for 2020. U.S. Department of Agriculture, Economic Research Service. AP-104.
- Whitt, C., Miller, N. & Olver, R. (2022). America’s Farms and Ranches at a Glance: 2022 Edition. U.S. Department of Agriculture, Economic Research Service. EIB-247.