

Financial Health Indicators for Family Farms Show a Mixed Picture During the 2020 Coronavirus (Covid-19) Pandemic
- by Christine Whitt, Jessica E. Todd and Andrew Keller
- 3/28/2022
USDA’s Economic Research Service (ERS) uses the annual Agricultural Resource Management Survey (ARMS) to report on the U.S. farm sector. In 2020, 98 percent of the 2,010,664 U.S. farms were family owned and operated, compared with 97 percent of the 2,172,843 farms in 2011. Family farms are any farm in which principal operators and their relatives (by blood or marriage) owned more than half the business’s assets. About 90 percent of U.S. farms were small family farms, meaning their gross cash farm income (GCFI) was less than $350,000 per year.
The percentage of family farms in the United States was about the same in 2020 as it was in 2011 when ERS developed the farm classification, or typology, currently in use. Since farm size categories are measured in current dollars, the potential effects of inflation on the reported distribution are not considered in this analysis.
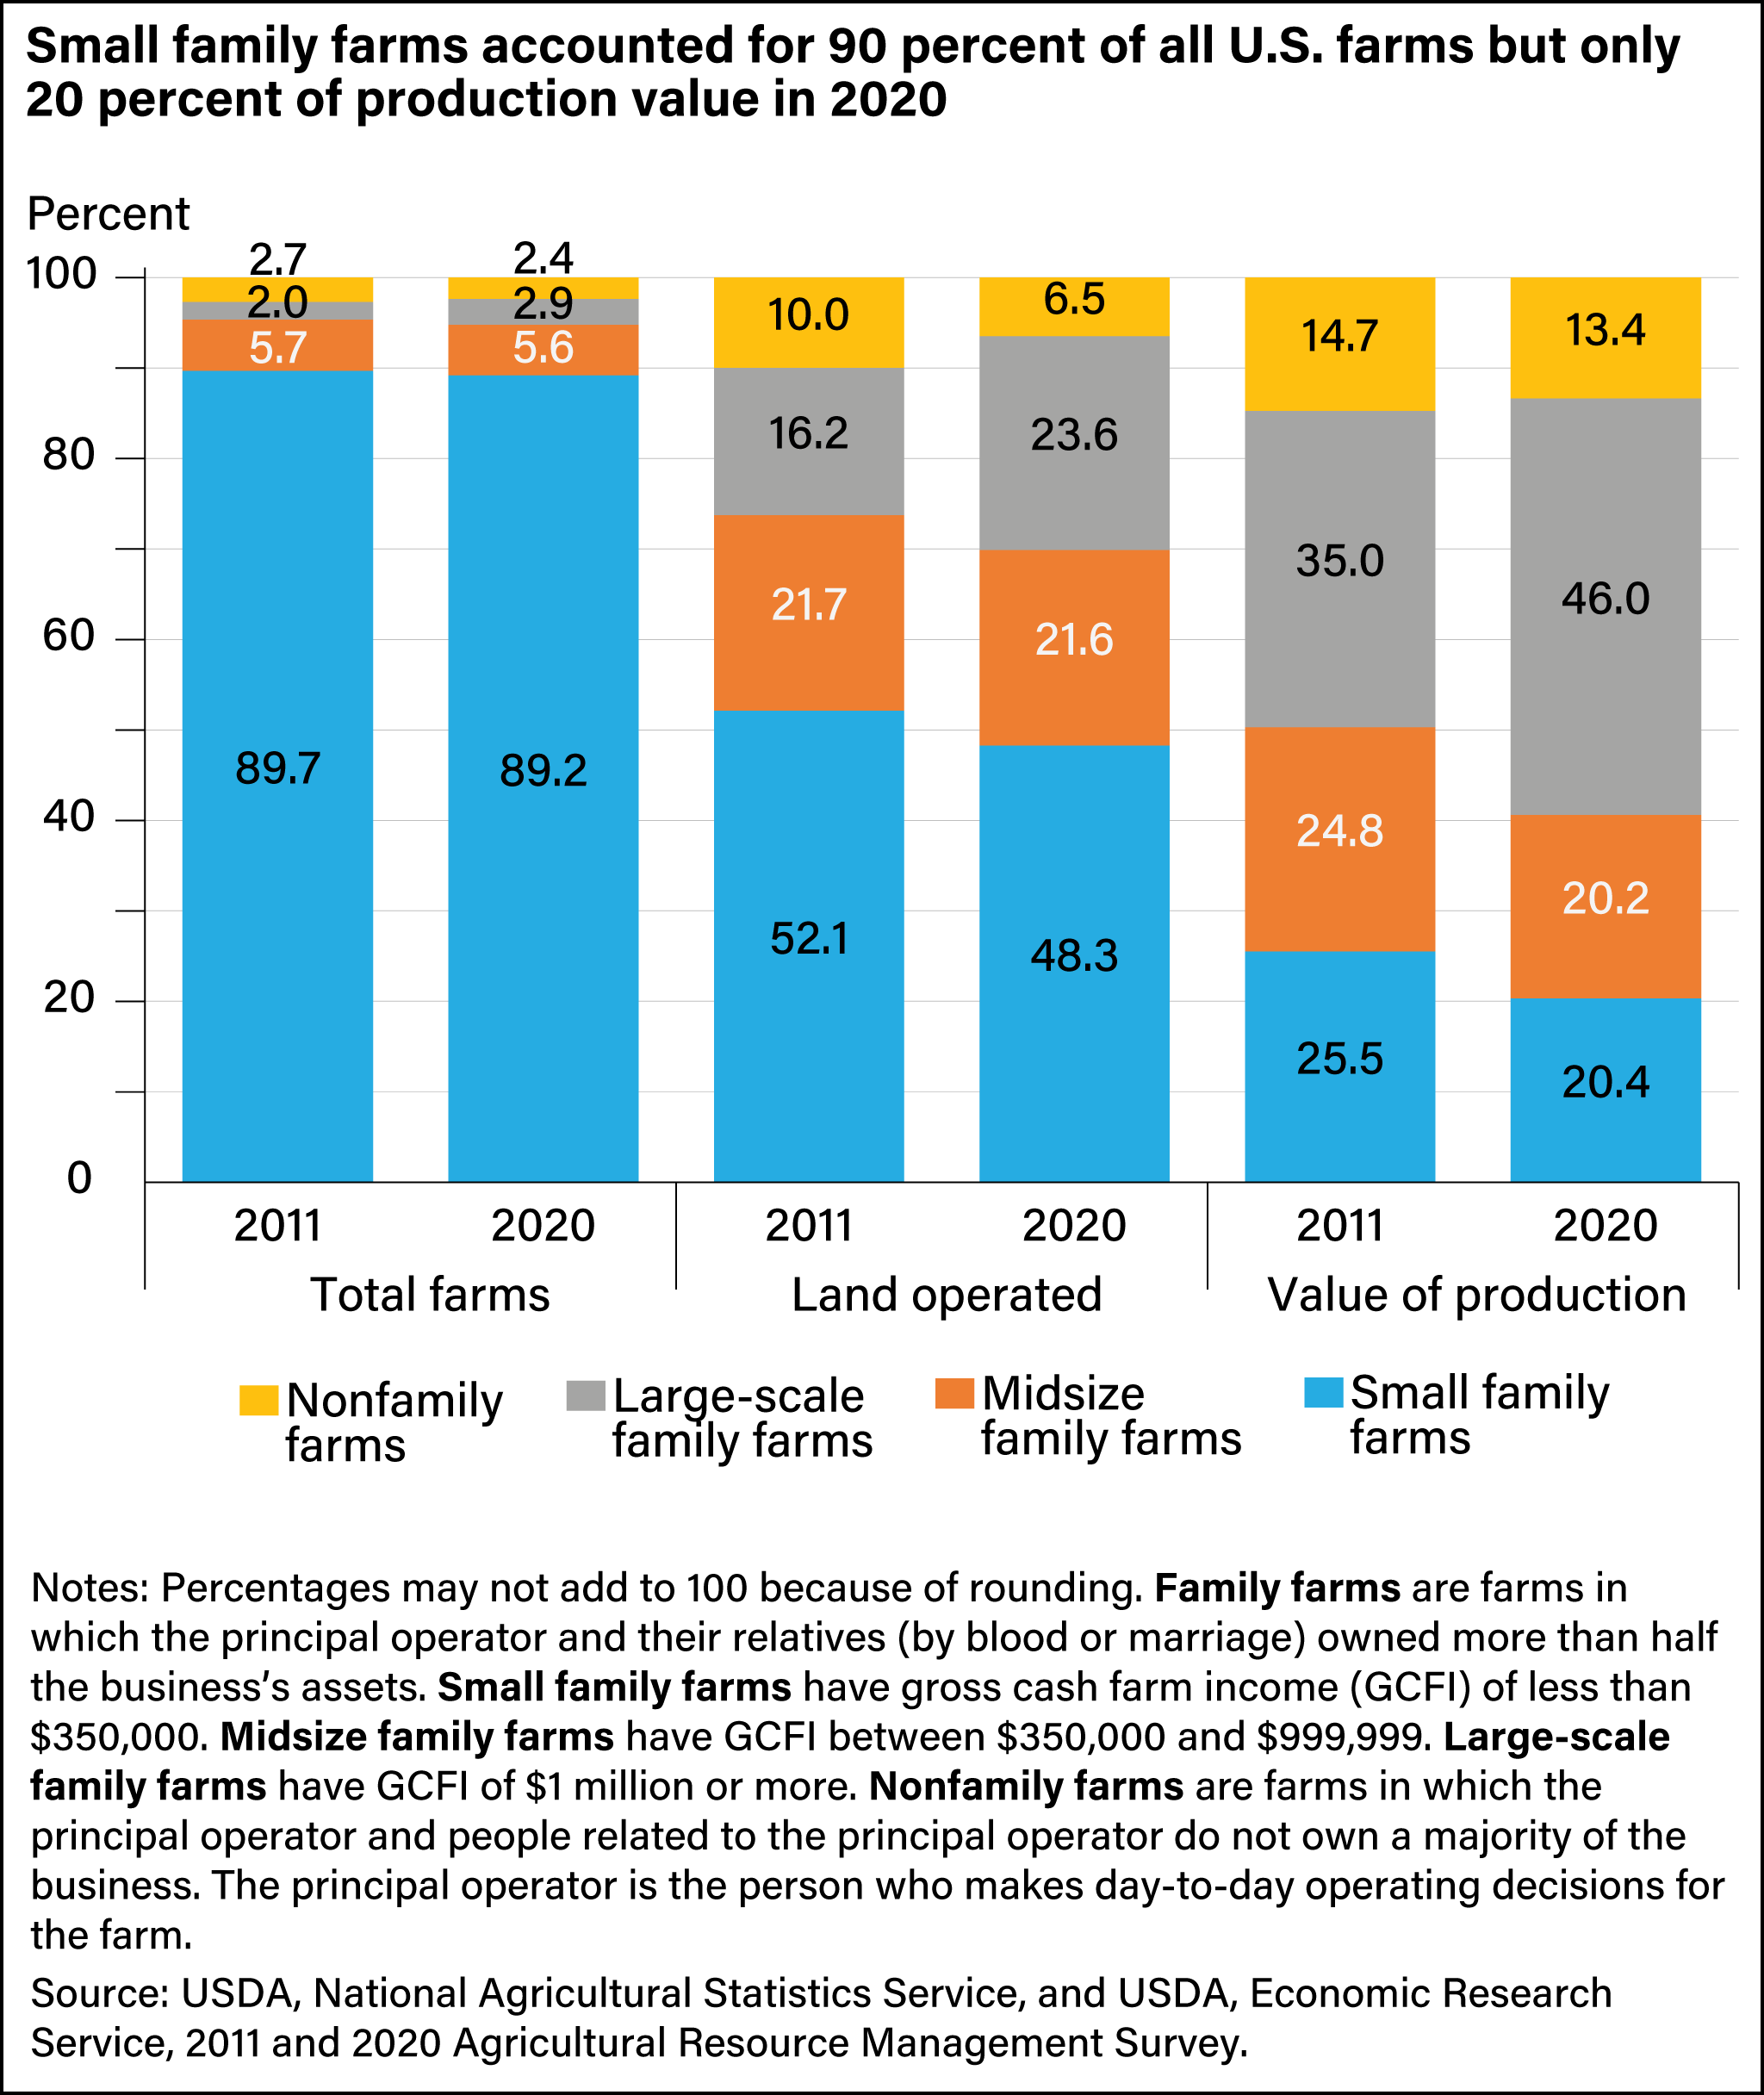
In 2020, small family farms operated 48 percent of U.S. farmland, down from 52 percent in 2011. However, they accounted for only 20 percent of production by value, a decline from 26 percent in 2011. Conversely, large-scale family farms, with $1 million or more in GCFI, experienced an increase in the total value of production to 46 percent in 2020 from 35 percent in 2011.
Large-scale family farms also accounted for an increased share of land operated, up to 24 percent in 2020 from 16 percent in 2011. The large-scale classification includes “large” farms making $1 million or more in GCFI and “very large” farms with a GCFI of more than $5 million. Because the GCFI farm size threshold is not adjusted for inflation, some of the shift in the farm size shares from 2011 can be attributed in part to increases in farm commodity prices and resulting increases in farm sales. All else being equal, higher prices and sales in 2020 reduced the number of farms with a GCFI less than $350,000 (the cut-off for small farms), therefore increasing the share of large-scale farms.
Operating profit margin—the share of gross income that is profit—is one way to gauge a farm’s financial performance. Many small family farms do not earn a profit and even lose money farming (42 percent in 2020 and 39 percent in 2011). In contrast, most midsize and large-scale family farms earned a profit. In 2020, 83 percent of midsize family farms earned a profit compared with 82 percent in 2011. For the large-scale family farm category, 88 percent earned a profit in 2020, compared with 85 percent in 2011. However, most small family farms earn gross income from farming (94 percent in 2020 and 96 percent in 2011), and nearly 100 percent of midsize and large-scale family farms earned gross income from farming in 2020 and 2011.
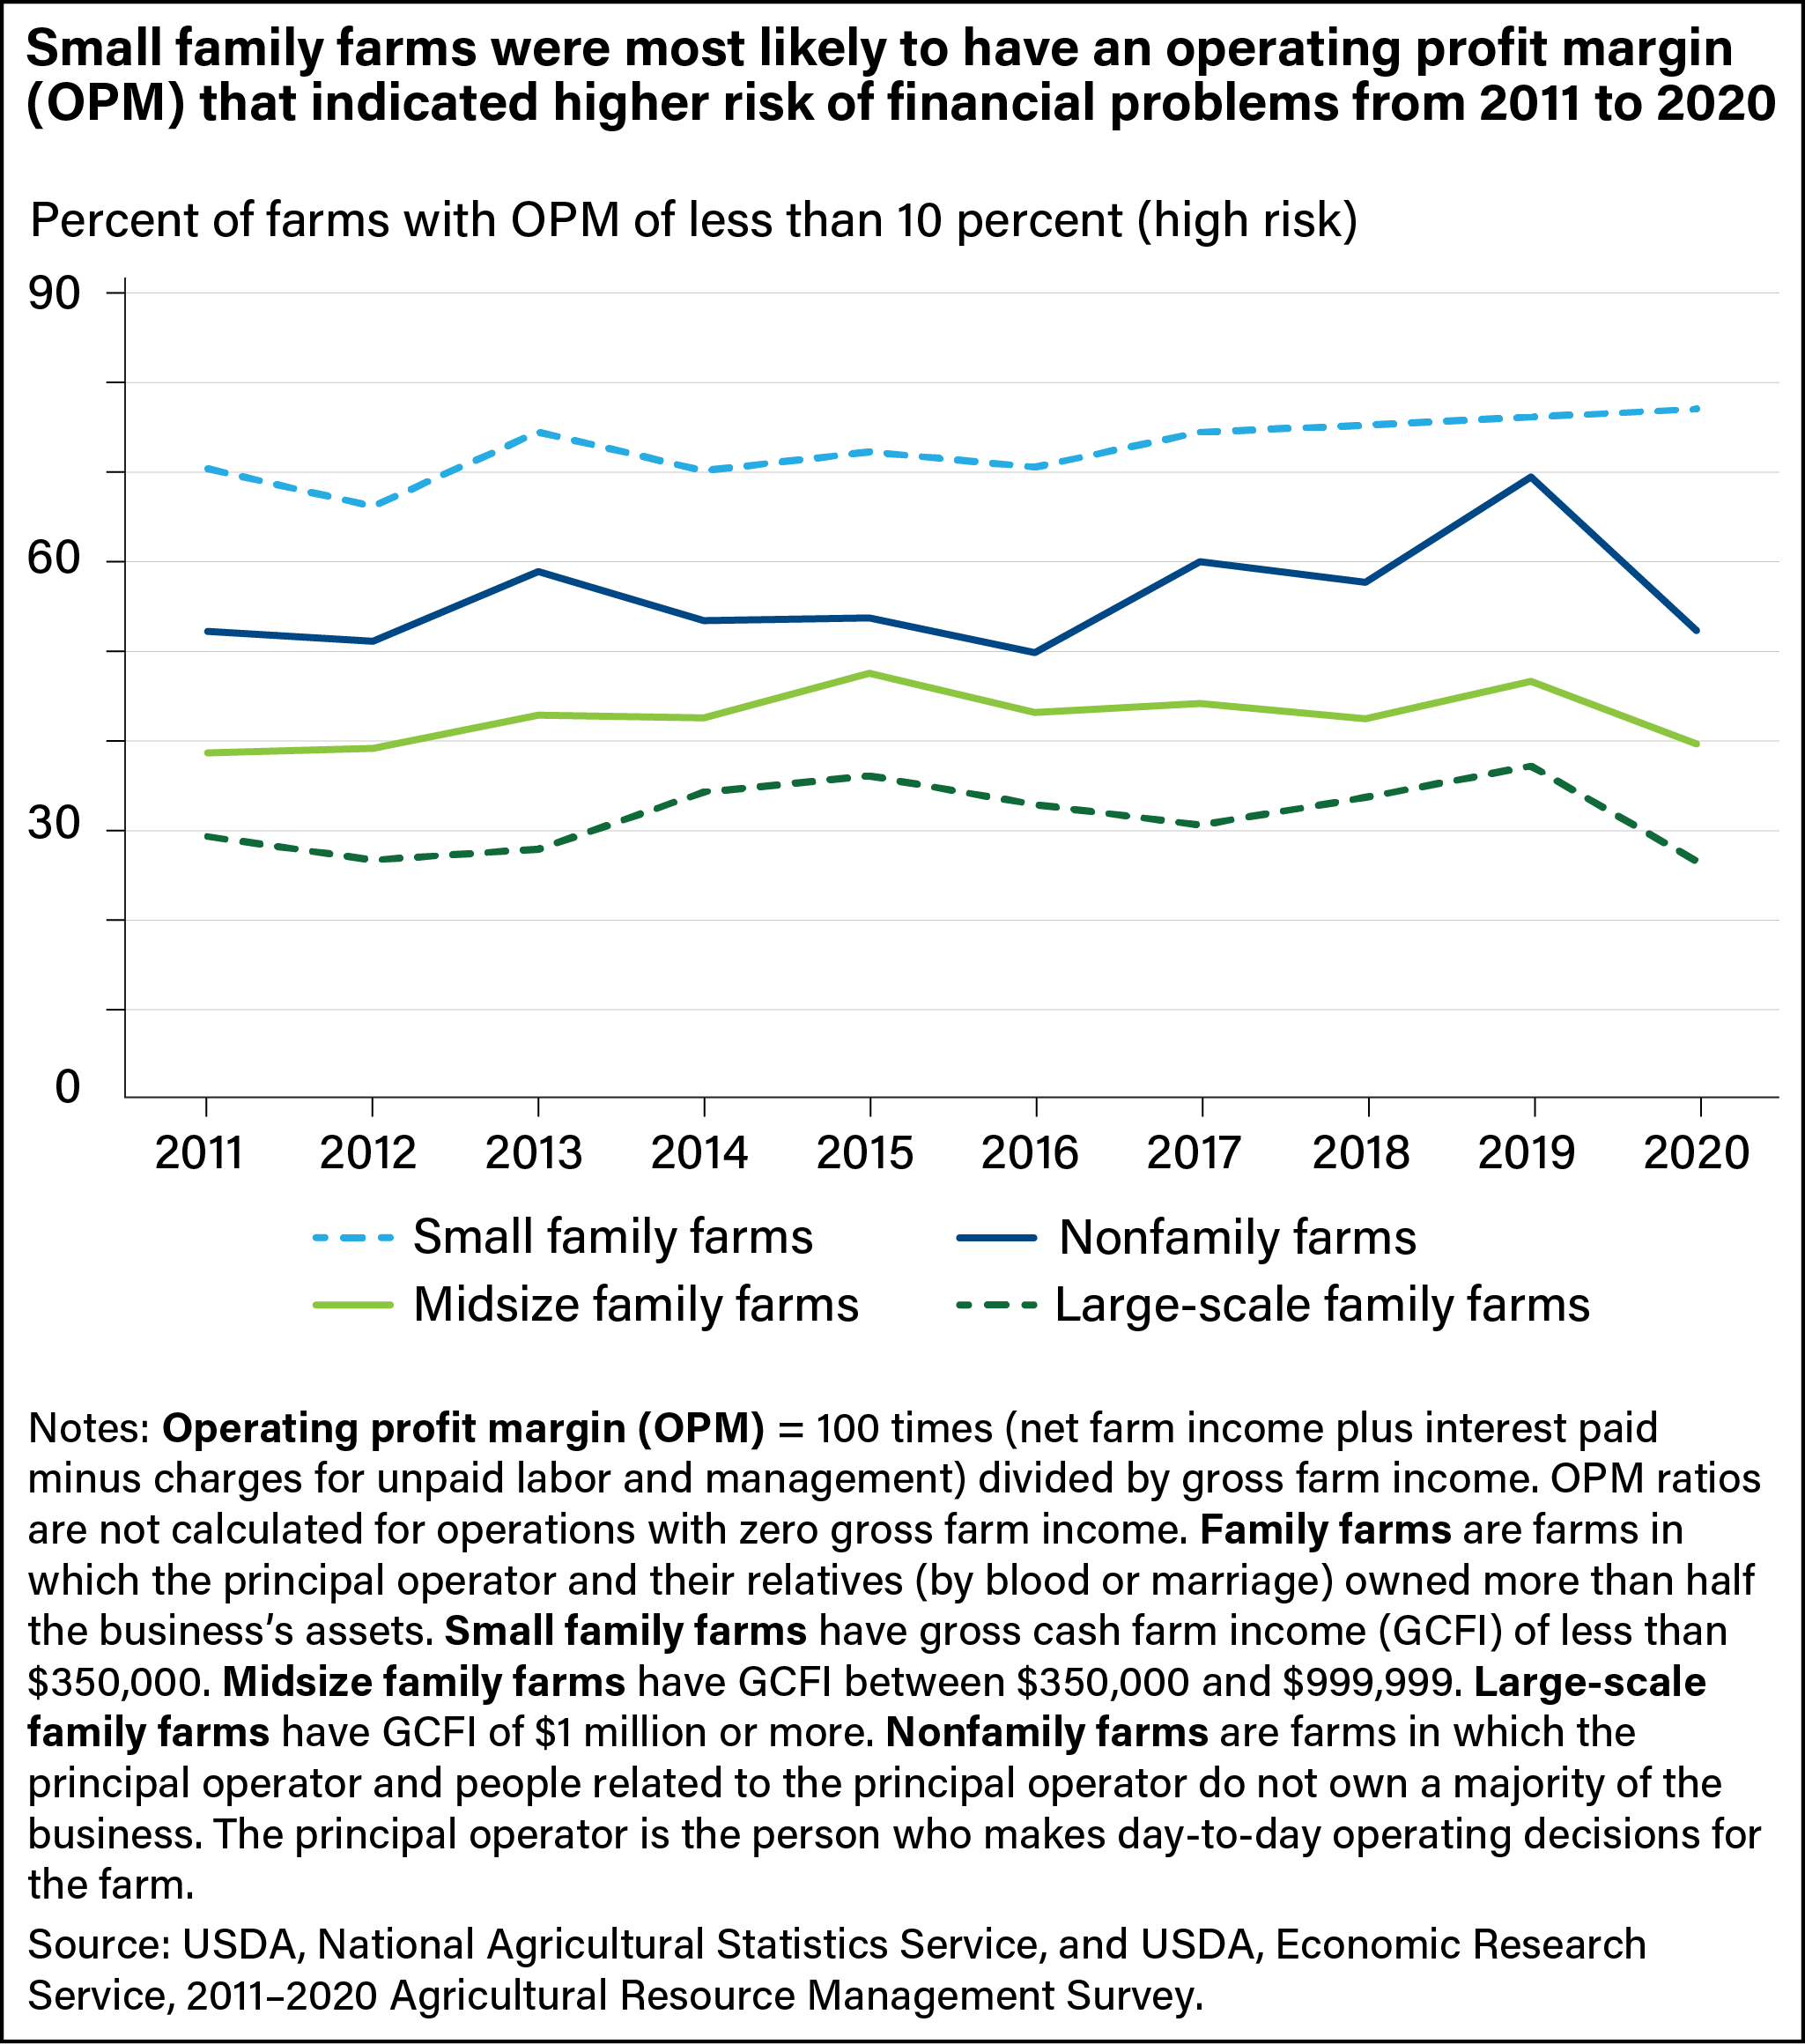
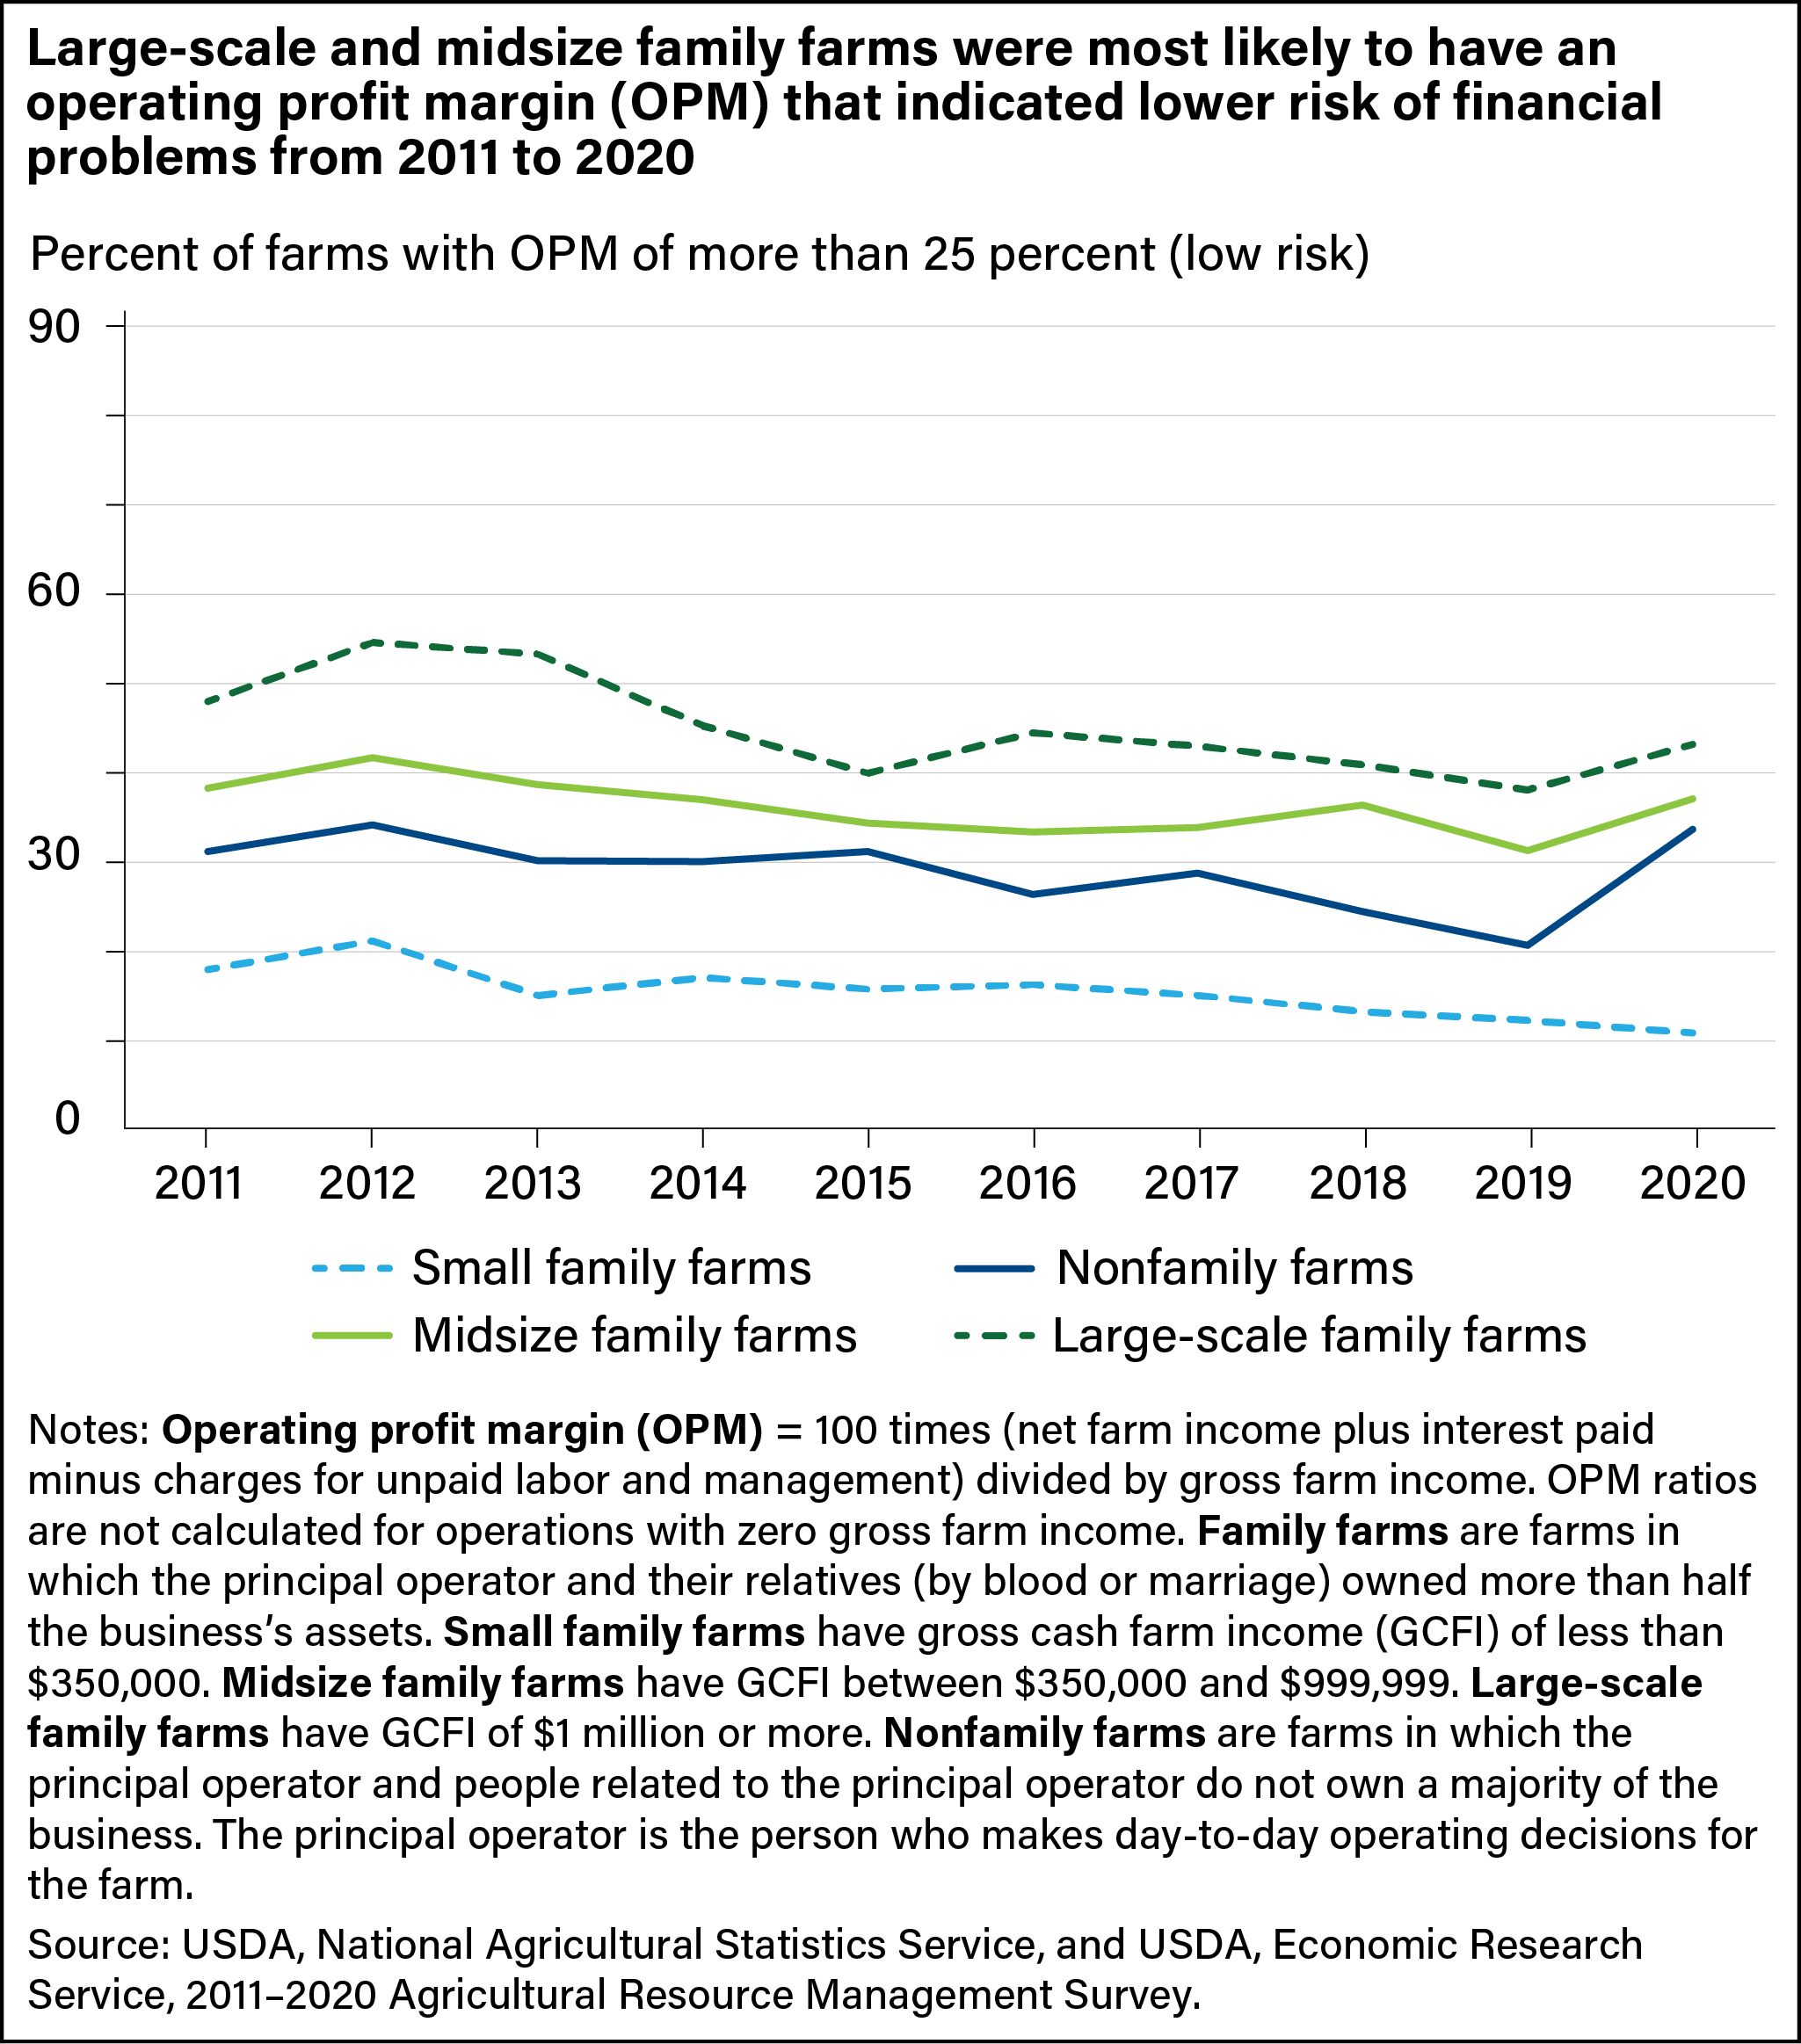
An operating profit margin of less than 10 percent indicates a higher risk of financial problems, and margins of 25 percent or greater are considered low risk. During the past decade, most small family farms had an operating profit margin of less than 10 percent, while most midsize (GCFI between $350,000 and $999,999) and large-scale family farms operated with lower financial risk. In 2020, despite uncertainty from the pandemic, the share of midsize and large-scale family farms and nonfamily farms with a low-risk margin increased compared with 2019. That is not the case for most small family farms, many of which have operators who do not consider farming their primary occupation and receive little or no income from farming. Instead, these small farms receive much of their income from off-farm sources, which are not reflected in the operating profit margin.
Sales Through Direct Sales Marketing Channels Increased in 2020
Marketing through direct sales is a diversification strategy for some farms, particularly those with a GCFI of less than $350,000. A small share of all farms market commodities through direct sales marketing channels, and the value of production sold through these channels represents a small, but increasing, share of production since 2016. Some notable shifts in the use of these marketing channels occurred between 2019 and 2020 as a result of the pandemic.
Direct sales are the sales of commodities produced, raised, or grown on the farm and sold in different ways:
- Directly to the consumer, such as at farmers markets or through farm stores and community-supported agriculture (CSA) arrangements.
- To intermediary supply chains that subsequently sell directly to individuals or to institutions, such as schools and hospitals. Intermediate supply chains include retail outlets and regional distributors.
Christmas trees and flowers, nursery products, craft items, and processed products such as jellies, sausages, and hams are excluded from the analysis of direct sales of commodities, as are commodities produced under production contracts because the farmer does not own the commodity.
The 2020 ARMS included questions aimed at gauging the effect of the Coronavirus (COVID-19) pandemic and resulting closures and restricted operations along the agricultural supply chain on farms participating in direct sales. The share of farm operations participating in direct sales fell from 8 percent in 2019 to 7 percent in 2020. However, farmers sold almost $10.7 billion in commodities through direct marketing channels in 2020, a nearly $2.8 billion (35 percent) increase from the value reported in the 2019 ARMS. Direct sales to retail outlets (restaurants and grocery stores) made up the largest share of direct sales in 2020—42 percent—and rose nearly $500 million from 2019. However, sales to institutions declined 86 percent in 2020 compared with 2019 as the pandemic led to closures or other restrictions.
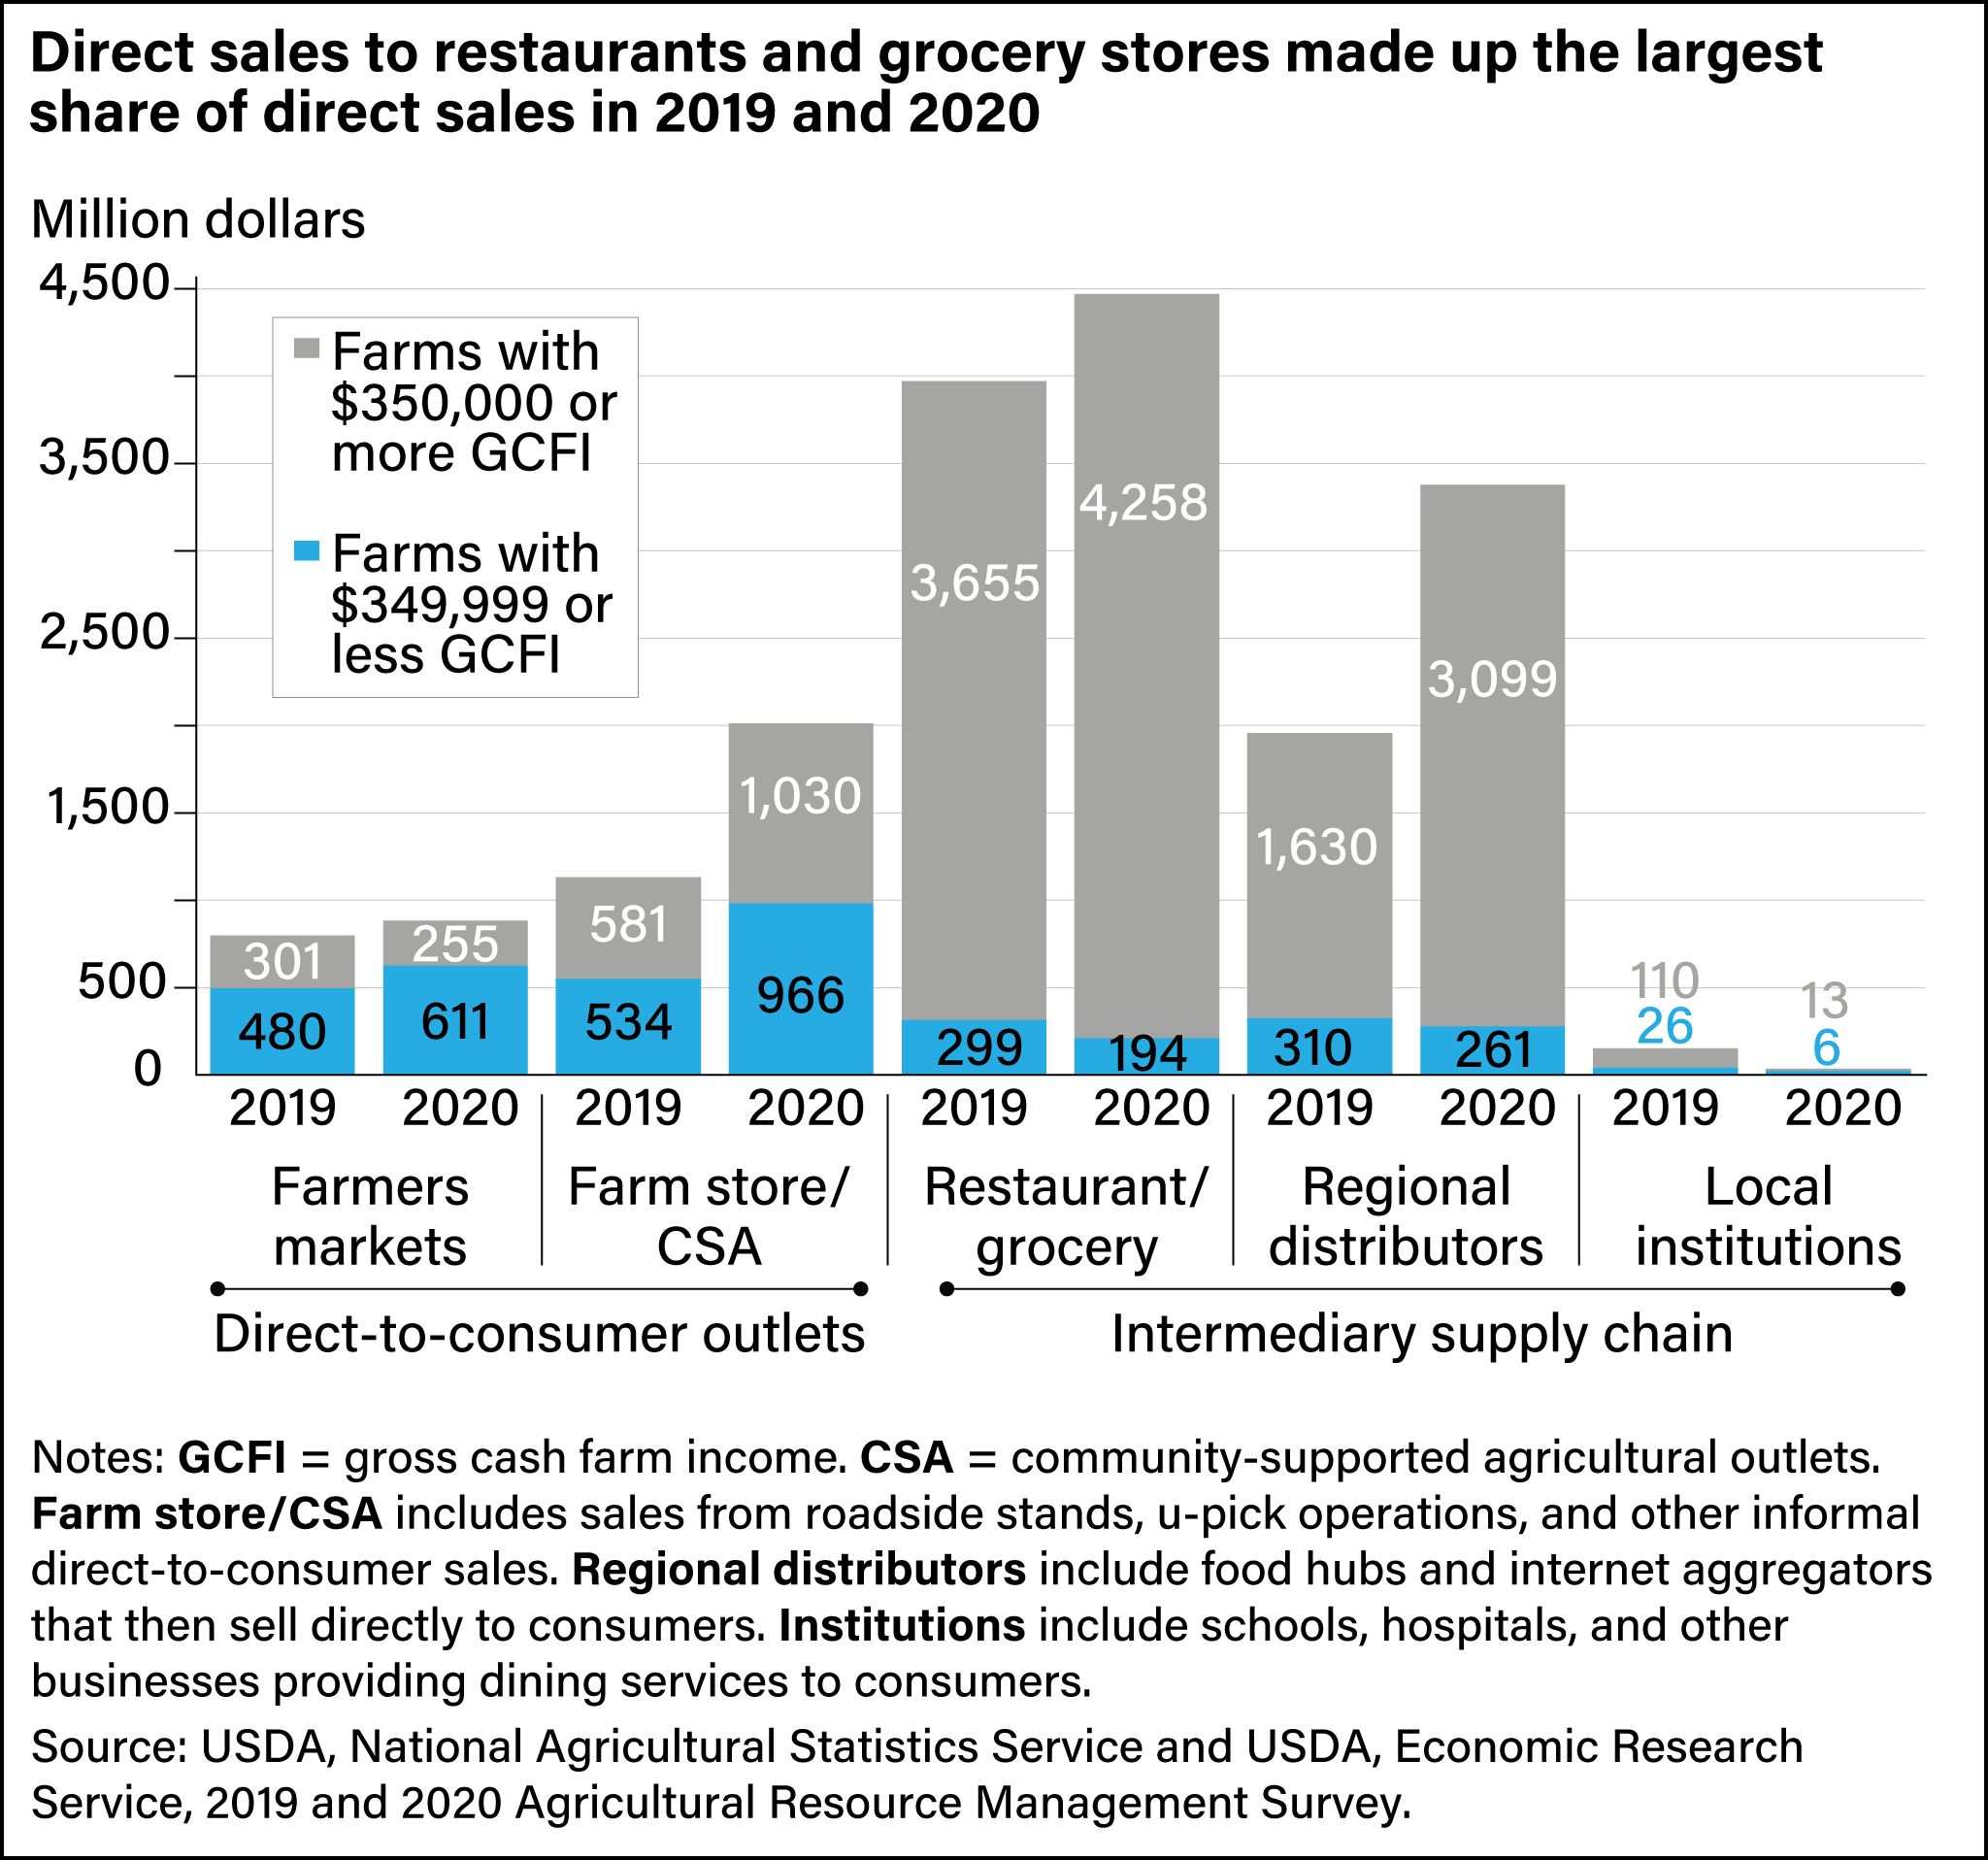
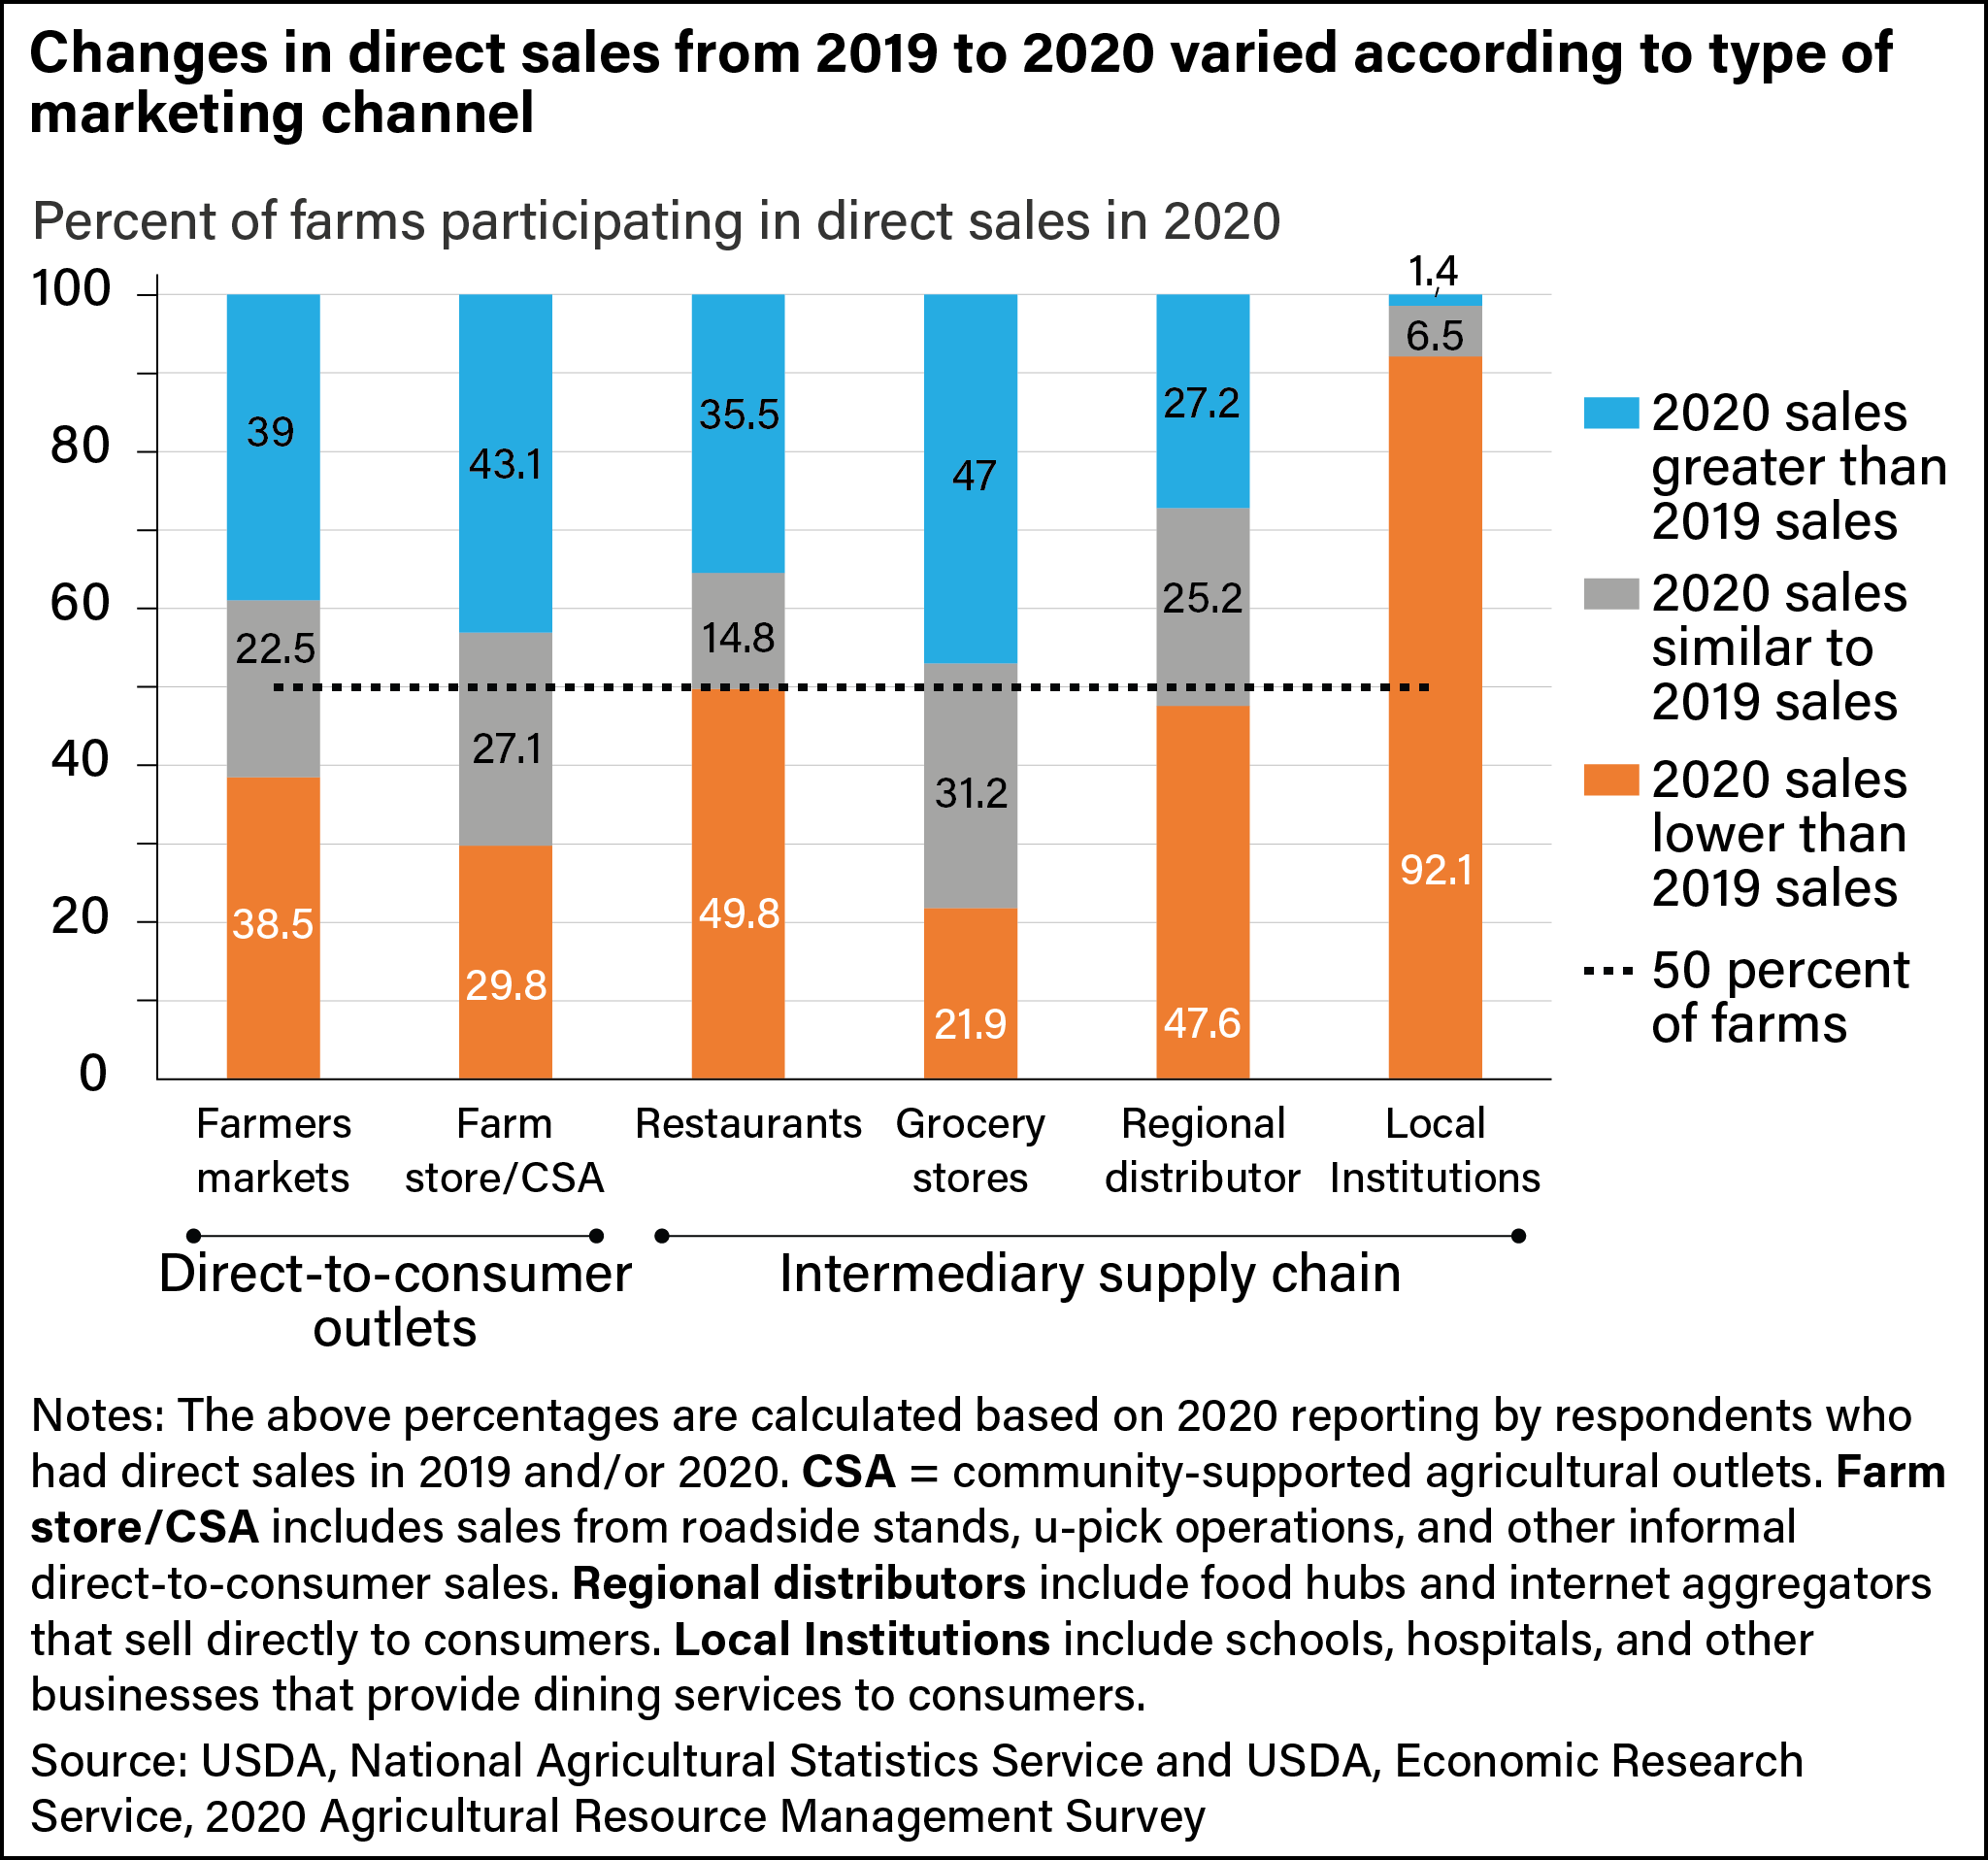
With the exception of sales to local institutions, total direct sales and the value across marketing channels increased from 2019 to 2020. However, not all farms experienced increases in direct sales in all marketing channels. A greater percentage of farms reported a decline in sales to farmers markets, restaurants, and regional distributors between 2019 and 2020 than the percent of farms that reported increased sales to those outlets. On the other hand, a larger share of farms reported higher sales through farm stores, CSAs, and grocery stores between 2019 and 2020 than the percent of farms that reported lower sales through those outlets.
Based on livestock and crop cash receipt data from ERS’s Farm Income and Wealth Statistics, markets for crop and livestock commodities encountered different challenges in 2020 because of the pandemic. Similarly, changes in sales of crop and livestock commodities across direct sales marketing channels differed. In 2020, the number of operations that sold only crops through direct sales declined by 9 percent to 71,729 farms, and the total value of direct sales for these operations fell 6 percent (from $6.7 billion to $6.3 billion). However, the total value sold through farm stores and CSAs by crop-only direct sales operations increased, as did their total sales to regional distributors. From 2019 to 2020, the number of livestock-only direct sales operations increased 10 percent (from 69,468 to 76,335) and those selling both crops and livestock through direct sales rose 7 percent (from 14,693 to 15,787). Although the number of direct sales operations selling only livestock increased, their total value of direct sales remained relatively flat. Operations that sold both crop and livestock commodities through direct sales channels reported an almost 800-percent increase in their total direct sales (from $96 million to $840 million). The increase was across all direct sales marketing channels.
This article is drawn from:
- Whitt, C., Todd, J.E. & Keller, A. (2021). America's Diverse Family Farms: 2021 Edition. U.S. Department of Agriculture, Economic Research Service. EIB-231.
You may also like:
- ARMS Farm Financial and Crop Production Practices. (n.d.). U.S. Department of Agriculture, Economic Research Service.
- Farm Structure and Organization. (n.d.). U.S. Department of Agriculture, Economic Research Service.
- Farm Household Well-being. (n.d.). U.S. Department of Agriculture, Economic Research Service.
- Dubman, R., Key, N., Law, J., Litkowski, C., Mandalay, O., Subedi, D., Todd, J.E. & Whitt, C. (2021). Agricultural Income and Finance Situation and Outlook: 2021 Edition. U.S. Department of Agriculture, Economic Research Service. EIB-228.
- Prager, D., Tulman, S. & Durst, R. (2018). Economic Returns to Farming for U.S. Farm Households. U.S. Department of Agriculture, Economic Research Service. ERR-254.
- COVID-19 Economic Implications for Agriculture, Food, and Rural America. (n.d.). USDA, Economic Research Service.