
World Agricultural Output Growth Continues to Slow, Reaching Lowest Rate in Six Decades
- by Stephen Morgan, Keith Fuglie and Jeremy Jelliffe
- 12/5/2022
Highlights
- Data collected and analyzed for 1961–2020 by USDA’s Economic Research Service showed that average annual agricultural output growth has slowed to its lowest rate in six decades and is linked to a slowdown in agricultural productivity growth.
- Total factor productivity (TFP), which measures the overall efficiency with which agricultural inputs are combined to produce output, grew globally at an average annual rate of 1.12 percent in the 2010s, down from 1.99 percent in the 2000s.
- The slowdown in agricultural output is primarily observed in developing countries, where TFP growth fell by more than half from an average of 2.20 percent in the 2000s to 1.06 percent in the 2010s.
- A slowdown in productivity growth suggests that producers will need to use more land and apply other agricultural inputs more intensively to maintain growth in agricultural output.
Agricultural productivity growth helps farmers meet the food and fiber demands of growing global populations while using relatively fewer resources. One of the most informative measures of agricultural productivity is total factor productivity (TFP), which measures the efficiency with which agricultural inputs are combined to produce output. Unlike single factor productivity measures, such as output per acre (yield) for land, total factor productivity compares total crop, livestock, and aquaculture output with the full set of inputs used in agricultural production. When the total value of agricultural output grows faster than the total amount of inputs used, then TFP increases (see blue box below).
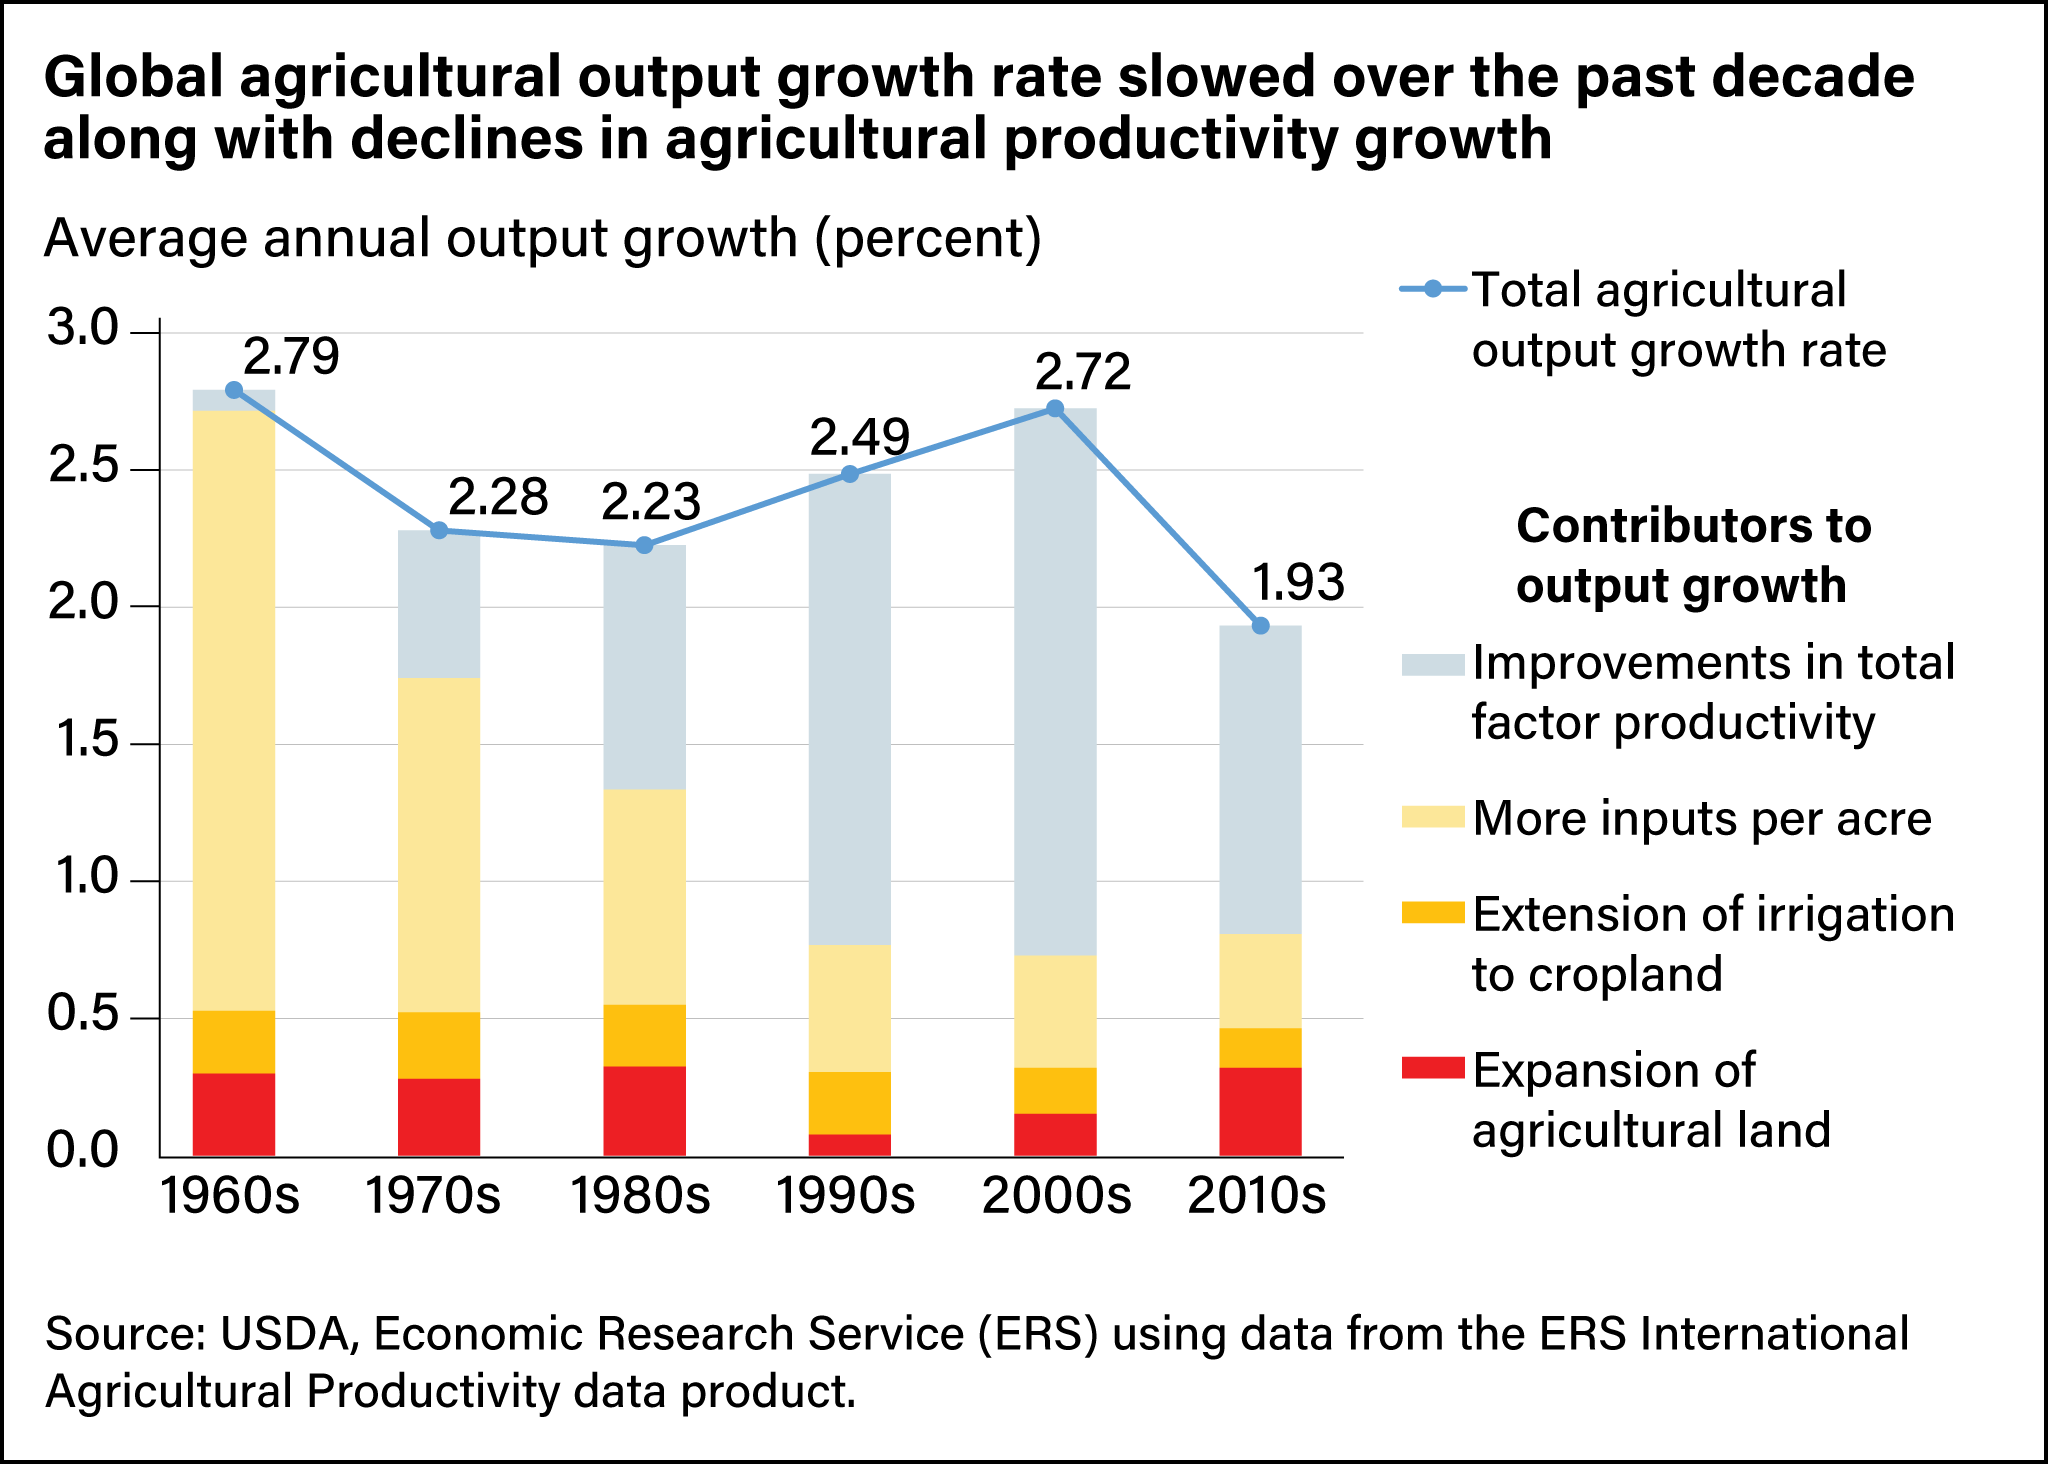
In its International Agricultural Productivity data product, USDA’s Economic Research Service (ERS) estimates annual indexes for global, regional, and national agricultural output and productivity starting in 1961. In 2022, ERS updated its estimates and extended the series to include 2020 data. The update shows the growth rate for global output was nearly a third slower in the 2010s compared with the 2000s, falling to 1.93 percent per year in 2011–20 from 2.72 percent a year in 2001–10. In the most recent decade, global agricultural output increased at the slowest pace of the six decades covered in the data series (see chart below).
Productivity growth also has started to decline, contributing to the slowdown in agricultural output growth. During the 1960s and 1970s, input intensification or the increasing use of labor, capital, and fertilizers per acre drove global agricultural output growth. This period also includes the early years of the “Green Revolution,” when the benefits from agricultural research and development (R&D), such as the adoption of high-yielding crop varieties, led to productivity gains in cereal grains. Over time, TFP growth also began to accelerate and has represented the largest component of agricultural output growth since the 1980s. However, during the past decade of decelerating output growth, slowing agricultural productivity growth accounted for most of the decline. In the 2010s, average TFP growth averaged 1.12 percent per year compared with 1.99 percent per year in the 2000s. TFP was not the only component of agricultural output growth changing in the most recent decade. Comparing the last two decades, growth in output that was associated with the intensified use of inputs (labor, capital, and materials) per acre and irrigation declined, but the rate at which land was brought into production or converted into cropland more than doubled. Even so, slowing TFP growth was the most dominant factor weighing on output growth. Overall, a slowdown in global productivity growth suggests that farmers will need to use more land and apply other inputs more intensively to maintain growth in output.
Where Has Agricultural Productivity Been Slowing?
Agricultural output growth accelerated in developed countries over the past decade but slowed among developing countries, although the rate of output growth in developing countries is still faster.
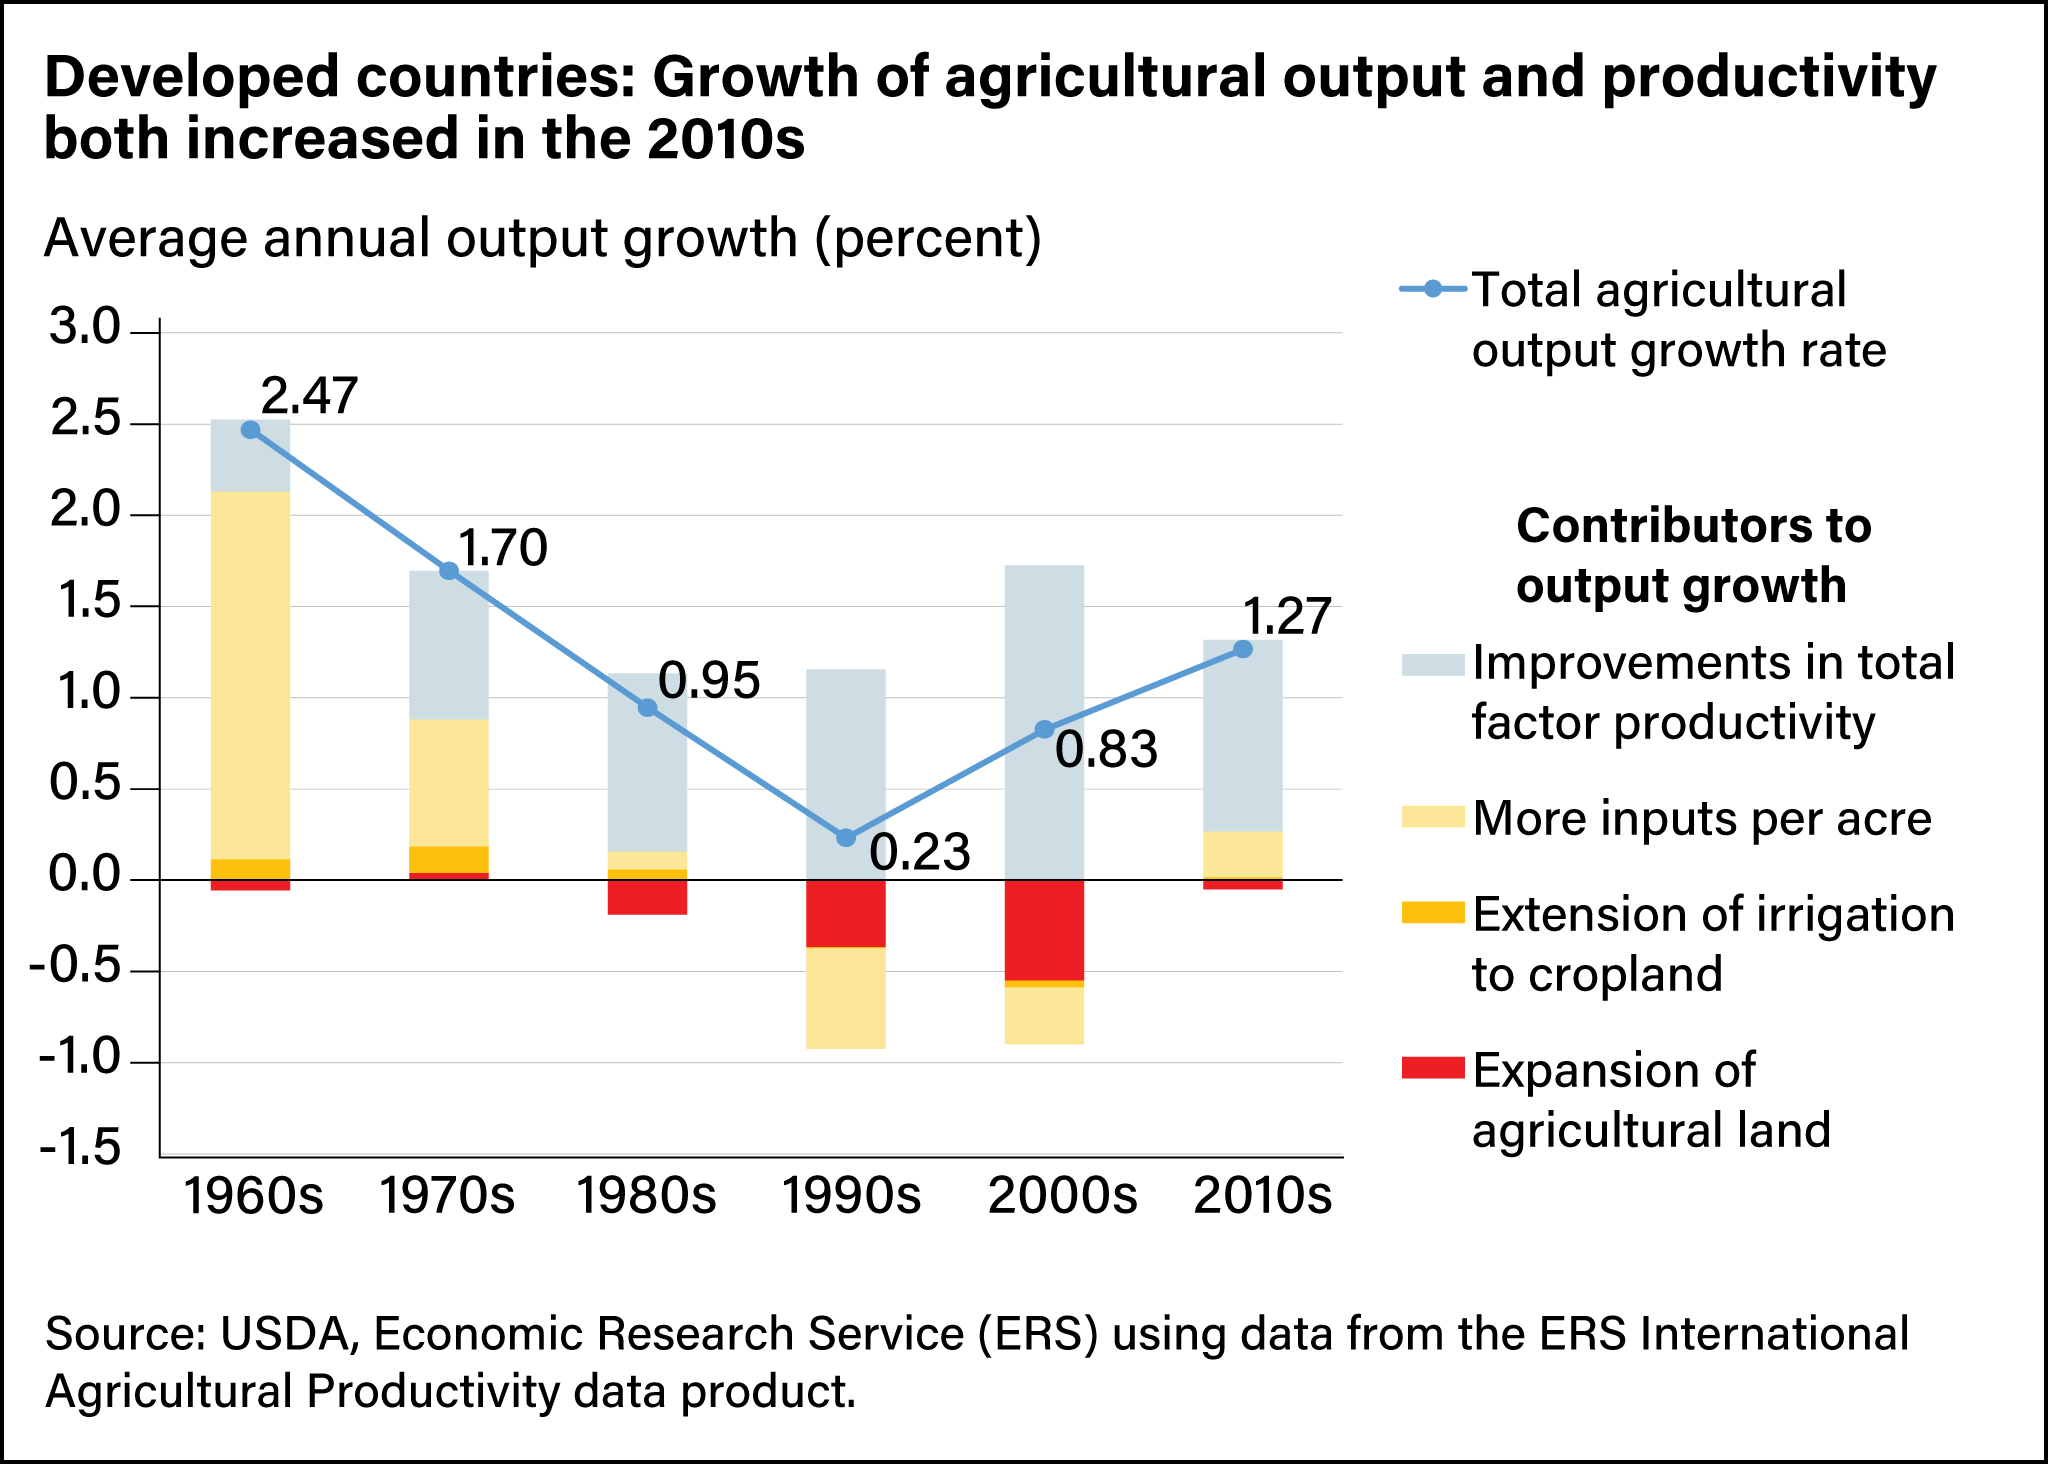
In developed countries, agricultural output growth increased from an average of 0.83 percent in the 2000s to 1.27 percent in the 2010s (see chart below). Average annual TFP growth in developed countries was 1.05 percent in the 2010s and remained the largest component of output growth. Additional growth was driven by stabilization in the amount of land being used in production and an increase in the rate of inputs used per acre.
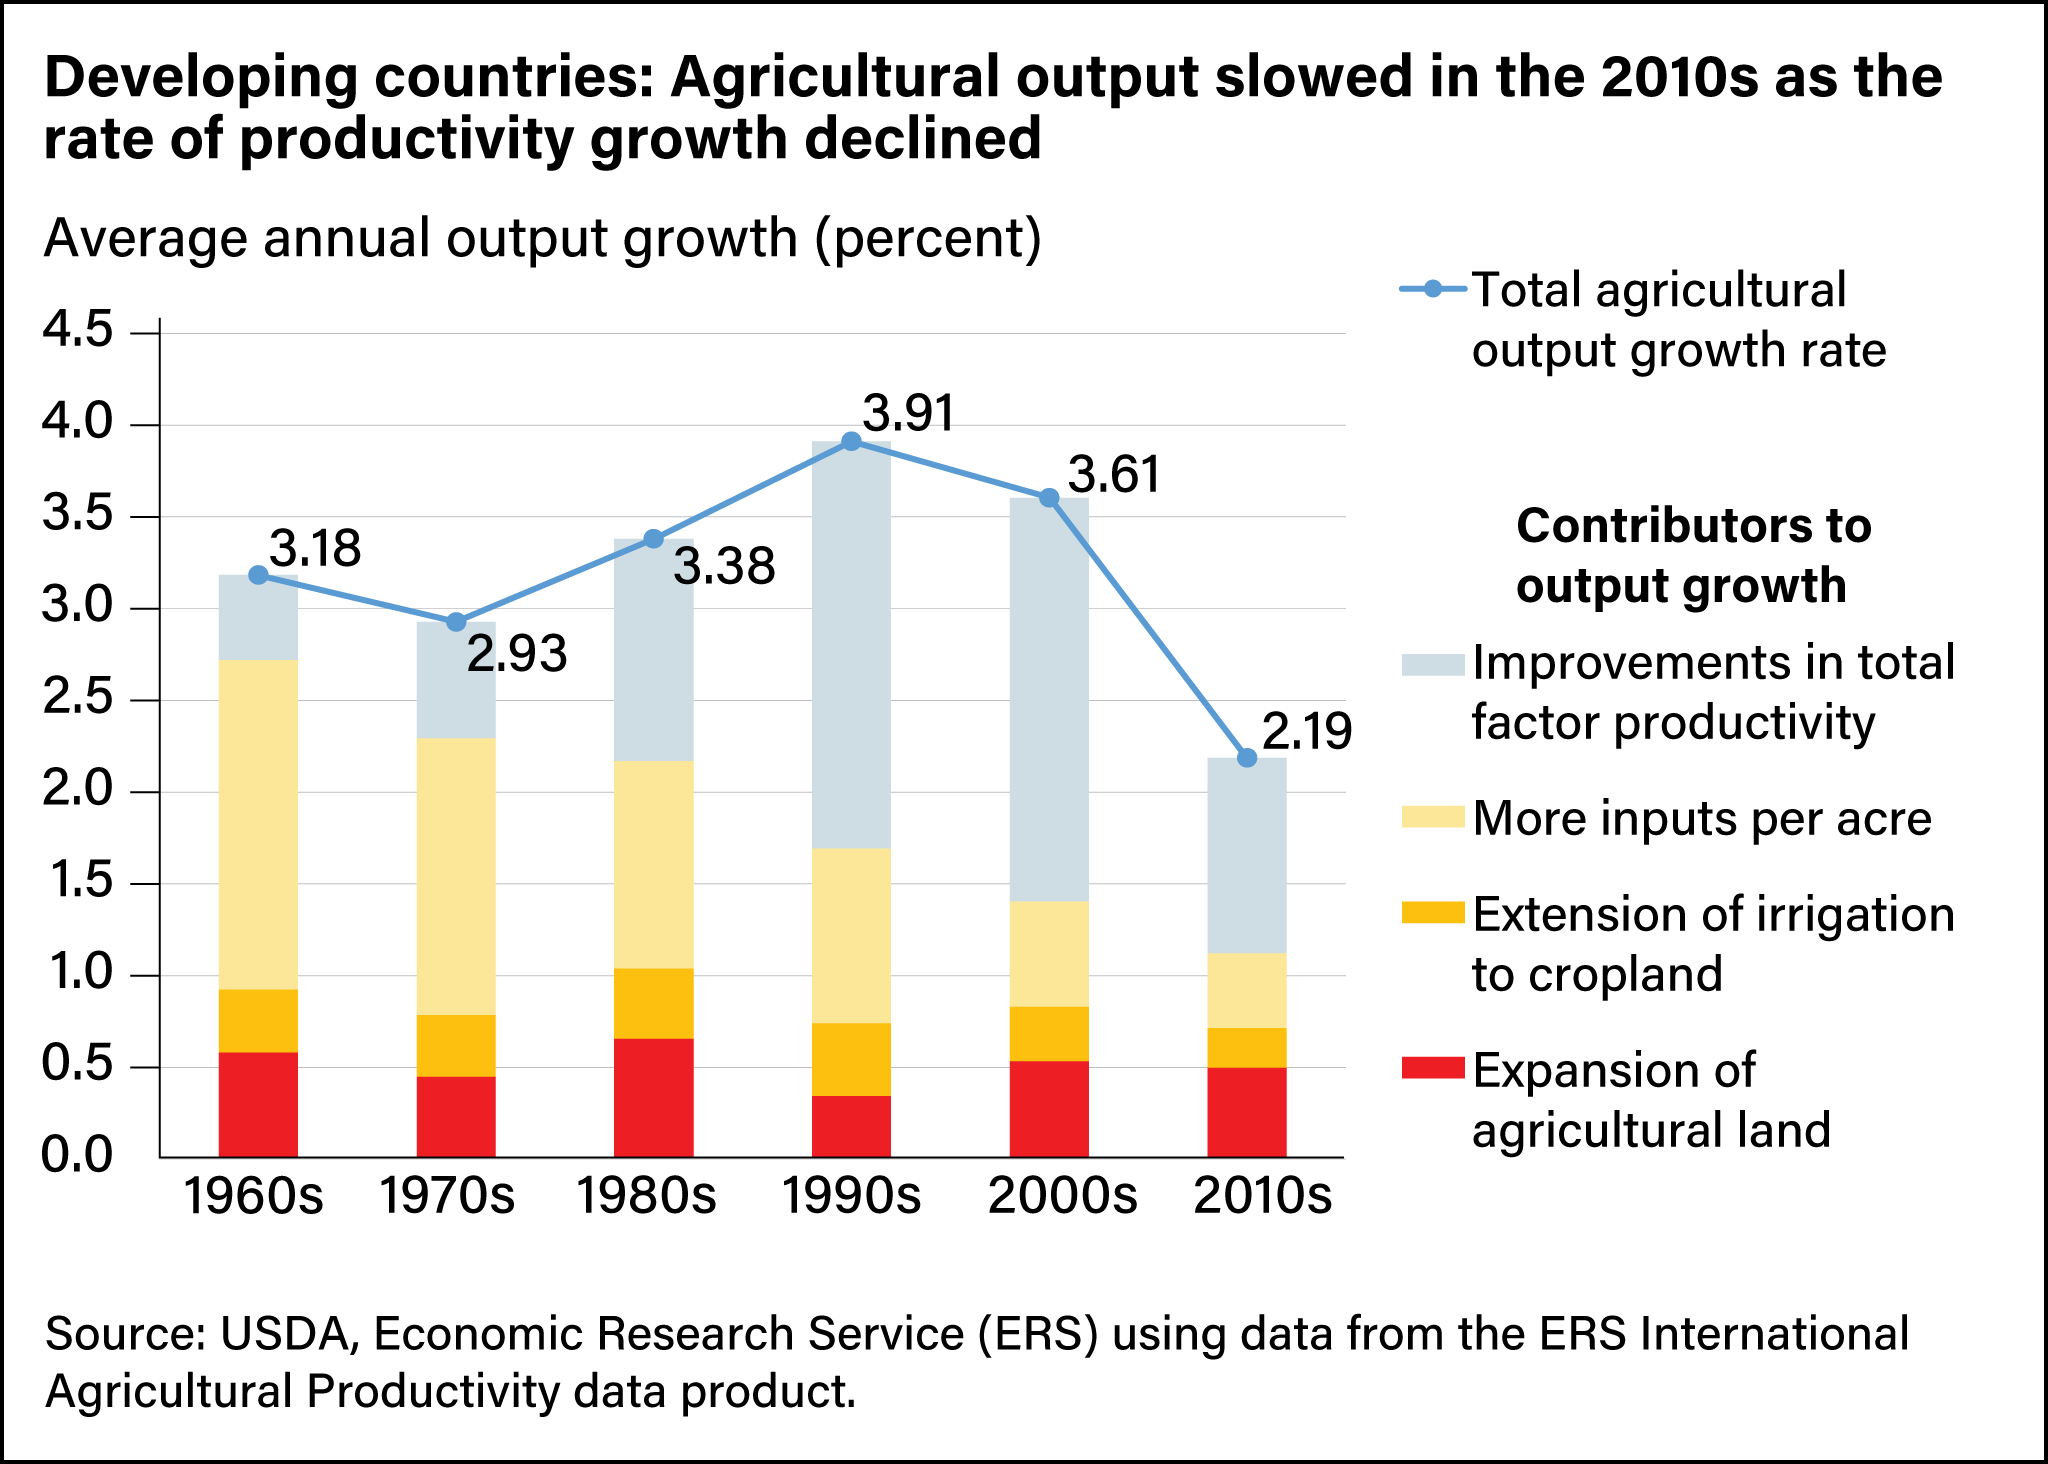
In developing countries, the output growth rate declined from an annual average of 3.61 percent in the 2000s to 2.19 percent in the 2010s. This reduction was largely driven by a slowdown in TFP growth, which fell by more than half from an average of 2.20 percent in the 2000s to 1.06 percent in the 2010s. The growth rate of irrigation and input use in developing countries also declined in the 2010s, while the rate of land expansion remained about steady.
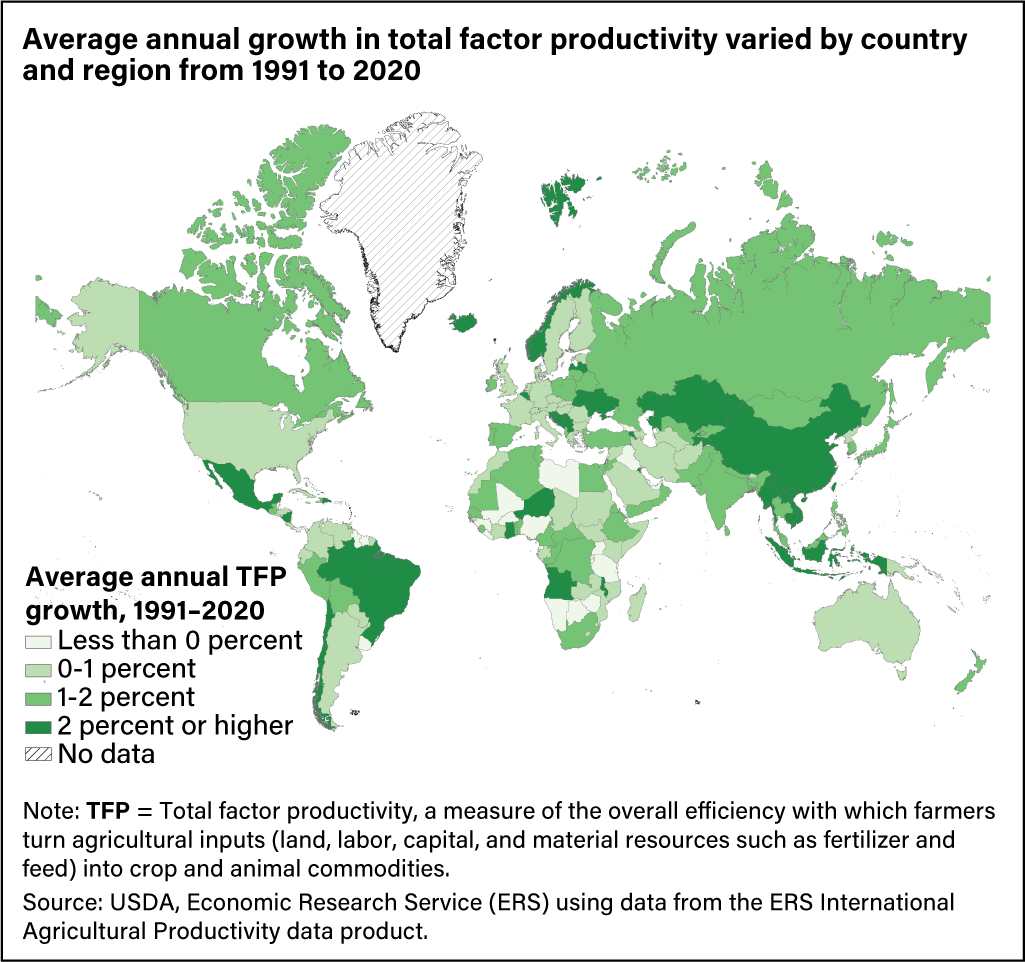
Long-term agricultural productivity growth has varied across countries. For example, from 1991 to 2020, TFP grew at an annual rate of more than 2 percent in the large agricultural-producing countries of Brazil, China, Mexico, and Ukraine (see map below). In the same period, annual TFP growth was between 1 and 2 percent a year in Canada, India, and Russia and between 0 and 1 percent a year in the United States and Australia. Several countries have experienced negative TFP growth in the past 30 years in Africa and South America. While TFP fluctuates from year to year because of weather and other factors, over the long term, growth in TFP can be negative if farmers are expanding into less productive agricultural land, natural resources are being degraded, or from climate change.
The slowdown in agricultural productivity growth may be linked to several factors. First, recent studies have shown that climate change and associated weather shocks such as drought have slowed the growth in or decreased agricultural yields. If weather shocks become more extreme or frequent over time, the negative effects on agricultural productivity are likely to become even larger. Second, the emergence of new pests and diseases like disease-resistant weeds have in some cases reduced crop yields or required additional inputs or management practices to control. Third, the rate of development of new productivity-enhancing technologies may be slowing.
Previous ERS research has highlighted a decrease in public agricultural R&D spending among high-income countries that could be associated with long-term declines in TFP growth. At the same time, farmers across different regions of the world may be slow to adopt improved technologies. For example, producers in developing countries often lack access to robust agricultural extension systems, agricultural finance and insurance, or reliable information technology infrastructure that makes it easier to adopt new technologies. Finally, ERS research has shown that barriers to international trade may limit the transfer of productivity-enhancing technologies between countries and make the import of agricultural inputs more expensive.
This article is drawn from:
- International Agricultural Productivity. (n.d.). U.S. Department of Agriculture, Economic Research Service.
You may also like:
- Data Training Webinar: U.S. and International Agricultural Productivity. (n.d.). U.S. Department of Agriculture, Economic Research Service.
- Fuglie, K., Jelliffe, J. & Morgan, S. (2021, December 28). Slowing Productivity Reduces Growth in Global Agricultural Output. Amber Waves, U.S. Department of Agriculture, Economic Research Service.
- Fuglie, K. & Rada, N. (2013). Resources, Policies, and Agricultural Productivity in Sub-Saharan Africa. U.S. Department of Agriculture, Economic Research Service. ERR-145.
- Rada, N. & Valdes, C. (2012). Policy, Technology, and Efficiency of Brazilian Agriculture. U.S. Department of Agriculture, Economic Research Service. ERR-137.
- Rada, N. & Schimmelpfennig, D. (2015). Propellers of Agricultural Productivity in India. U.S. Department of Agriculture, Economic Research Service. ERR-203.
- Rada, N., Liefert, W.M. & Liefert, O. (2017). Productivity Growth and the Revival of Russian Agriculture. U.S. Department of Agriculture, Economic Research Service. ERR-228.
- Fuglie, K. (2017). "R&D Capital, R&D Spillovers, and Productivity Growth in World Agriculture". Applied Economic Perspectives & Policy. 40(3):421-444.
- Fuglie, K., Gautum, M., Goyal, A. & Maloney, W.F. (2020). "Harvesting Prosperity: Technology and Productivity Growth in Agriculture". World Bank Group.