
Productivity Is the Major Driver of U.S. Farm Sector’s Economic Growth
- by Sun Ling Wang, Roberto Mosheim, Richard Nehring and Eric Njuki
- 7/6/2020
According to the latest statistics, the level of U.S. farm output nearly tripled between 1948 and 2017, growing at an average annual rate of 1.53 percent. USDA’s Economic Research Service (ERS) researchers attribute this growth mainly to productivity advancement.
To monitor the performance of the U.S. farm sector, ERS develops productivity statistics along with price and quantity estimates of 10 output sub-categories (such as meat animals, dairy, and food grains) and 12 input sub-categories (such as hired labor, durable equipment, and pesticides). ERS’s agricultural productivity statistics are based on a broad productivity measure that reflects all inputs, called total factor productivity (TFP). Annual TFP growth is the difference between the growth of aggregate agricultural output and the growth of aggregate inputs used on farms under the control of farmers.
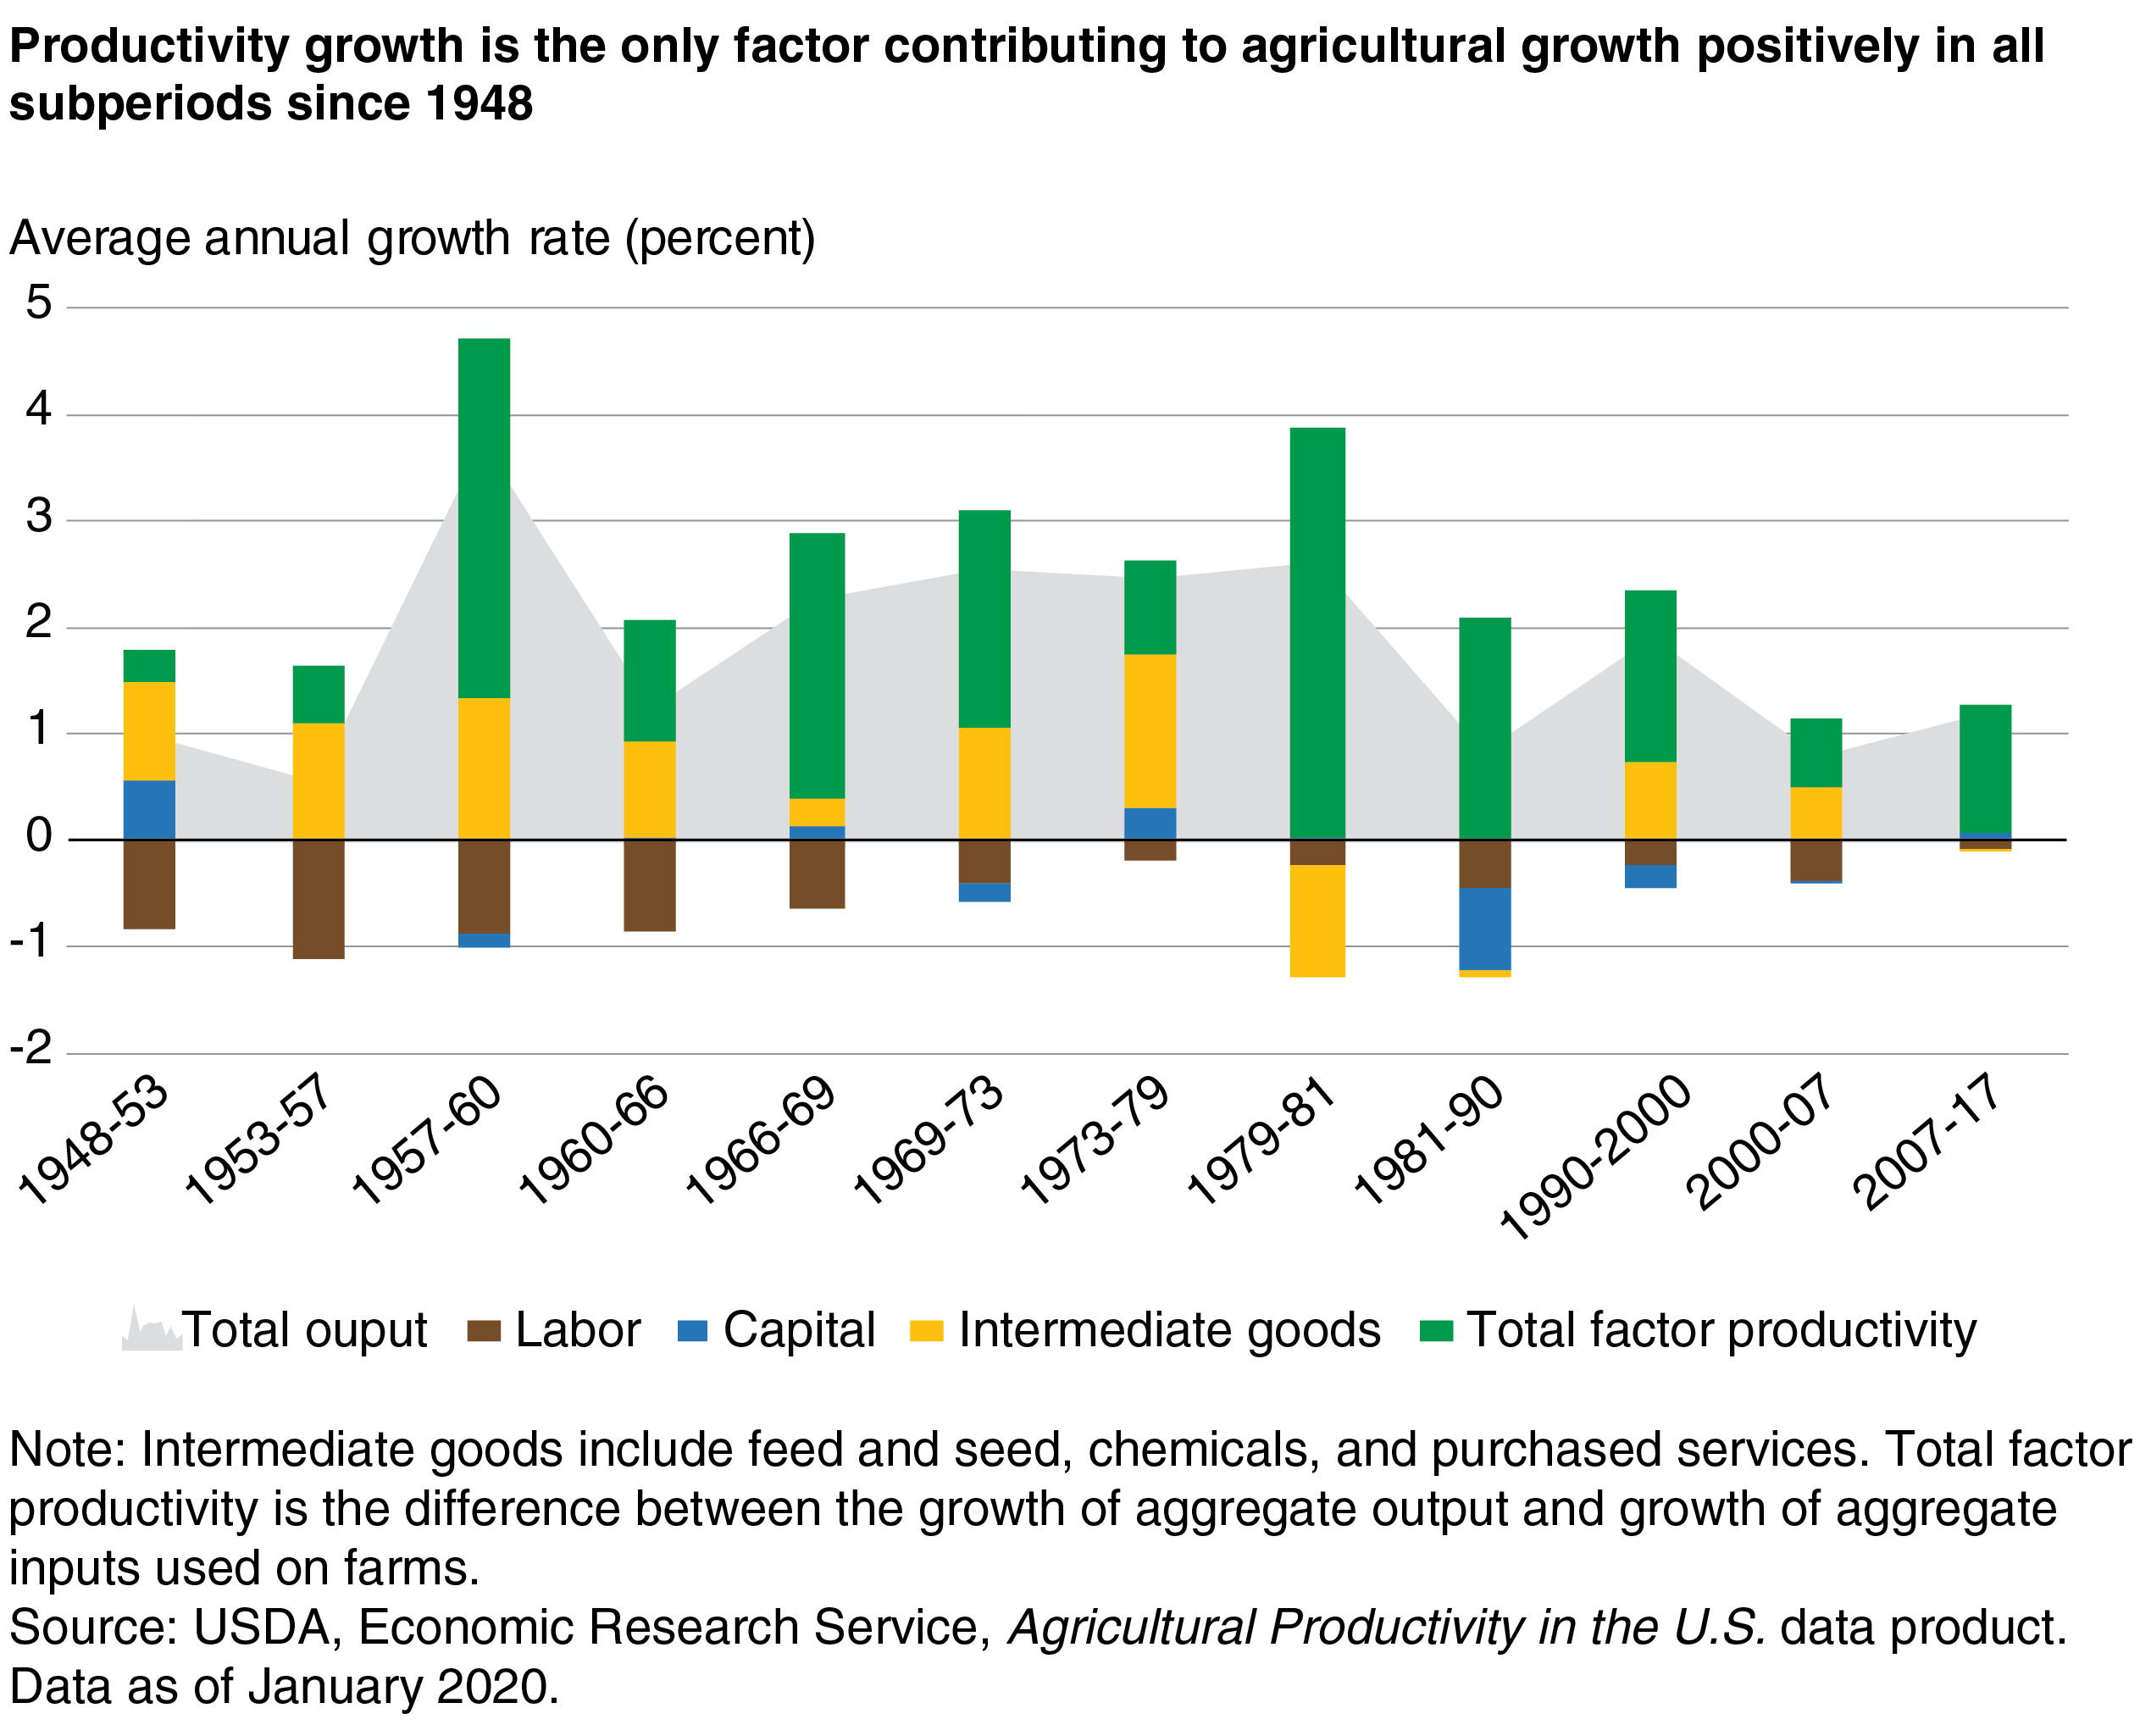
Over the long-term, productivity growth is the major driver of agricultural growth. It is also the only source that contributed positively to output growth in all sub-periods that are measured from peak to peak between U.S. business cycles. Annual TFP growth rebounded from 0.6 percent in 2000-07 to 1.21 percent in 2007-17. During this most recent period, productivity growth enabled agricultural output (production) to grow at a rate of 1.18 percent per year even as total input use declined at 0.03 percent per year.
Aggregate input use increased at a modest 0.07 percent annually, so the growth in farm sector output was primarily due to productivity growth, which grew at an average of 1.46 percent per year. While total input use grew slowly between 1948 and 2017, its composition has shifted considerably.
ERS groups the 12 input subcategories into 3 broad categories: capital (including land), labor (both farmers and hired laborers), and intermediate goods (such as agricultural chemicals and purchased services). Over the last 70 years, intermediate goods increased by more than 130 percent, while agricultural labor declined by 76 percent and the amount of land devoted to agriculture by more than 25 percent. The decline in farm labor came partly because of workers seeking higher wages and job opportunities outside the farm sector. Farmers also substituted labor with other inputs, including farm machinery, herbicides, and hired services (e.g., ground preparation, spraying, and harvesting). In addition, increased productivity allowed farmers to release both land and labor into other industries, thus supporting growth elsewhere in the economy.
In addition to reporting annual growth rates of agricultural output, ERS reports agricultural output growth in each of 12 sub-periods, as well as its sources of growth in each sub-period. Between 1948 and 2017, the decline in labor inputs had a negative effect on annual output growth in all 12 sub-periods, contributing to 0.45 percentage points per year on average. Although farmers increased their investments in farm structures, machinery, and other durable equipment during this period, land use declined, leading to a net negative impact of capital inputs on annual output growth (-0.06 percentage points per year on average). By comparison, the continuing growth in intermediate goods contributed 0.58 percentage points per year to output growth, the highest among all inputs (capital, labor, and intermediate goods).
Nevertheless, the contribution of intermediate goods to output growth has been small (even negative in some years) since 1981. As a result, productivity growth—driven by innovations in animal and crop genetics, chemicals, equipment, and farm organization through research funding—has become more important than ever in maintaining a substantial economic growth in the U.S. farm sector.
This article is drawn from:
- Agricultural Productivity in the United States. (n.d.). U.S. Department of Agriculture, Economic Research Service.
You may also like:
- Agricultural Research and Productivity. (n.d.). U.S. Department of Agriculture, Economic Research Service.
- Wang, S.L., Nehring, R. & Mosheim, R. (2018, March 5). Agricultural Productivity Growth in the United States: 1948-2015. Amber Waves, U.S. Department of Agriculture, Economic Research Service.
- Wang, S.L., Heisey, P., Schimmelpfennig, D. & Ball, E. (2015). Agricultural Productivity Growth in the United States: Measurement, Trends, and Drivers. U.S. Department of Agriculture, Economic Research Service. ERR-189.
- Heisey, P. & Fuglie, K. (2018). Agricultural Research Investment and Policy Reform in High-Income Countries. U.S. Department of Agriculture, Economic Research Service. ERR-249.