
Climate Change Likely to Have Uneven Impacts on Agricultural Productivity
- by Sun Ling Wang, Richard Nehring and Ryan Williams
- 8/12/2019
According to ERS productivity statistics, U.S. farm output since 1948 has grown by 170 percent. With little change in the total use of inputs—such as fertilizer, pesticides, labor, machinery, land, and other materials—increases in total factor productivity (TFP, measured as total output per unit of total input use) accounted for more than 90 percent of that output growth. However, TFP growth rates fluctuate considerably from year to year, mostly in response to adverse weather, which can lower productivity estimates.
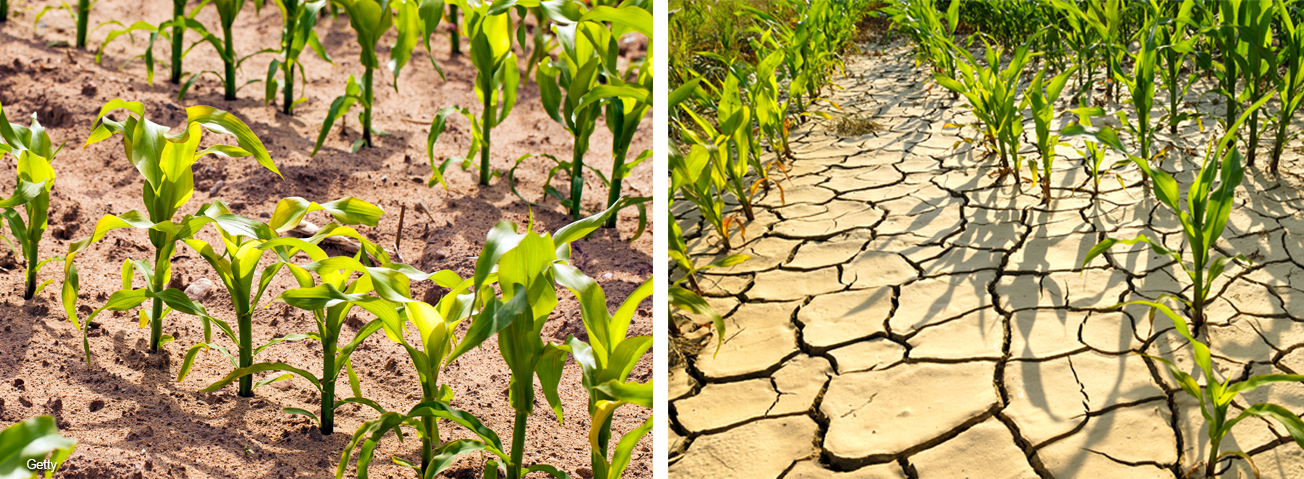
In the past four decades, the frequency of adverse weather events has increased. “Weather” refers to short-term variations in temperature or precipitation, while “climate” refers to average weather patterns over a long period of time. Although climate change and weather variation are two different issues, changes in climate patterns are increasing the frequency of extreme weather, such as heat waves and drought.
Changes in temperature and precipitation can have different effects on crop and livestock production. The scientific literature suggests that high heat stress can reduce livestock fertility, weight, and the efficiency with which farm animals metabolize feed. This stress can be measured with a Temperature-Humidity Index (THI). For crops, the Oury index (a measure of aridity that normalizes rainfall with respect to temperature) has been found to be an effective indicator of the relationship between climatic conditions and plant growth. A lower Oury index indicates drier conditions that will generally result in lower crop yield.
Recent ERS research exploring the relationship between climate change and agricultural productivity found that changes in THI and the Oury index varied by U.S. region. Some States had little change on the average, but became more volatile, with greater fluctuation since the 1980s. The results also suggest that, over the long run, each State gradually adapted to its average climate conditions, with States exposed to more severe conditions adopting technologies or practices that can mitigate damage from adverse weather. For example, drier regions, such as California and Nevada, usually have higher irrigation-ready land density than other regions. As a result, average changes in temperature and precipitation may not have severe impacts on productivity as long as they fall within historical fluctuation ranges. In contrast, unexpected weather shocks, such as severe droughts that fall outside the range of historical weather fluctuations, have more significant impacts on regional productivity.
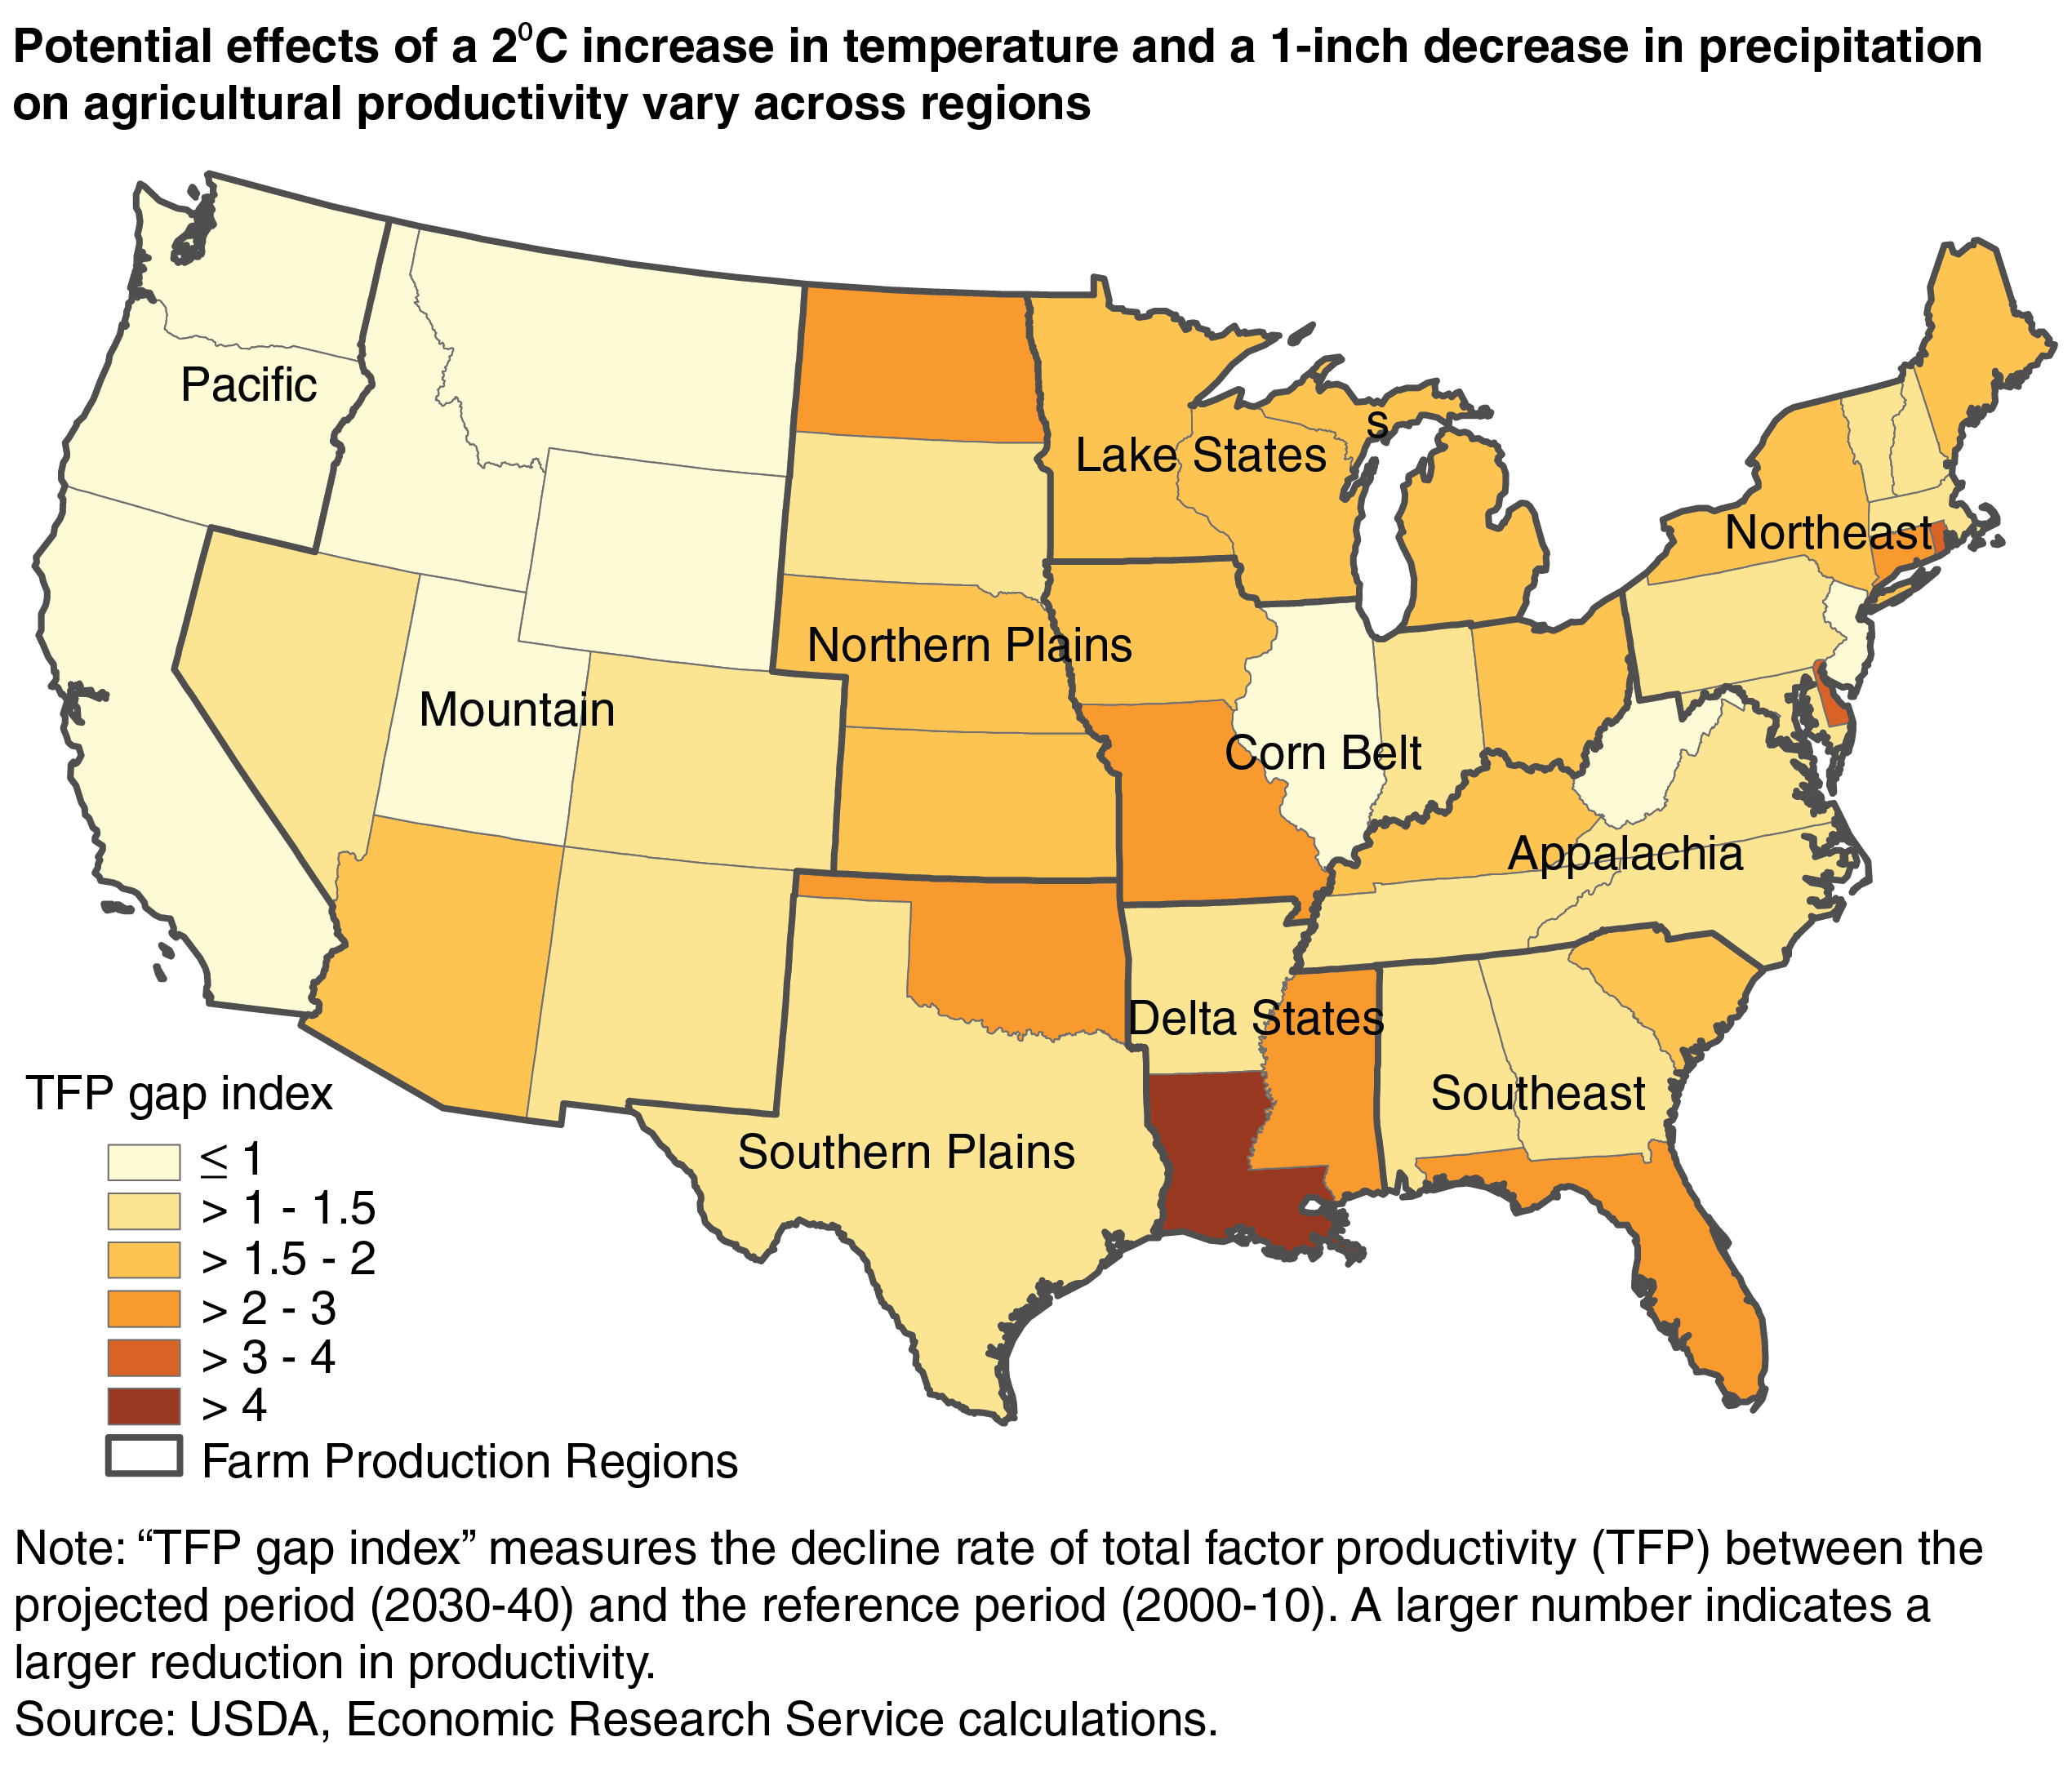
Researchers also modeled a future climate-change scenario with an average temperature increase of 2 degrees Celsius (3.6 degrees Fahrenheit) and a 1-inch decrease in average annual precipitation. Projections showed that the difference of the total factor productivity levels—the “TFP gap index”—between the projected period (2030-40) and the reference period (2000-10) varied across regions. Some States would experience larger effects than others, because for some States those climate changes fall within the range of what is historically observed, while for other States they do not. Under the climate change scenario, the States experiencing the greatest impacts would include Louisiana and Mississippi in the Delta region; Rhode Island, Delaware, and Connecticut in the Northeast region; Missouri in the Corn Belt region; Florida in the Southeast region; North Dakota in the Northern Plains region; and Oklahoma in the Southern Plains region.
This article is drawn from:
- “Impacts of Climate Change and Extreme Weather on U.S. Agricultural Productivity: Evidence and Projection” by Sun Ling Wang, Eldon Ball, Richard Nehring, Ryan Williams, and Truong Chau. National Bureau of Economic Research, Agricultural Productivity and P. (2019). University of Chicago Press.
You may also like:
- Agricultural Productivity in the United States. (n.d.). U.S. Department of Agriculture, Economic Research Service.
- Wang, S.L., Heisey, P., Schimmelpfennig, D. & Ball, E. (2015). Agricultural Productivity Growth in the United States: Measurement, Trends, and Drivers. U.S. Department of Agriculture, Economic Research Service. ERR-189.
- Marshall, E., Aillery, M., Malcolm, S. & Williams, R. (2015). Climate Change, Water Scarcity, and Adaptation in the U.S. Fieldcrop Sector. U.S. Department of Agriculture, Economic Research Service. ERR-201.
- Key, N., Sneeringer, S. & Marquardt, D. (2014). Climate Change, Heat Stress, and U.S. Dairy Production. U.S. Department of Agriculture, Economic Research Service. ERR-175.
- Heisey, P. & Fuglie, K. (n.d.). ERR 249 - Agricultural Research Investment and Policy Reform in High-Income Countries.