

Food Spending of Middle-Income Households Hardest Hit by the Great Recession
- by Clare Cho, Jessica E. Todd and Michelle Saksena
- 9/27/2018
Highlights
- As household incomes fell during the Great Recession, total food spending by U.S. households declined by 7 percent between 2007 and 2010, as many households cut back on eating out.
- Food spending by households in the middle-income quintile remained below pre-recession levels in 2016, and these households continued to allocate more of their food budgets to food at home rather than eating out
- Households with an elderly member tend to have a more fixed income from Social Security or pensions, which may be why these households did not have significant changes in their food purchasing patterns during the Great Recession.
The Great Recession, which officially ran from December 2007 to June 2009, was the most severe economic downturn since the Great Depression. The 2007-09 recession was particularly harsh because of its prolonged recovery period. Over 8 million people in the U.S. lost their jobs between December 2007 and February 2010, and employment did not return to pre-recession levels until May 2014. Household incomes suffered as well. The average household income in the U.S. in 2010 was 5 percent below its level in 2007 and did not recover until 2015.
When consumers have less to spend, they adjust their purchases by cutting back on luxuries and switching to less costly options when they can for food and other necessities. A recent analysis of household food expenditures by ERS researchers found that inflation-adjusted spending for total food declined by 7 percent between 2007 and 2010 and did not return to pre-recession levels until 2015. Eating out took a bigger hit than grocery store spending, and the food spending of middle-income households reacted more strongly than spending by the lowest and highest income groups.
Similar to Employment, Eating Out Spending Was Slow To Return to Pre-Recession Levels
ERS researchers used data from the Bureau of Labor Statistics’ Consumer Expenditure Survey (CES) from 2005 through 2016—a period that covered 2 full years before the recession began, the recession, and the recovery—to understand how consumers adjusted their food spending in response to the economic downturn. The researchers adjusted the quarterly CES spending data to represent annual household expenditures and accounted for fluctuations in general food prices by converting spending into 2005 dollars. The CES provides detailed information on household-level food expenditures and characteristics that other datasets, such as ERS’s Food Expenditure Series, do not offer.
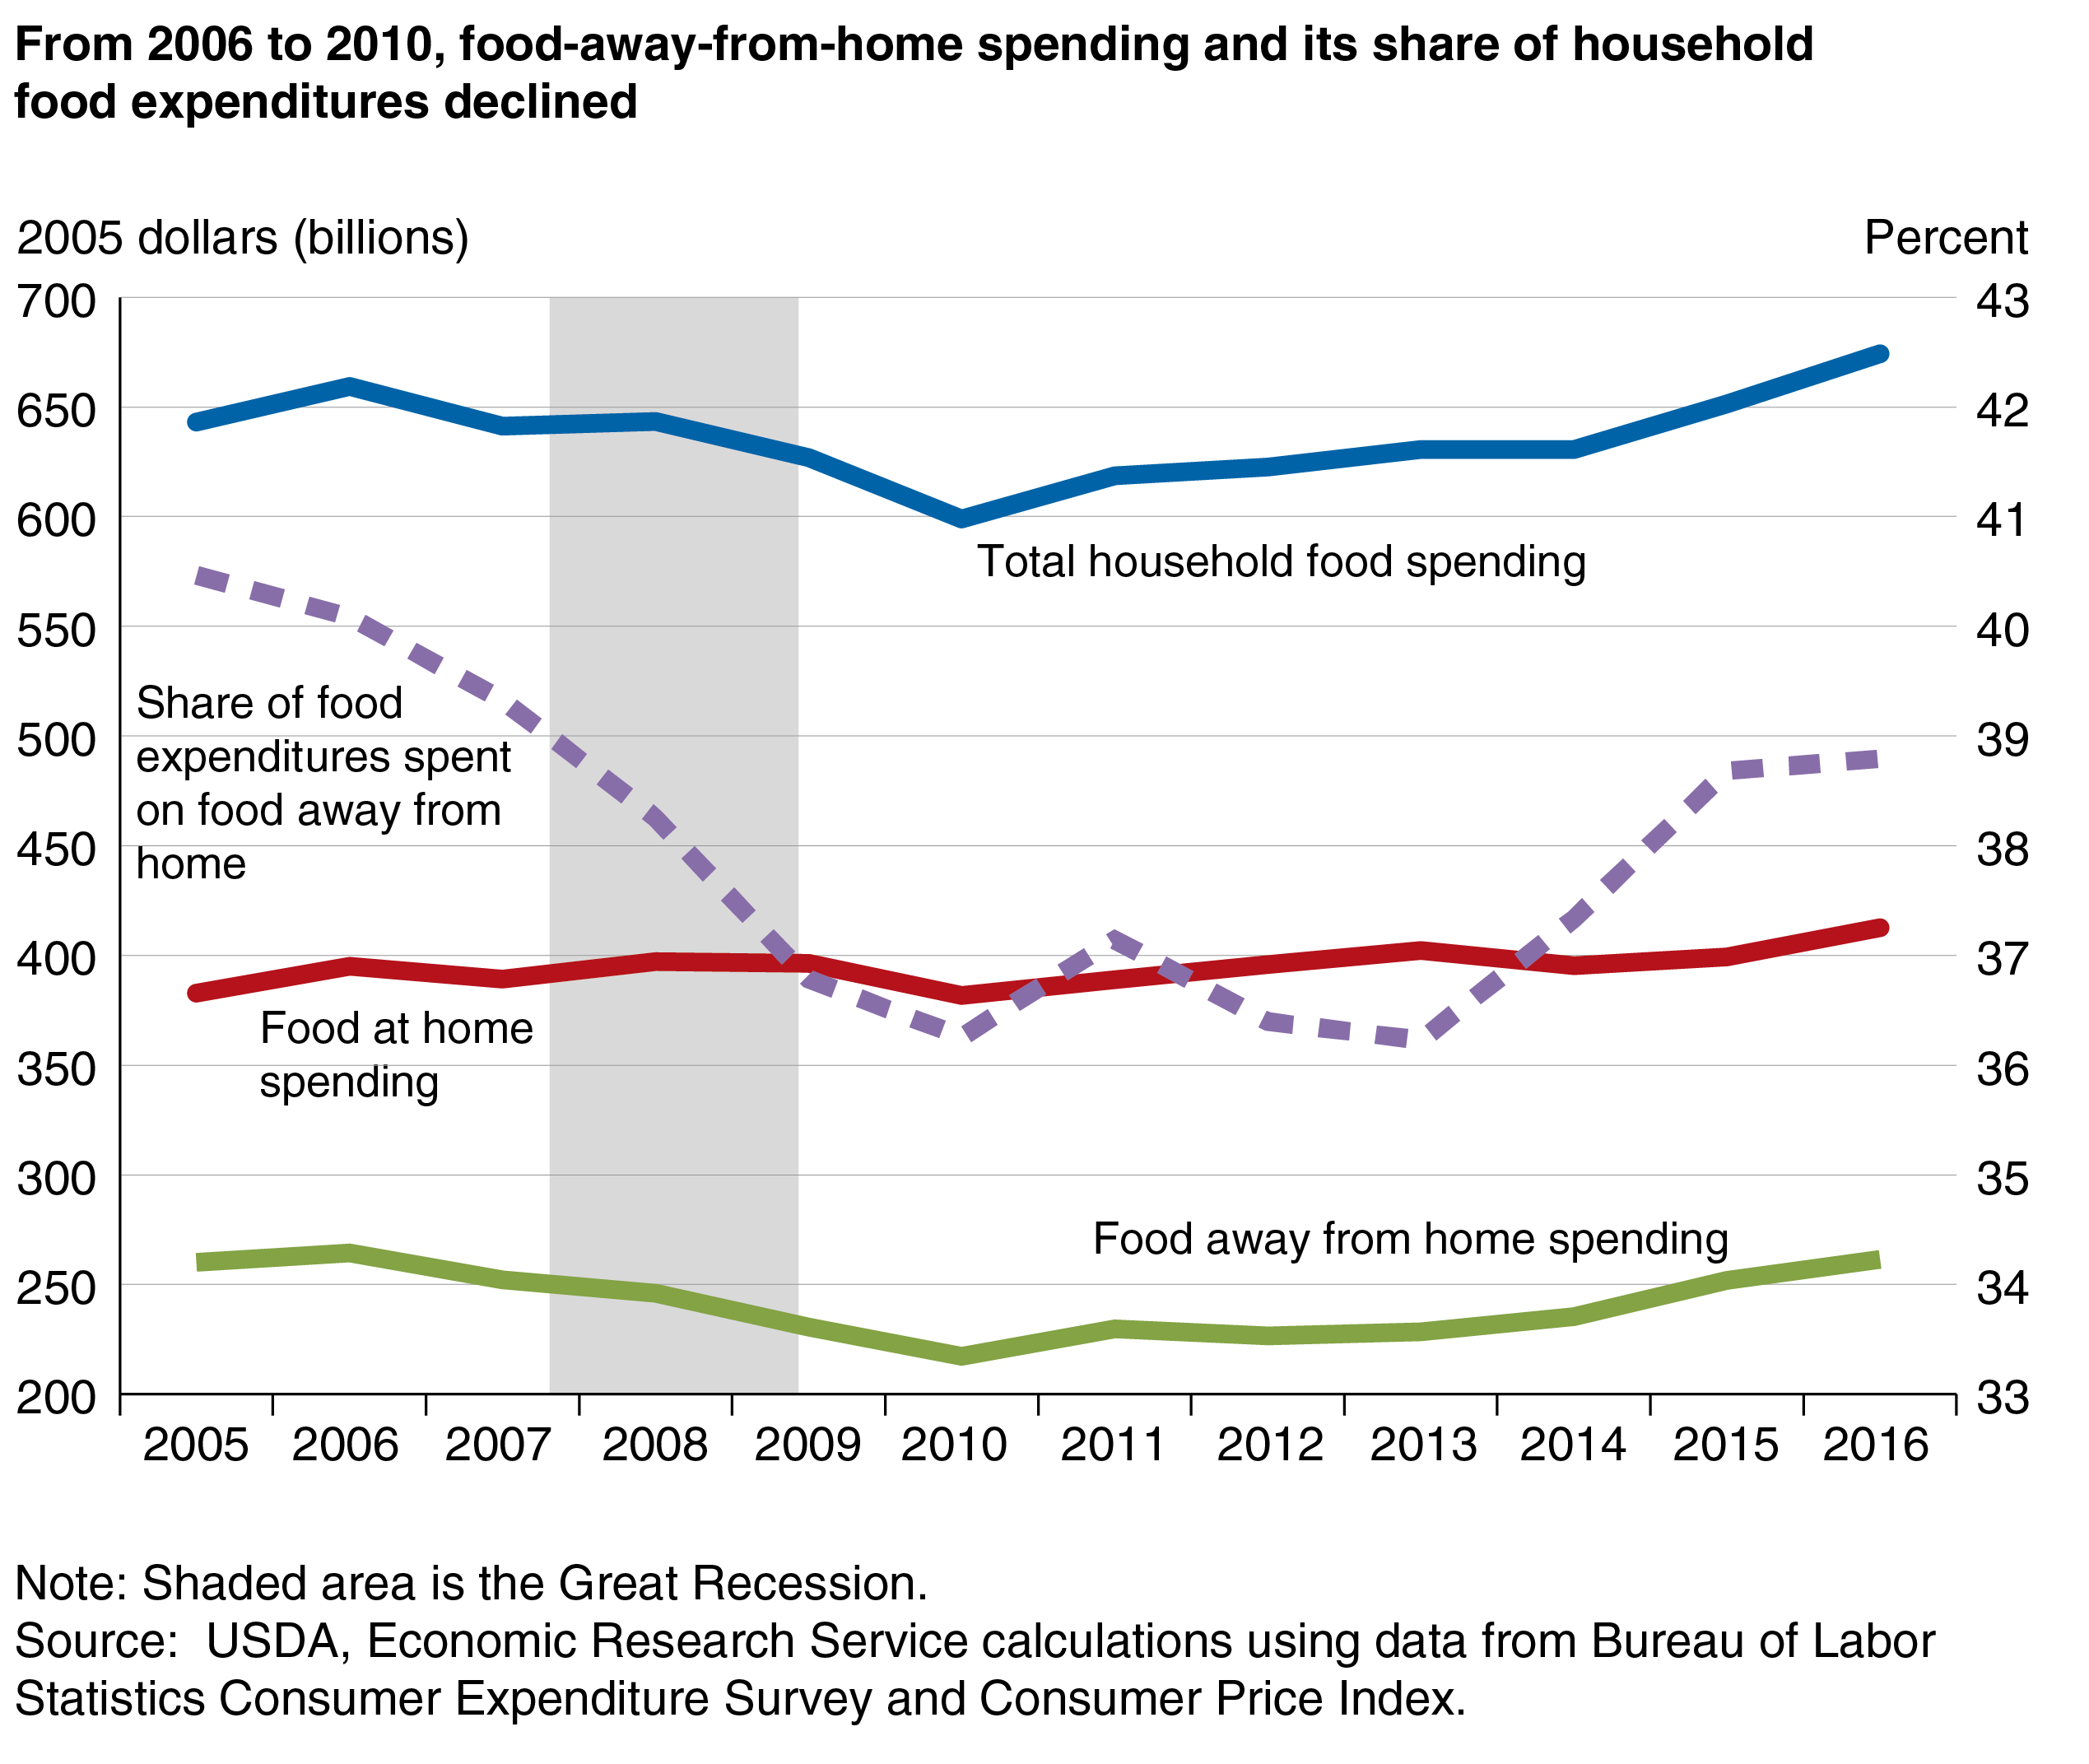
Total household food spending (in 2005 dollars) declined 7 percent from $641 billion in 2007 to $599 billion in 2010. This was the largest inflation-adjusted decline in food spending that accompanied a recession since 1984 when the CES survey began. Food spending by U.S. households did not return to pre-recession levels until 2015. However, spending on food at grocery stores and other retailers (food at home) differed from spending at fast-food places, full-service restaurants with wait staff, and other eating places (food away from home) during the period. In every year except 2010, food-at-home expenditures exceeded those in 2005. By 2016, food-at-home expenditures were $30 billion, or 8 percent above the level in 2005. In contrast, household spending on food away from home declined by $47 billion (18 percent) from 2006 to 2010 and did not recover to its 2005 level until 2016.
As a result of these divergent trends, the share of household food spending—as measured by the CES—allocated to food away from home dropped from 40.5 percent in 2005 to 36.3 percent in 2010. By 2016, food away from home’s share of total food spending had risen to 38.8 percent, still below the share prior to the 2007-09 recession.
A 2014 ERS study found that food consumption patterns demonstrated a similar trend over the Great Recession as well. Daily calories from food away from home declined by 166 (20 percent) from 2005 to 2010 among working-age adults, while total calories fell by only 118, indicating that at-home calories increased by 48 (3 percent). These calorie and spending trends suggest that U.S. households reacted to the tough economic times of the Great Recession by purchasing more grocery store foods and eating out less.
Changes in Food Spending Allocations Differed by Household Income
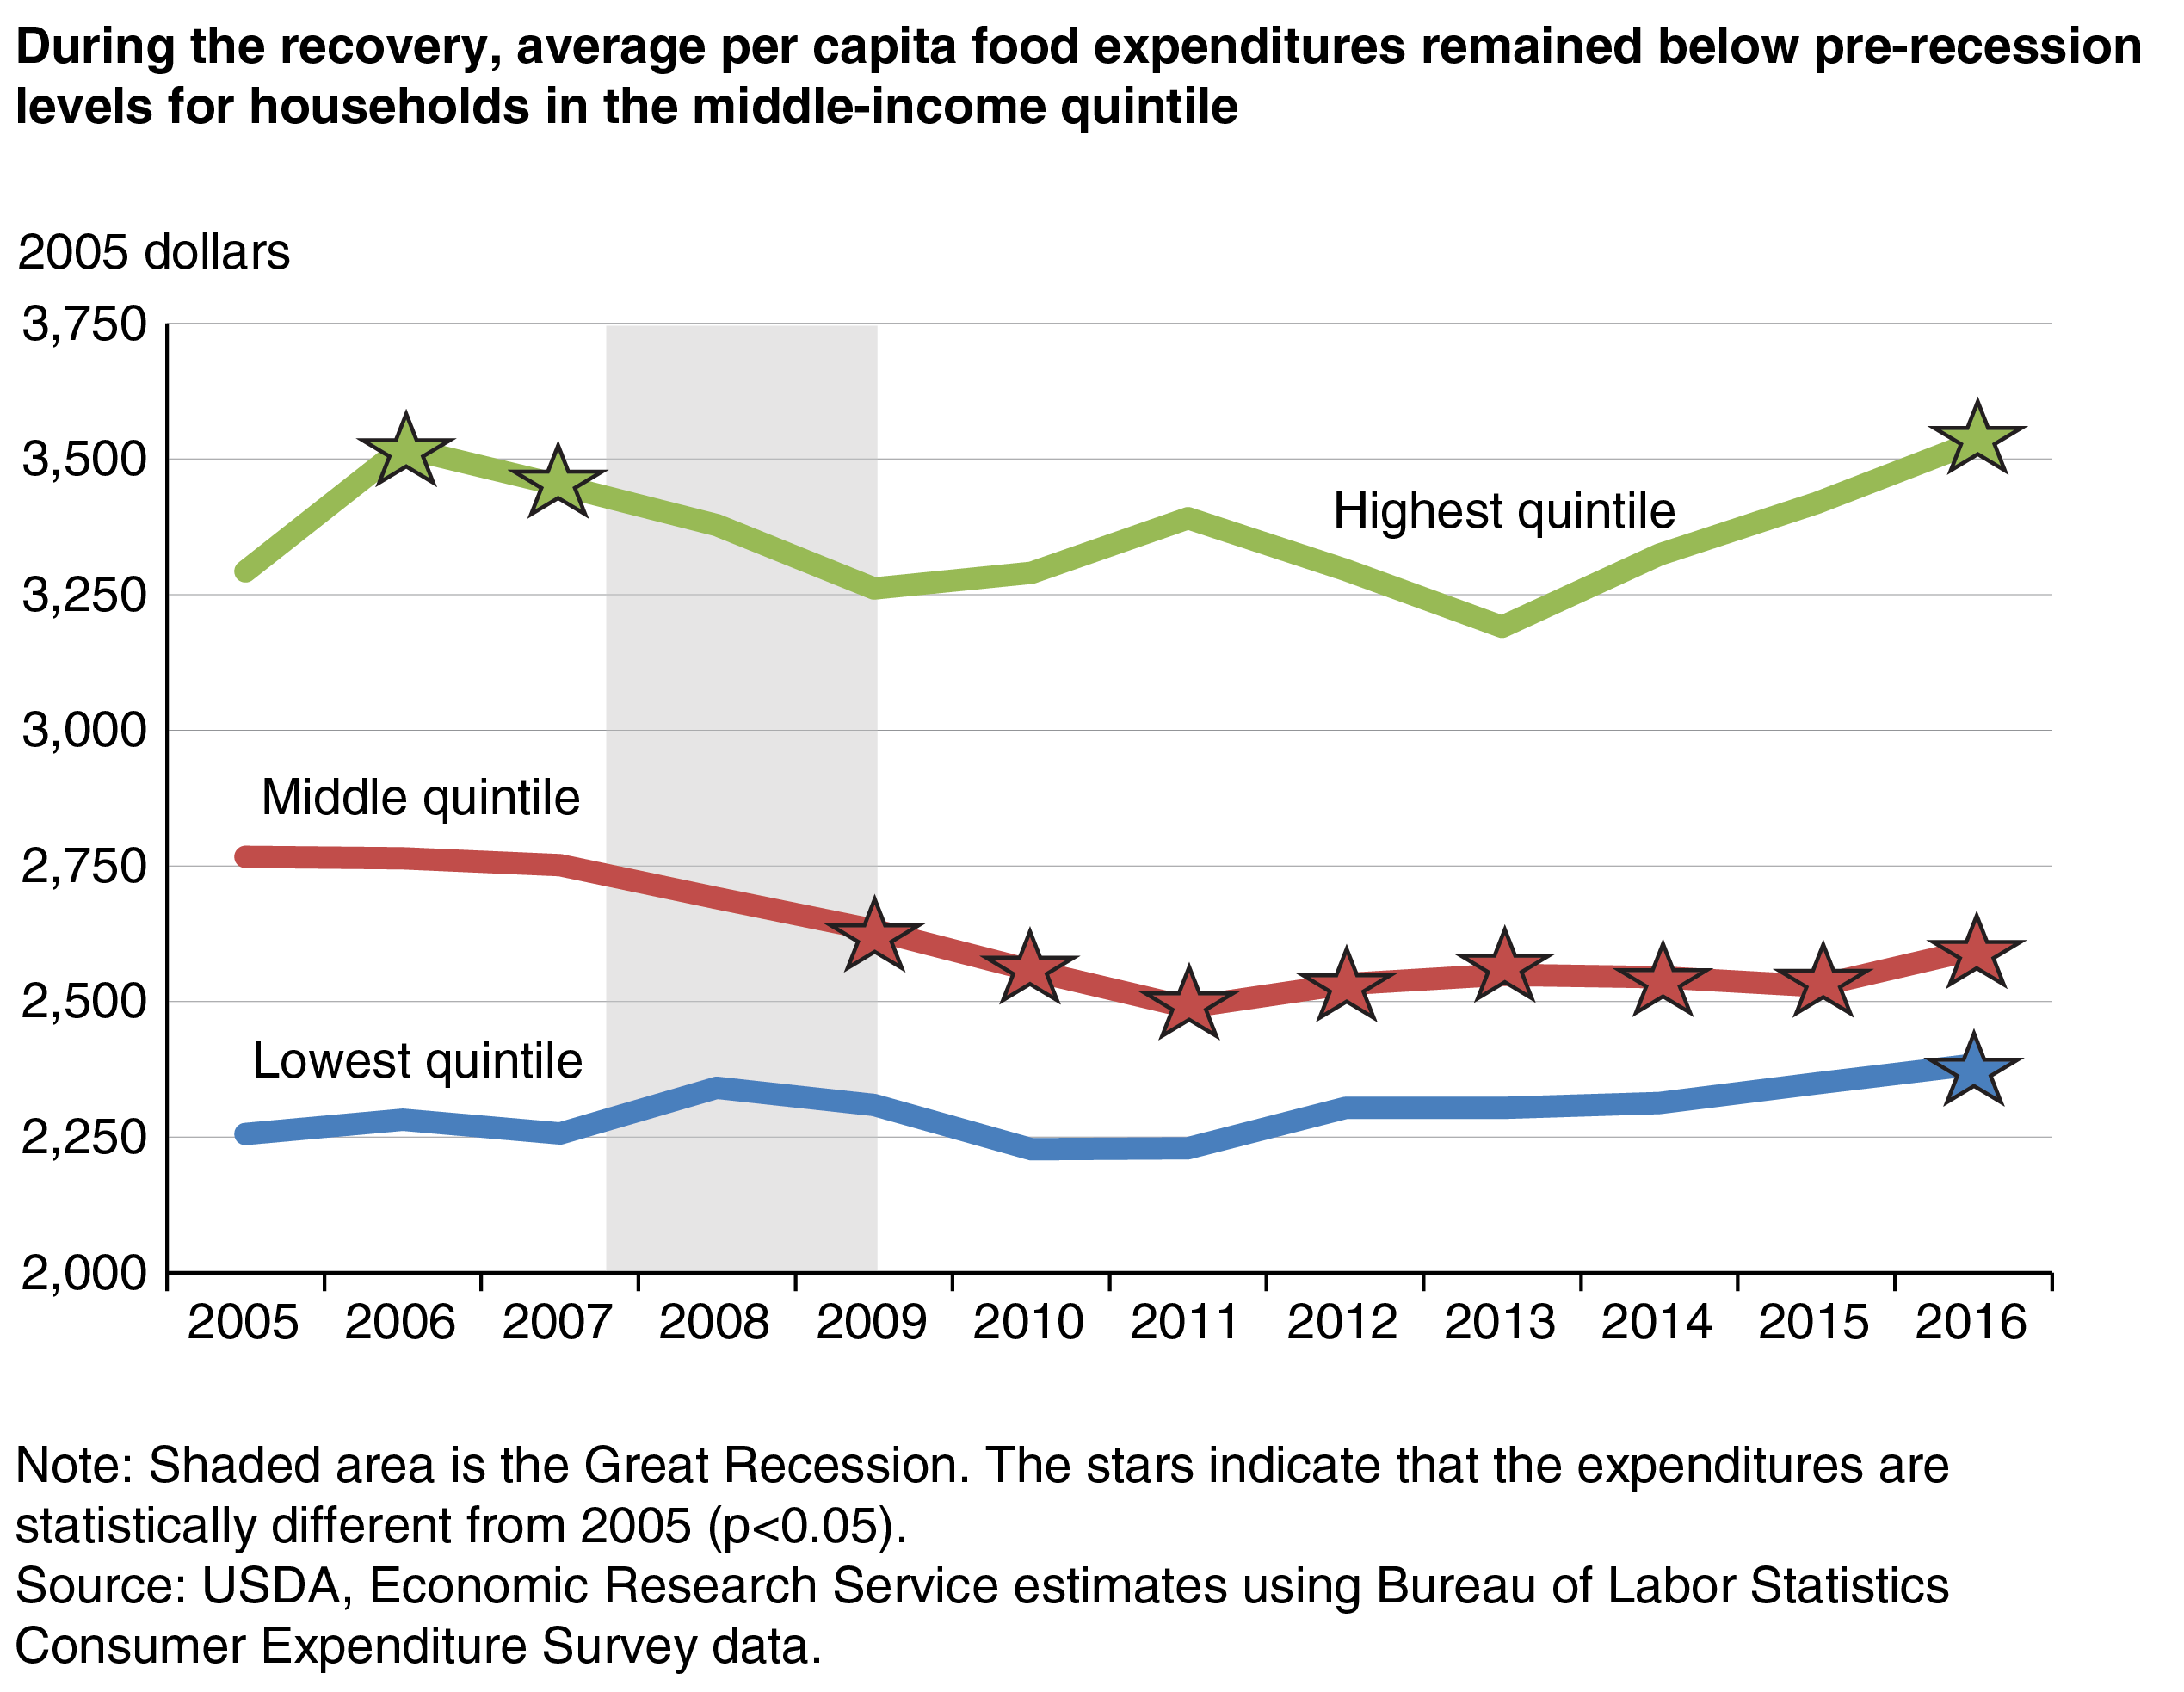
ERS researchers also studied whether changes in food spending during and after the 2007-09 recession differed across household income levels. Households with higher incomes tend to face fewer financial constraints and thus may have been less affected by the economic downturn, particularly compared to households with very low incomes. Thus, ERS researchers separated households into quintiles (five groups) to compare households in the lowest, middle, and highest income quintiles (average annual incomes of $11,467, $48,351, and $149,498, respectively, in 2005).
Middle-income households were particularly affected by the economic downturn—impacts that showed up in their food spending. Food spending by the lowest and highest income households did not significantly differ from levels in 2005 throughout the recession and recovery period. The CES reports all food expenditures, including those made with benefits from USDA’s Supplemental Nutrition Assistance Program (SNAP), which probably helped households in the lowest income quintile maintain their food budgets during the recession. Households in the highest income quintile were likely able to reduce their spending in other areas, allowing them to maintain their food purchasing patterns.
Middle-income households, on the other hand, decreased their average per capita food expenditures, reaching their lowest point in 2011. Although this group began to increase food expenditures thereafter, as of 2016, total food spending in inflation-adjusted dollars remained below the level in 2005. This suggests that middle-income households were unable to rely on assistance programs or reduce their expenditures on other household needs, forcing them to adjust their food purchasing patterns.
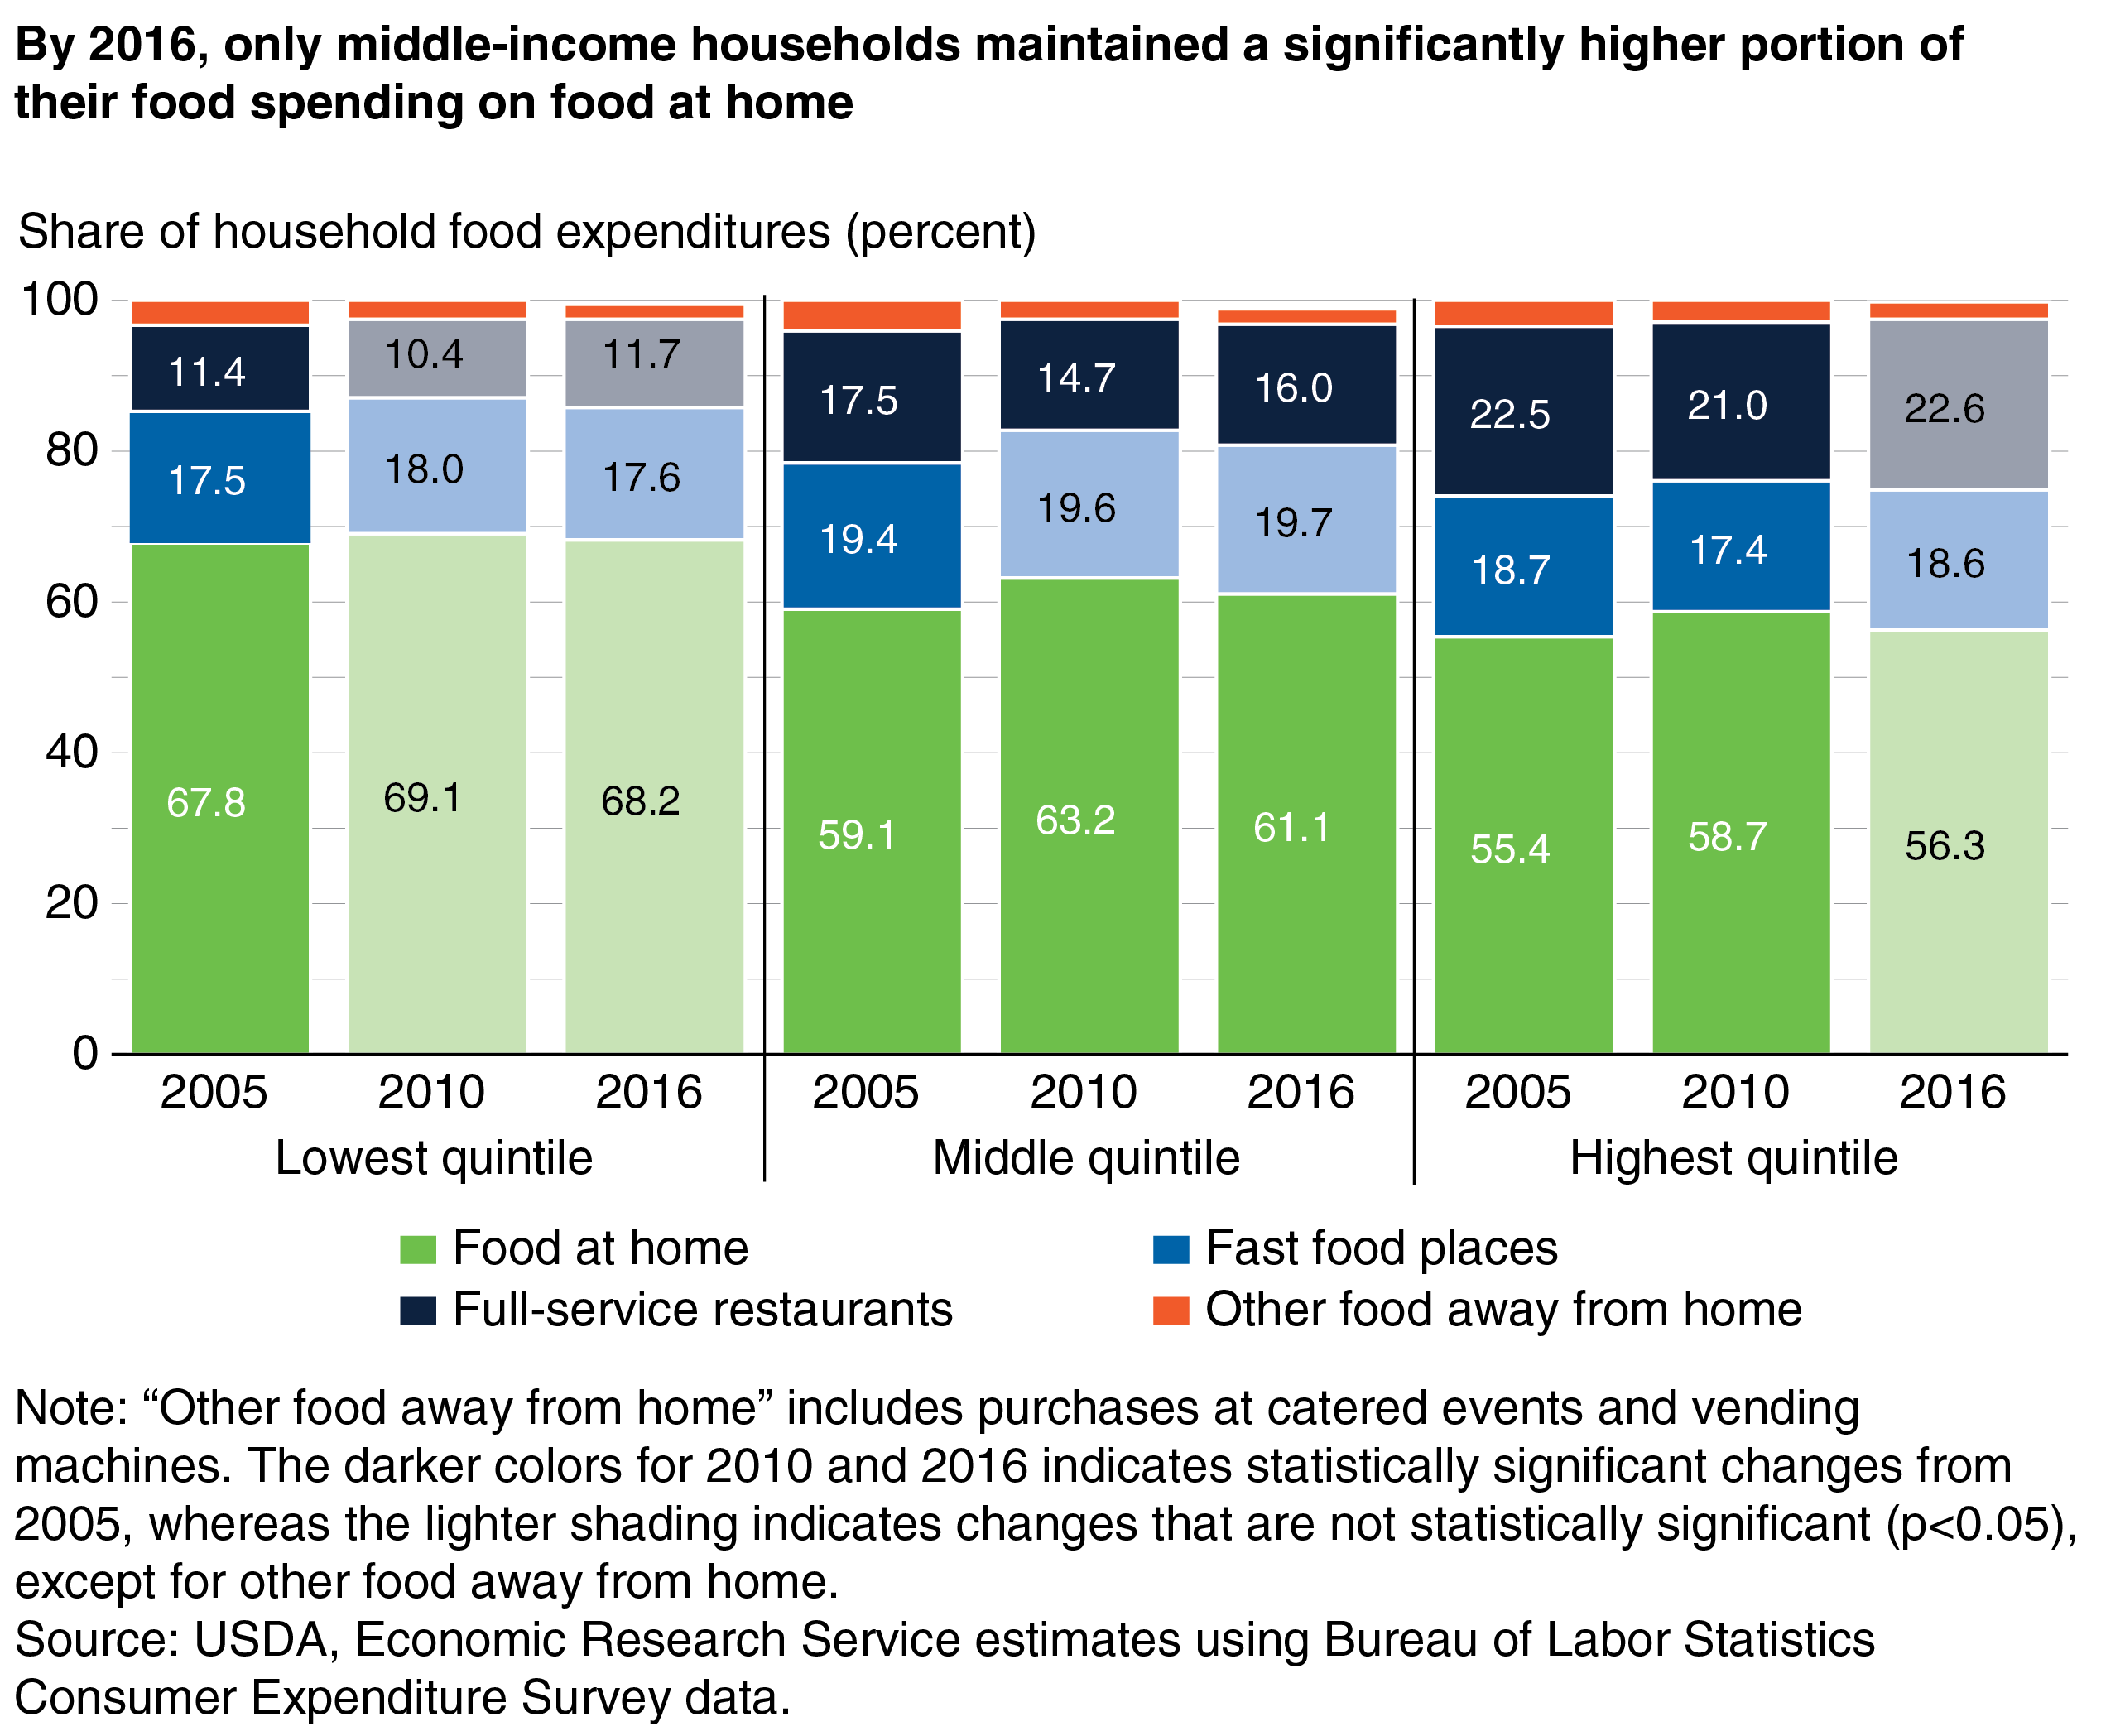
Among all households, those in the highest income quintile allocated the largest share of their food budgets to food away from home, while those in the lowest income quintile allocated the least. This difference is largely due to a greater share of spending at full-service restaurants among the highest income households. While the share allocated to fast-food restaurants was relatively similar across all three quintile groups (between 17 and 20 percent), households in the highest income quintile allocated at least 10 percentage points more to full-service restaurants than households in the lowest income quintile.
During the Great Recession, the highest income households decreased their share of food spending at both fast-food and full-service restaurants, while middle and lower income households decreased their share at full-service restaurants only. By 2016, the shares of food spending at full-service restaurants and fast-food places had returned to 2005 levels for the lowest and highest income households. For middle-income households, the share of food spending at full-service restaurants in 2016 remained significantly below the share in 2005. In addition, middle-income households in 2016 continued to maintain a significantly higher share of their food spending on food at home, while shares for households in the lowest and highest income quintiles returned to 2005 levels.
Households With an Elderly Member Adjusted Food Spending Less Than Other Households
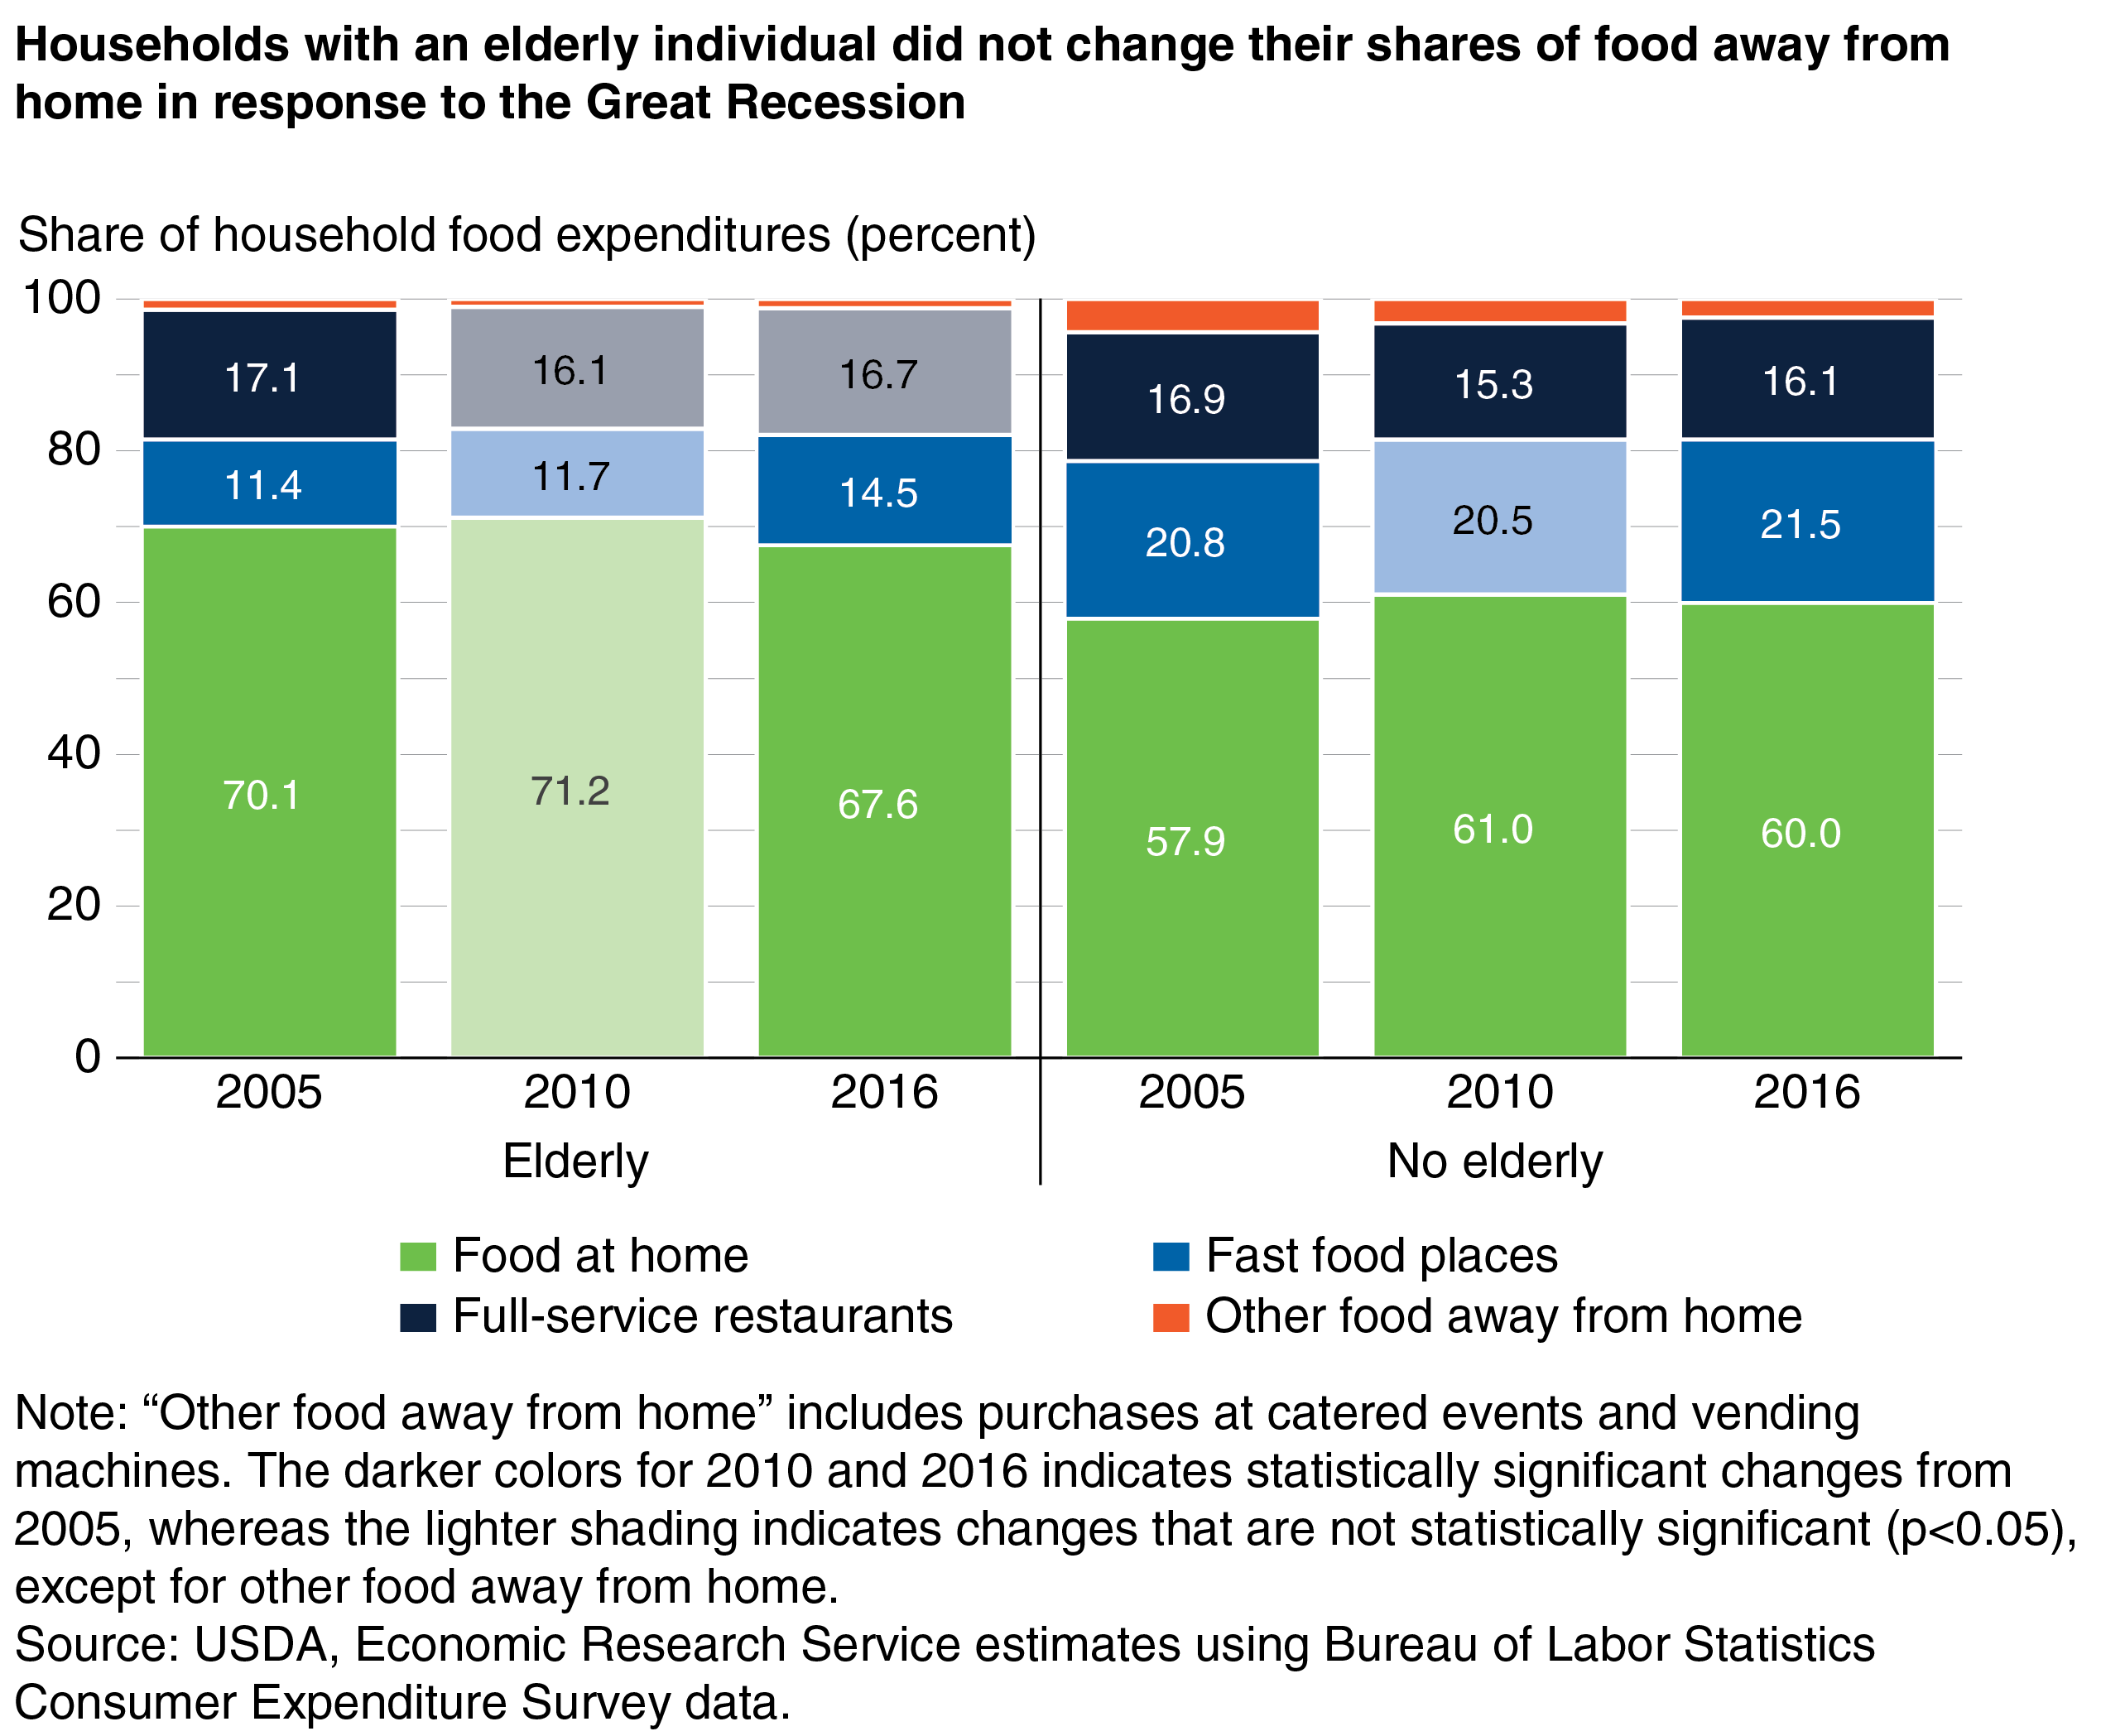
Households with an elderly member tend to be less affected by economic downturns, possibly because they tend to have a more fixed income from Social Security or pensions that is not dependent upon employment. ERS researchers found that food spending among elderly households (those with an individual age 65 or older) did not significantly change throughout the recession. By 2016, elderly households had increased their inflation-adjusted food spending by $165 per capita (6 percent) above the 2006 level. In contrast, food spending in households without an elderly individual decreased by $230 per capita (8 percent) between 2006 and 2010 but had returned to pre-recession levels by 2015.
Similar to their average food expenditures, from 2005 to 2016, elderly households did not have significant changes in the share of food spending allocated to grocery stores and eating-out options. By 2016, these households had reduced their food-at-home expenditures by about 3 percentage points and increased their share of spending at fast-food restaurants instead. Nevertheless, this group’s share of expenditures allocated to fast food remained below that of households without an elderly member. Households with an elderly individual tend to spend a smaller share of their food budget eating out. Older adults may have more time to prepare meals at home, and dietary restrictions could make eating at home the preferred option.
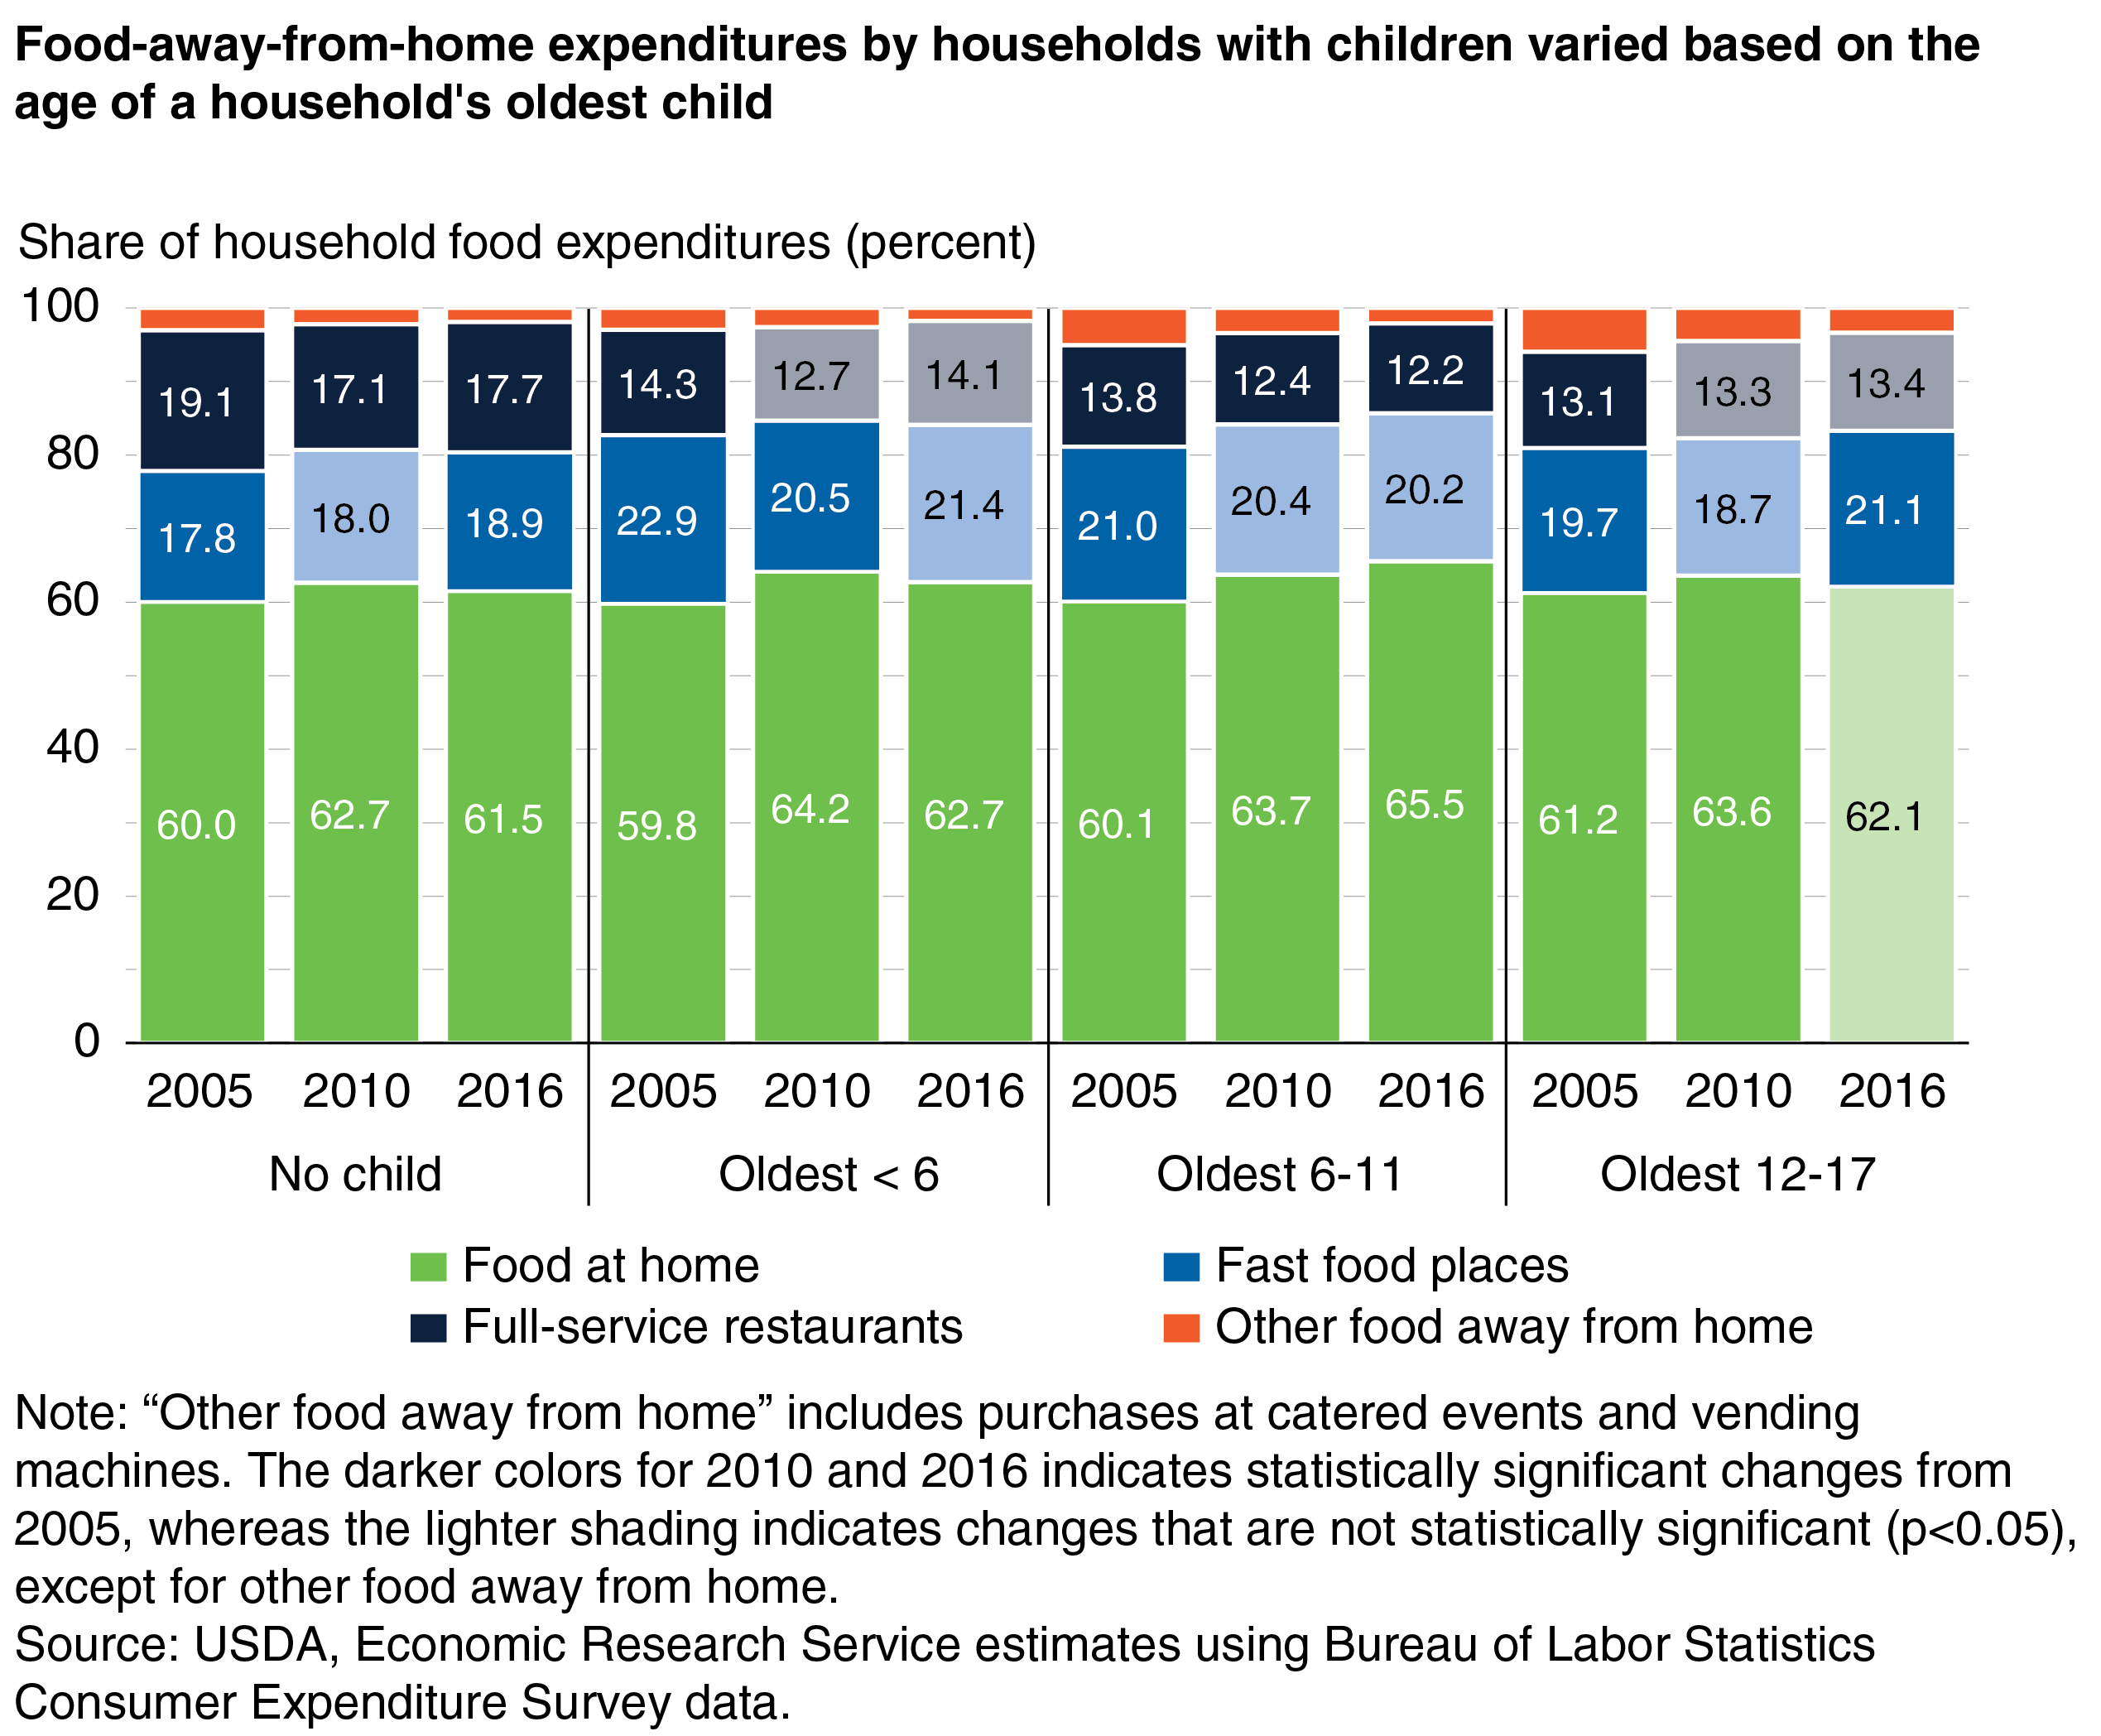
Households With Children Decreased Eating-Out Spending Differently Based on Age of Oldest Child
Households with children (an individual younger than age 18) tend to be larger than households without children, allowing them to use economies of scale when buying food and preparing meals. A larger family can make use of larger sized containers—gallons of milk, whole chickens, larger loaves of bread—and feed the family members at a lower per person cost than smaller households. This can make it easier for families to economize on their food spending when faced with tighter budgets.
From 2005 to 2010, households with children reduced their per capita inflation-adjusted food expenditures by $203 (10 percent) on average, while childless households reduced their expenditures by $91 (3 percent). Among households with children, those with an oldest child age 6-11 had a 10-percent decline in food expenditures; households with an oldest child age 5 or younger or age 12-17 reduced expenditures by 7 and 8 percent, respectively.
By 2016, inflation-adjusted food spending by childless households had recovered to pre-recession levels, while spending by the average household with children remained 4 percent below the level in 2005. The slow recovery among households with children was driven by those with an oldest child age 6-11. Food spending by households with an oldest child age 5 or younger had returned to pre-recession levels by 2016, while spending by households with an oldest child age 12-17 remained only $25 (1 percent) below the level in 2005. In contrast, food spending in 2016 by households with an oldest child age 6-11 remained $135 (10 percent) below the 2005 level. It could be that households with children younger than 6 supplemented their food spending with benefits from USDA’s Special Supplemental Nutrition Program for Women, Infants, and Children (WIC), while households with an oldest child age 12-17 may have included children who were able to help more with household tasks, freeing their parents to work additional hours for pay. Older children may have even earned some extra money themselves for the family’s food budget. Children age 6-11 from low-income households may have relied on free school lunches and breakfasts for meals, allowing their households to maintain reduced food expenditures.
The average household with children spends a slightly larger share of per capita expenditures on food at home than childless households and eats out less frequently (see box “Income, Education, and Children in the Household Affect the Frequency of Purchasing Food Away From Home”). Households with children may “eat in” more often for a variety of reasons—economies of scale in meal preparation, earlier bedtimes, and older children helping prepare food at home.
During the Great Recession, households with and without children increased the share of their food budget spent at the grocery store, with all households except those with an oldest child age 12-17 maintaining this trend through 2016. Childless households and those with an oldest child age 6-11 decreased their share of expenditures at full-service restaurants and maintained these lower shares throughout the recovery. Most households maintained their share of food expenditures allocated to fast-food restaurants during the Great Recession; only households with an oldest child younger than 6 reduced their fast-food share. In fact, by 2016, childless households and those with an oldest child age 12-17 increased their share of expenditures at fast-food restaurants.
Food Spending by Middle-Income Households Was Still Below Pre-Recession Levels in 2016
The Great Recession affected many sectors of the U.S. economy, including consumers’ spending at grocery stores and at restaurants. Total household food spending, adjusted for inflation, did not return to pre-recession levels until 2015, highlighting the severity of the prolonged recovery. While food expenditures among households in the lowest and highest income quintiles were above 2005 levels in 2016, average per capita food expenditures among middle-income households had not returned to pre-recession levels by 2016, suggesting these households may still be recovering from the Great Recession.
The share of overall food spending allocated to food away from home stood at 38.8 percent in 2016, below the 40.5-percent share before the 2007-09 recession, as some households have continued to spend more of their food budgets at grocery stores. Some households may be continuing to struggle financially, or perhaps there has been a general shift away from eating out towards eating in. As grocery stores continue to expand their offerings of ready-to-take-home-and-eat foods, consumers may see these foods as a lower cost, time-saving alternative to foods from restaurants and other eating-out places.
This article is drawn from:
- Saksena, M., Okrent, A., Anekwe, T.D., Cho, C., Dicken, C., Effland, A., Elitzak, H., Guthrie, J., Hamrick, K., Jo, Y., Lin, B., Mancino, L., McLaughlin, P.W., Rahkovsky, I., Ralston, K., Smith, T.A., Stewart, H., Todd, J.E., Tuttle, C. & Hyman, J. (2018). America’s Eating Habits: Food Away From Home. U.S. Department of Agriculture, Economic Research Service. EIB-196.
- Todd, J.E. (2014). Changes in Eating Patterns and Diet Quality Among Working-Age Adults, 2005-2010. U.S. Department of Agriculture, Economic Research Service. ERR-161.
You may also like:
- Kumcu, A. & Kaufman, P. (2011, September 1). Food Spending Adjustments During Recessionary Times. Amber Waves, U.S. Department of Agriculture, Economic Research Service.
- FoodAPS National Household Food Acquisition and Purchase Survey. (n.d.). U.S. Department of Agriculture, Economic Research Service.