
Per Capita Red Meat and Poultry Disappearance: Insights Into Its Steady Growth
- by Keithly Jones, Mildred Haley and Alex Melton
- 6/4/2018
Per capita red meat and poultry disappearance (the amount used in domestic markets, including fresh and processed meat sold through grocery stores and used in restaurants) is expected to reach record highs in 2018, eclipsing the previous high in 2004. Based on USDA forecasts, in 2018, Americans will have access to 222.4 pounds of red meat and poultry on a per capita retail weight basis. Average annual per capita disappearance of beef decreased 0.3 percent annually from 2000 to 2015 but has increased since 2016 and is expected to grow by 3.7 percent in 2018. Per capita disappearance of pork is forecasted to grow by 4.2 percent in 2018, well above its average annual growth rate of 0.1 percent since 2000. Per capita disappearance of broilers (young chickens), however, is expected to grow just 1.1 percent in 2018, slightly below its 10-year average. Rising meat demand in the U.S. has been supported by sustained economic growth since the 2009 Great Recession and stable to declining retail prices brought about by low animal feed costs.
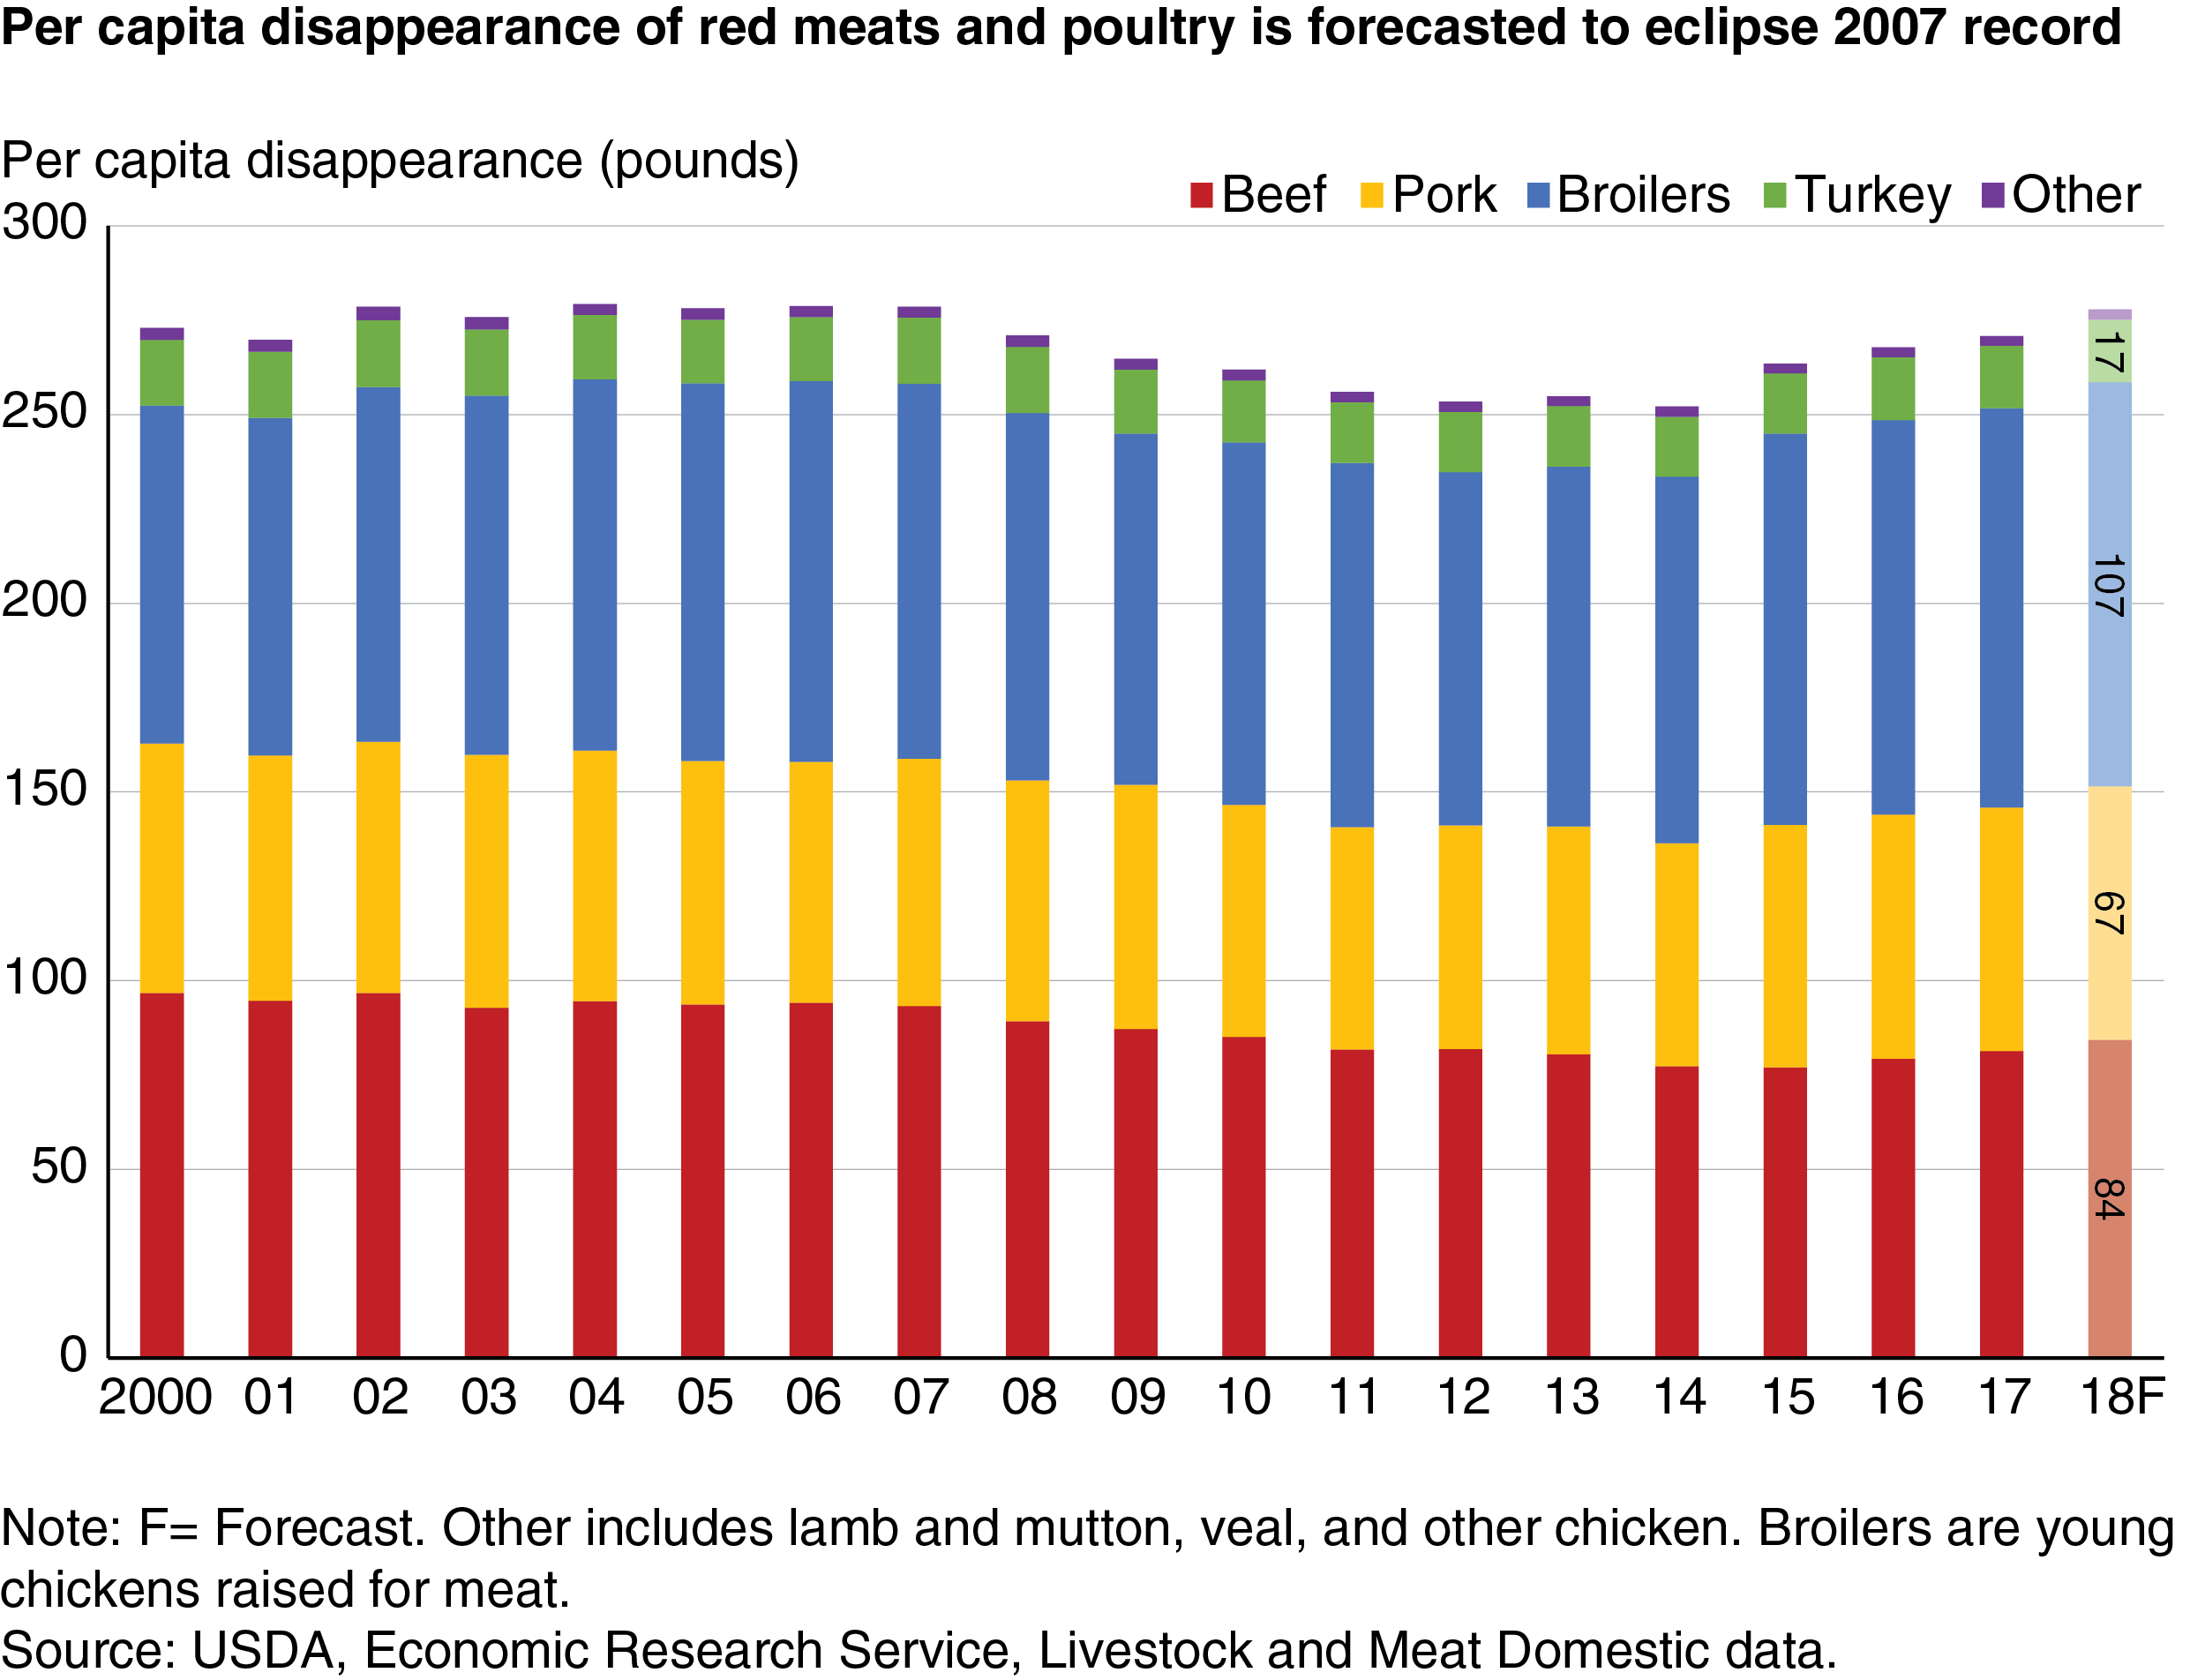
USDA calculates per capita meat disappearance as a measure of total supply per capita (supply minus exports and ending stocks). Since the measure is based entirely on supply, it does not account for food waste, meat used for pet food, and any other nonfood uses of livestock and poultry meat products. USDA also publishes loss adjusted food availability data in the ERS Food Availability (Per Capita) Data System data product, but the data look at past years rather than providing estimates or forecasts. As a result, while disappearance is commonly used as a proxy for consumption, it likely overestimates actual consumer use of these products.
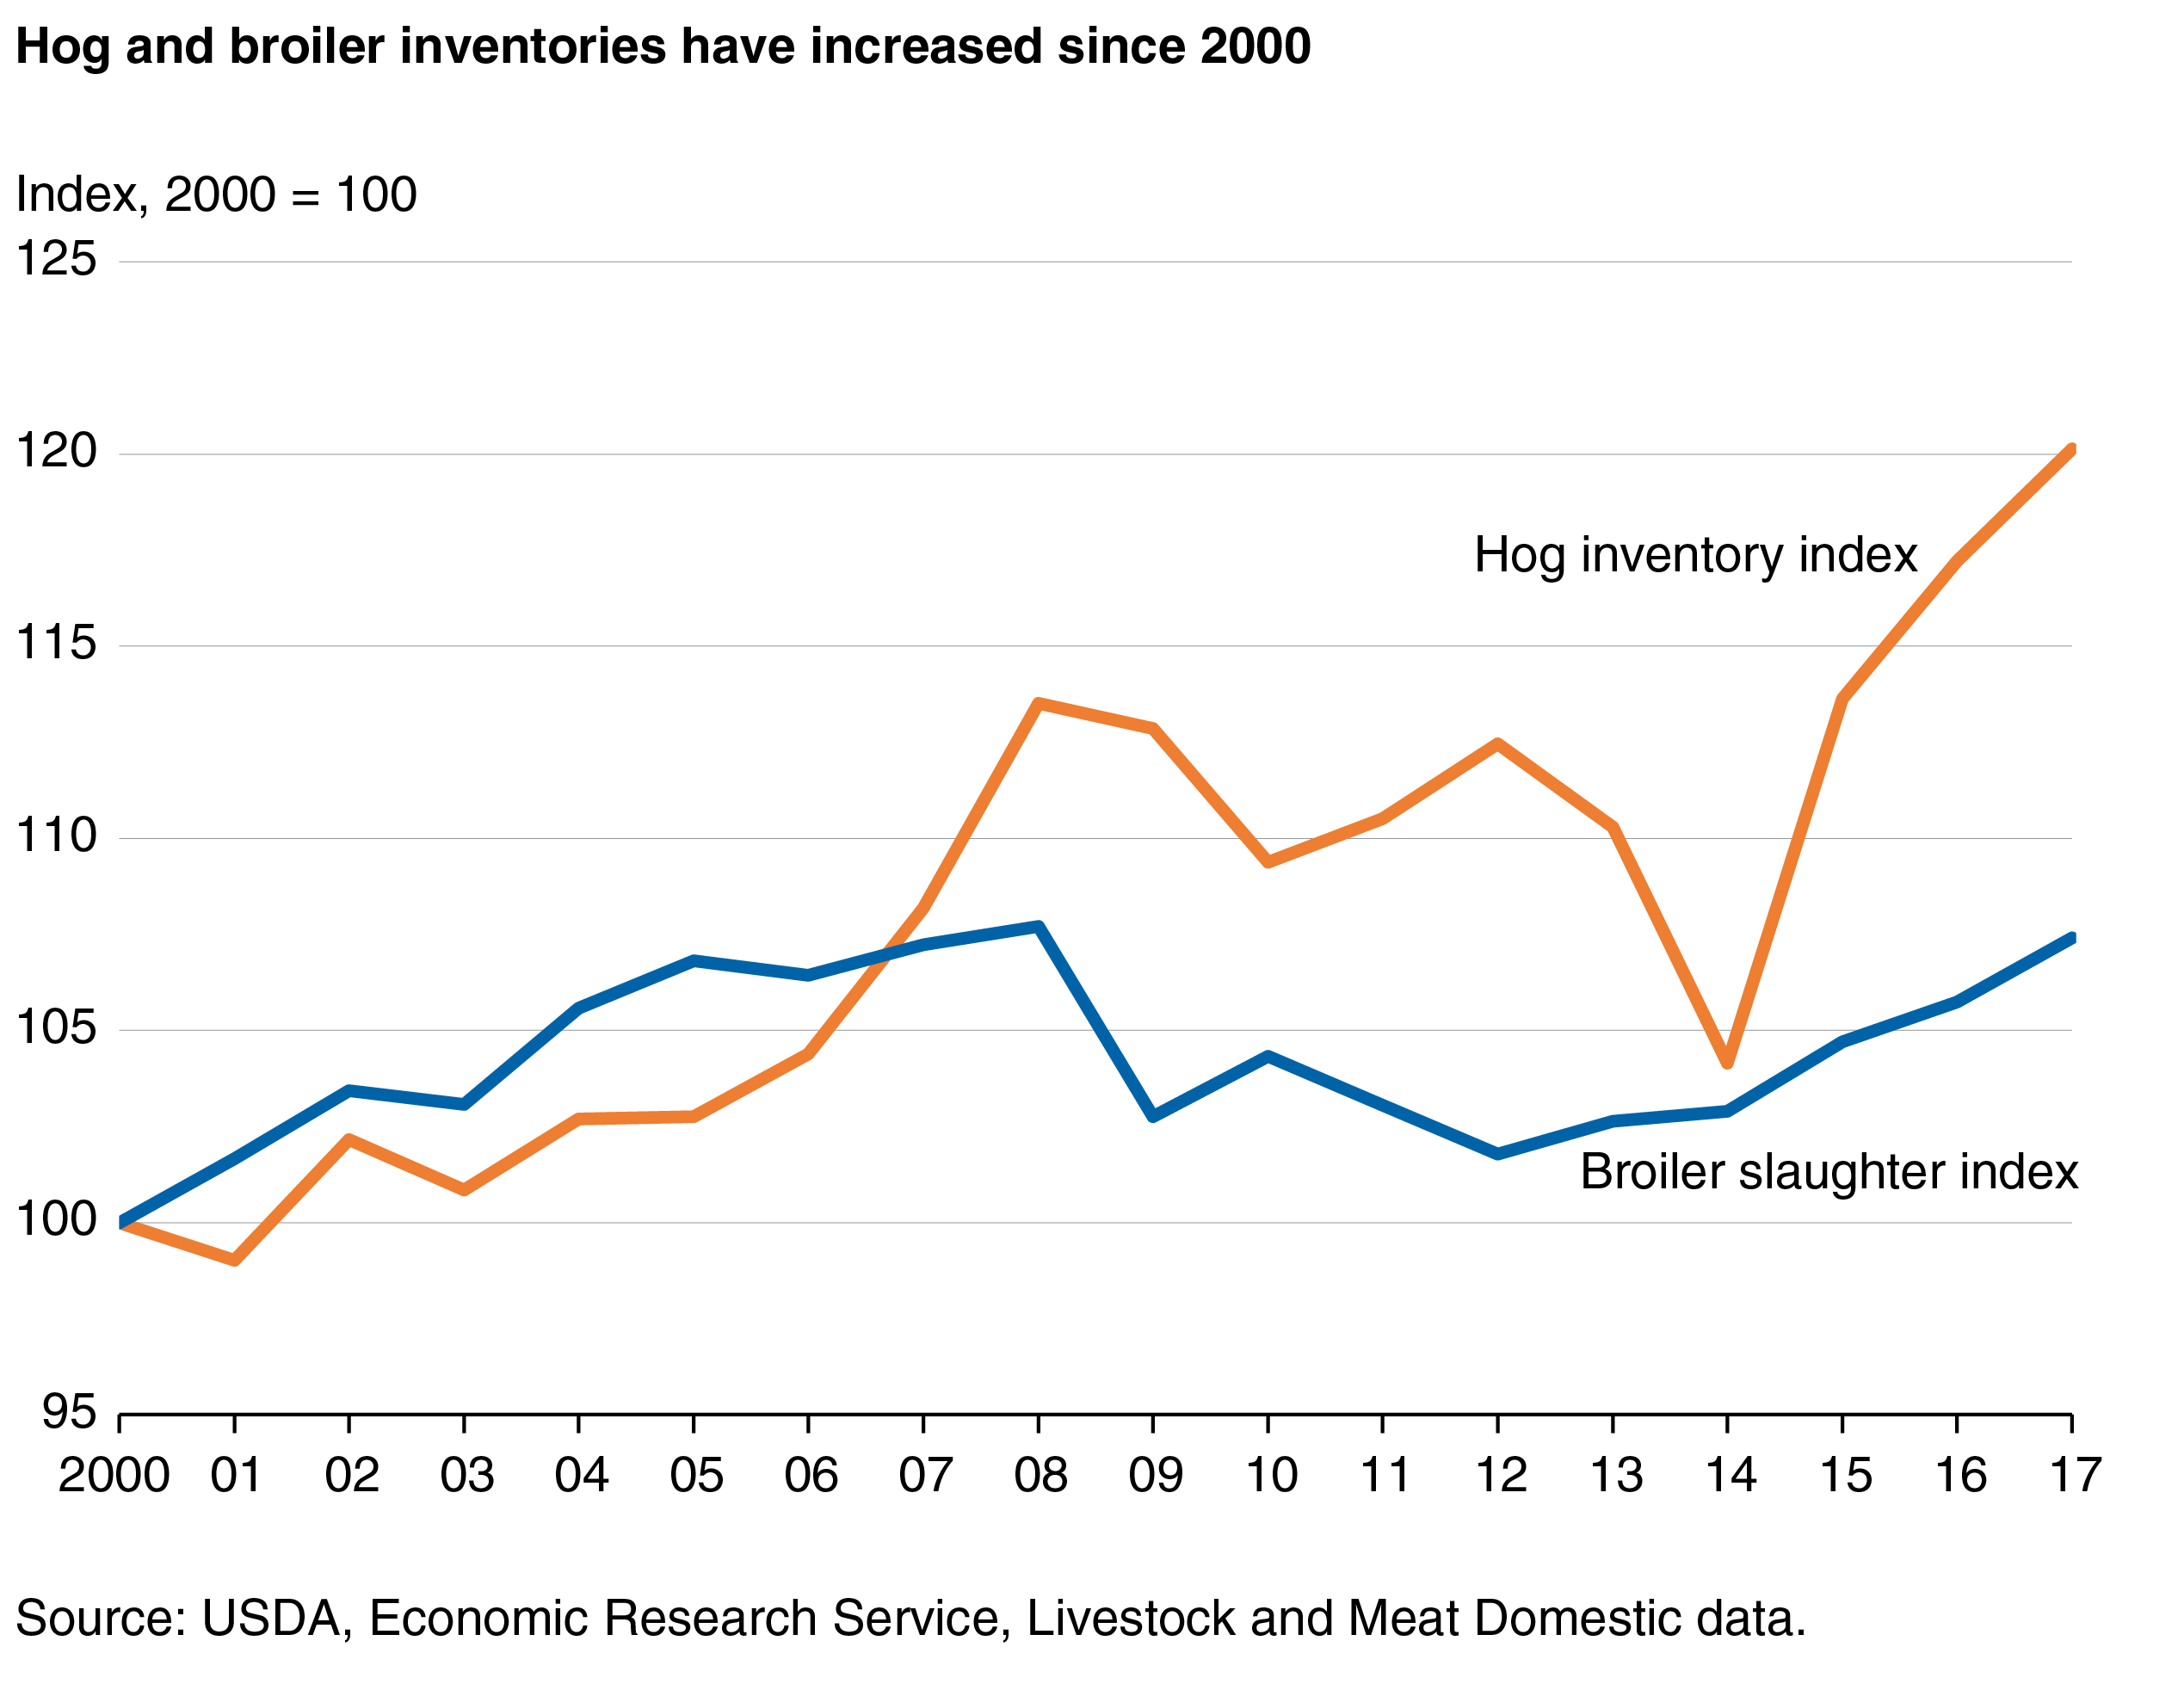
Larger hog and broiler inventories are among the factors that have contributed to greater red meat and poultry production and disappearance since 2000, coupled with the growing global demand for high-value animal protein. In the hog sector, animal numbers have increased sharply. In 2000, the beginning inventory of all hogs was about 59 million head. By 2018, the all-hog inventory numbered more than 73 million head. The 14-million-head increase represents a gain of more than 23 percent since 2000. Much the same is true for the U.S. broiler industry: more birds, slaughtered at heavier weights, have largely driven higher U.S red meat and poultry disappearance. In 2000, slaughter of broilers totaled more than 8.2 billion; in 2016, almost 8.8 billion broilers were slaughtered, an increase of more than 6 percent.
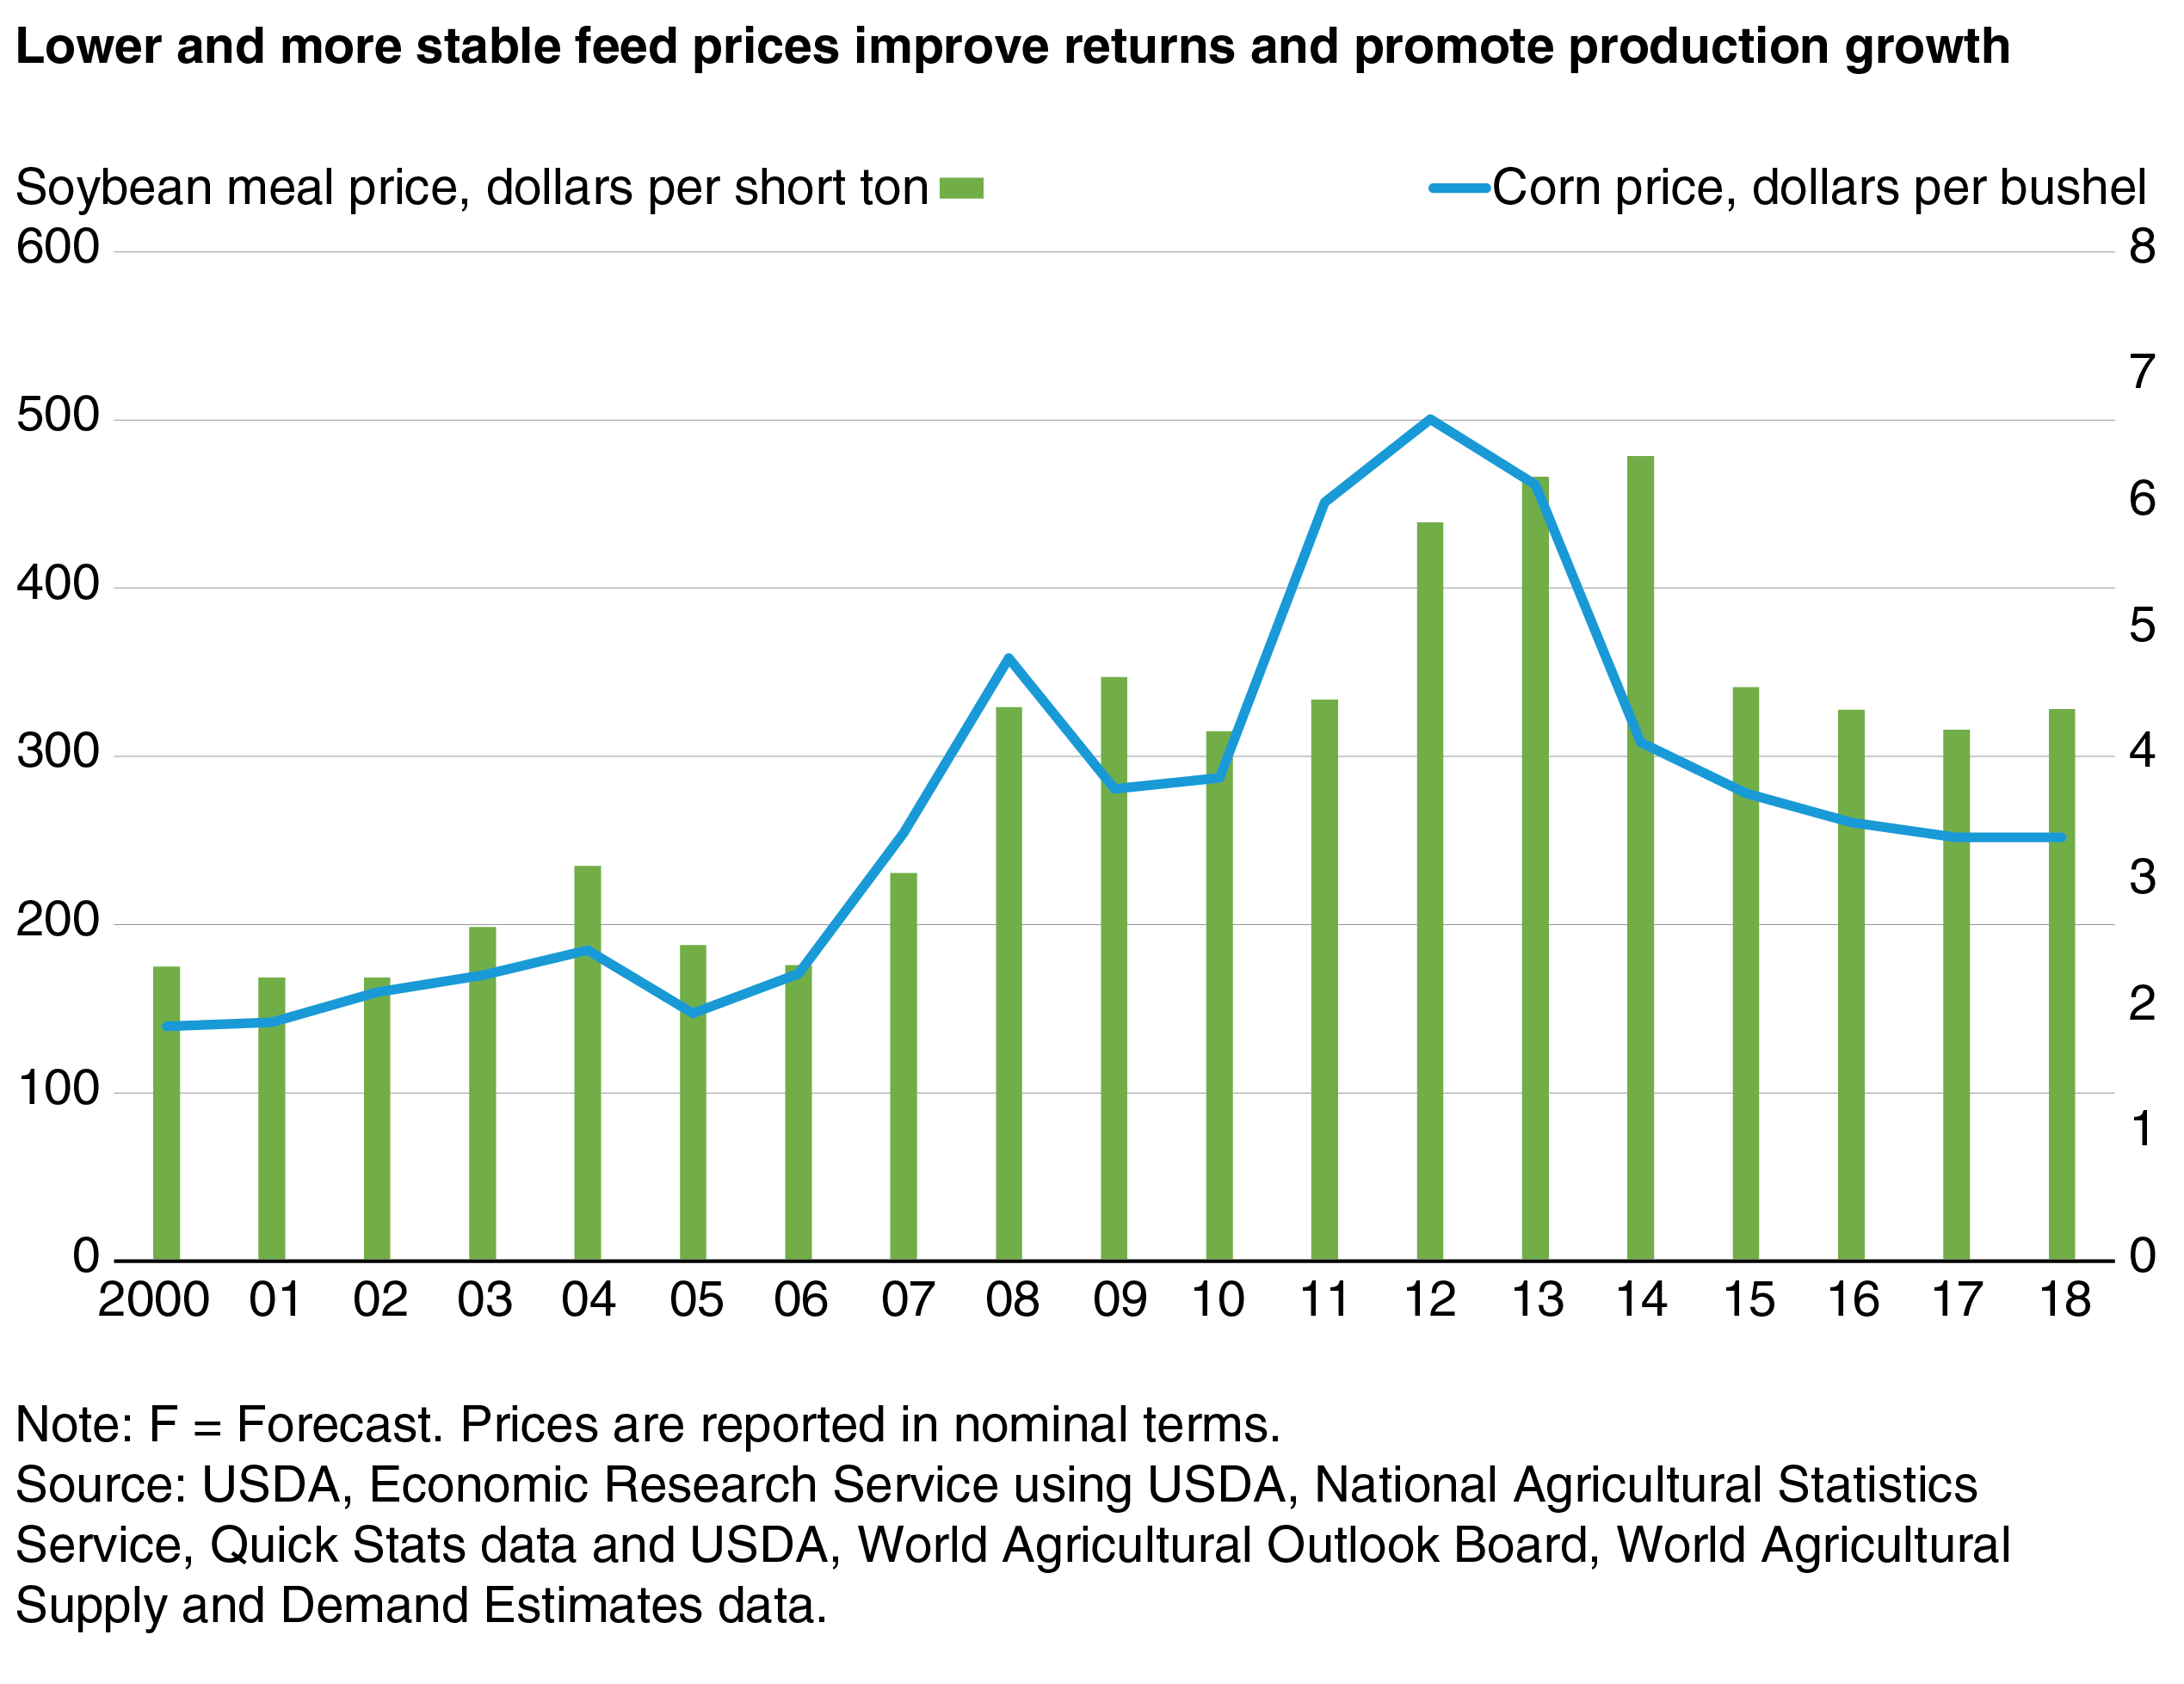
Relatively low and stable feed grain prices are contributing to production growth. In 2018, both corn and soybean meal are expected to be at or near their price levels in 2004, when per capita disappearance of red meat and poultry was last at its highest. Feed and food prices spiked between 2008 and 2013, with corn prices, in nominal terms, exceeding $6.50 per bushel and soymeal prices exceeding $460 per short ton. Higher feed prices impacted costs for livestock and meat producers, reducing incentives to expand production. The return to lower feed grain prices is supporting the profitability of livestock and poultry producers. U.S. and global production of corn and soybeans is expected to remain strong in the coming years, leading to the continued stability of feed grain prices.
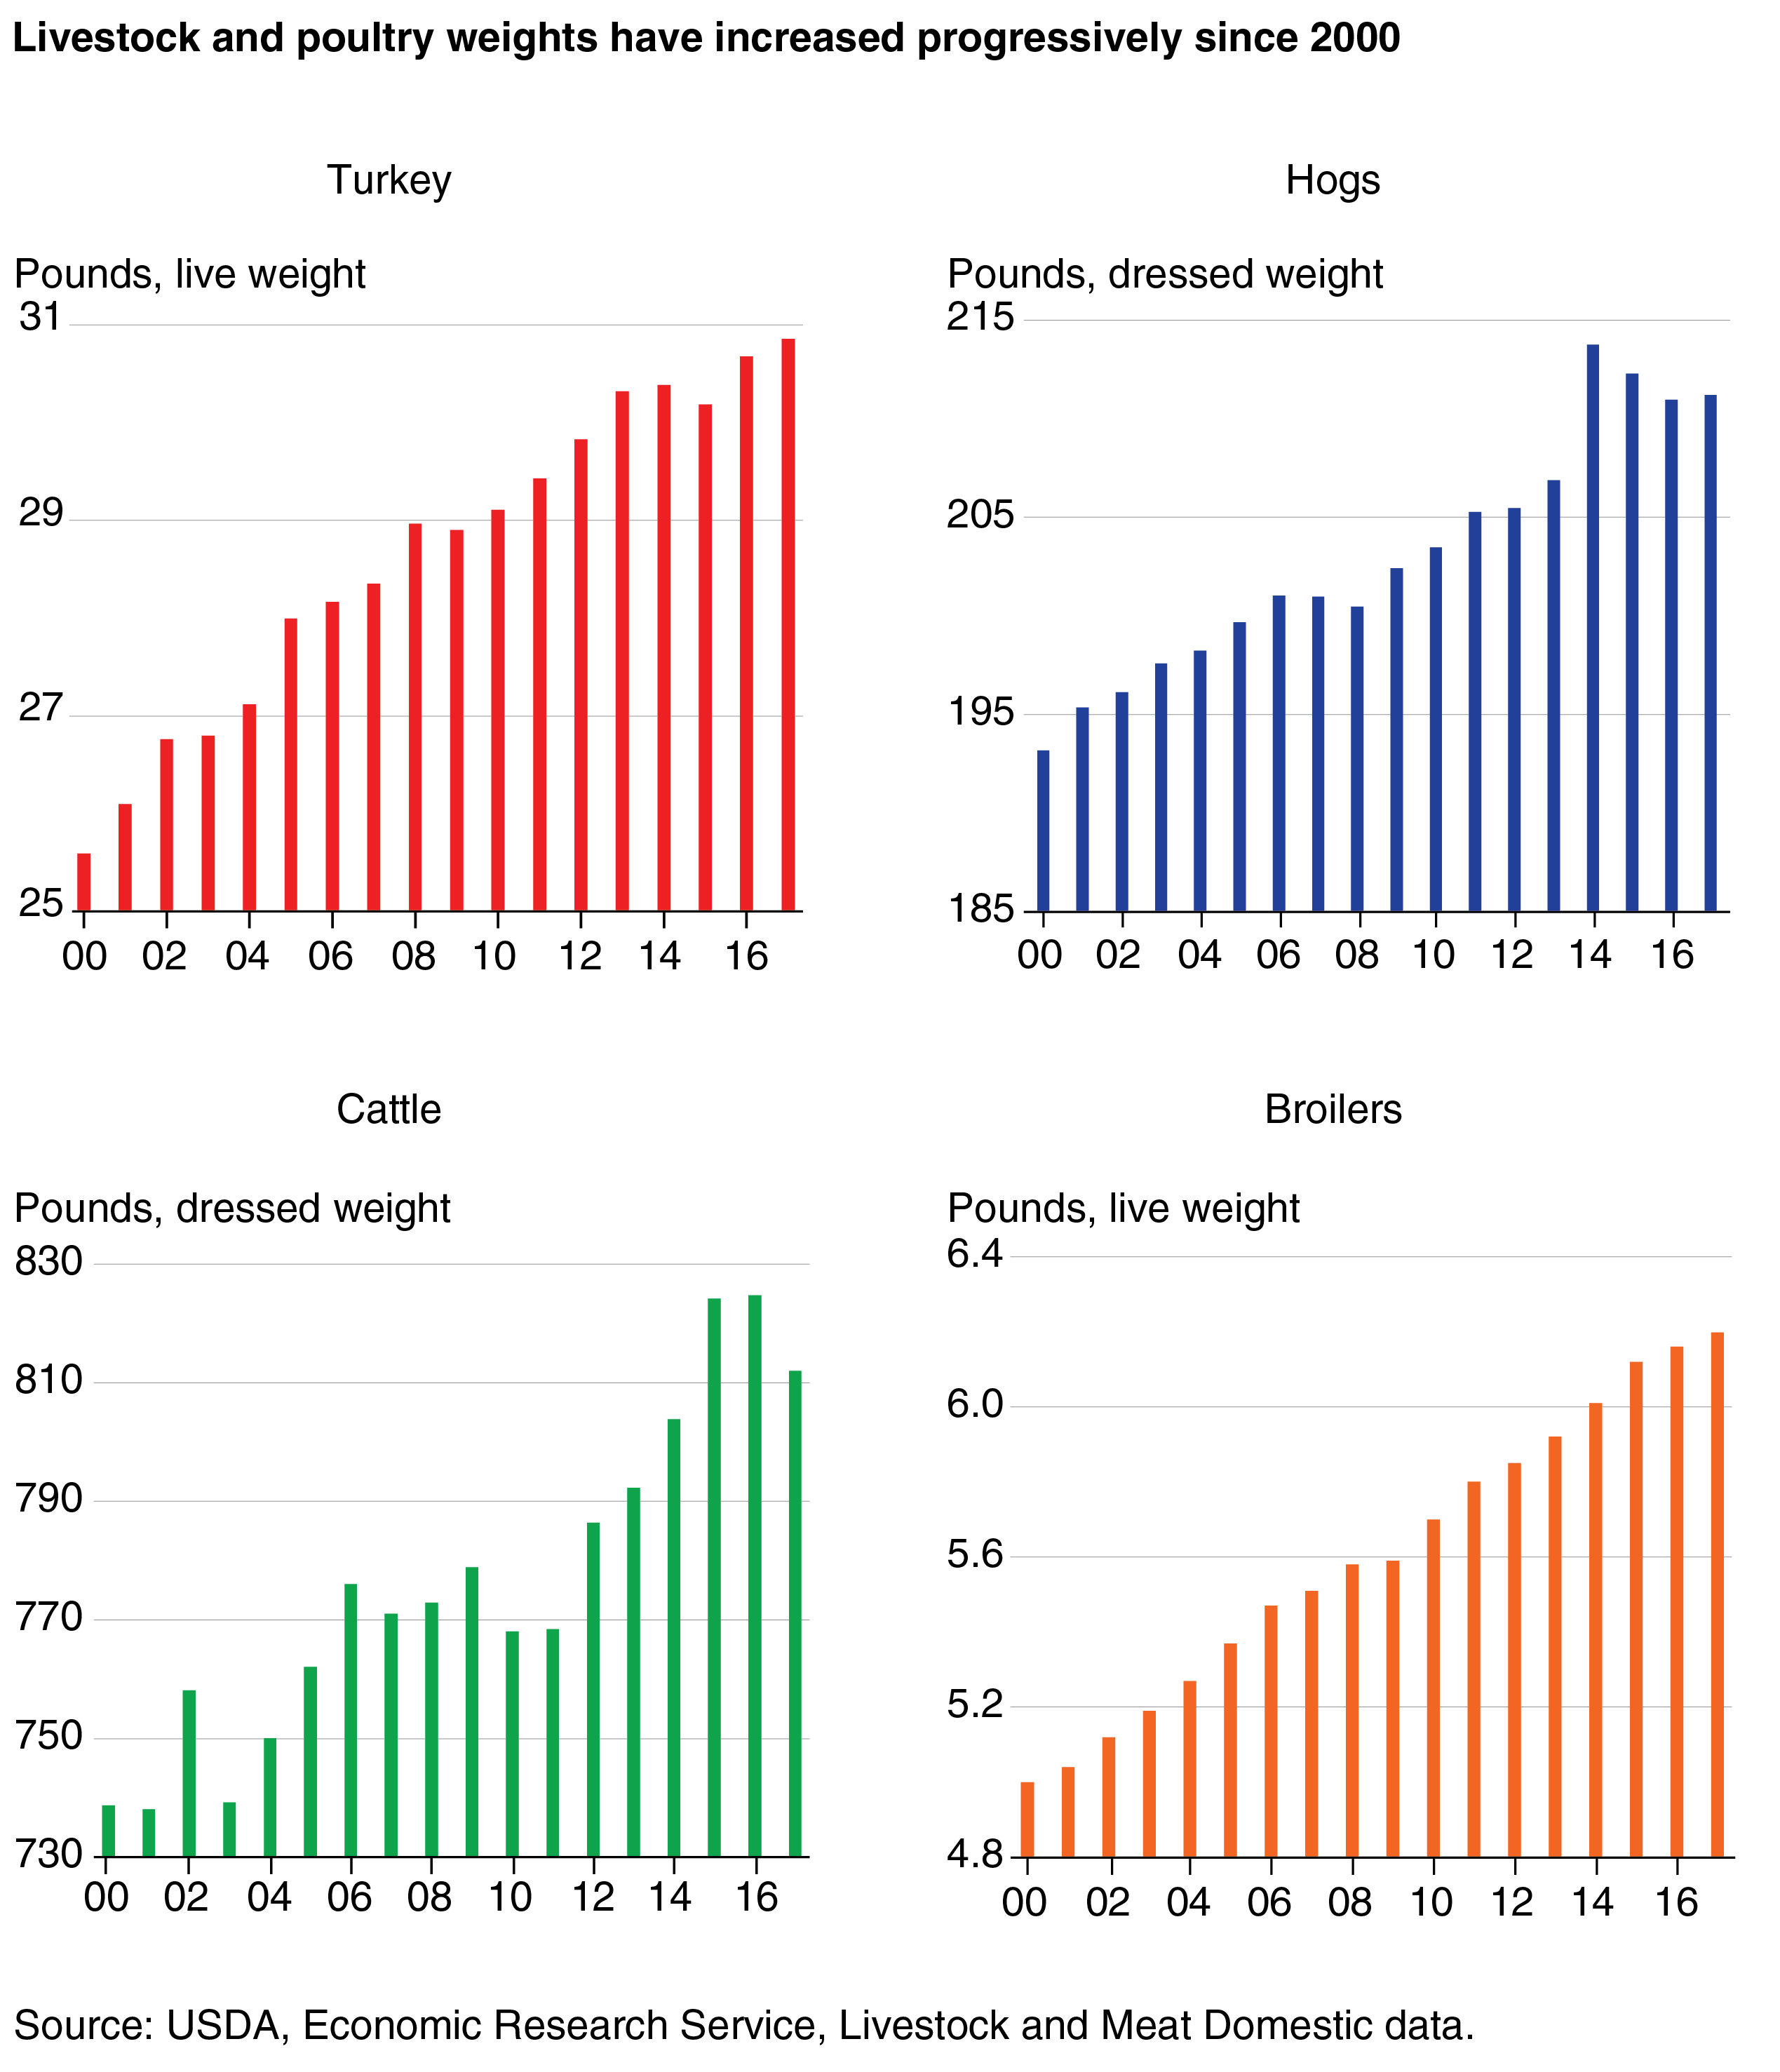
Aside from the availability of relatively cheap feed ingredients, improved feed efficiency has contributed to faster growth and higher animal weights. The long-term trend marked by sustained growth in dressed (butchered) weights and live weights is due, in large part, to improvements in animal genetics through selective breeding and the implementation of modern and improved production systems. As a result, on average, larger animals are being slaughtered in the United States. On a dressed-weight basis, cattle have increased 73 pounds on average since 2000, a gain of 10 percent. At the same time, hogs have increased 18 pounds, or 9 percent. Poultry has also become larger since 2000. On a live-weight basis, turkeys are 5.3 pounds (20.5 percent) larger on average, while broilers are 1.2 pounds (23.9 percent) larger.
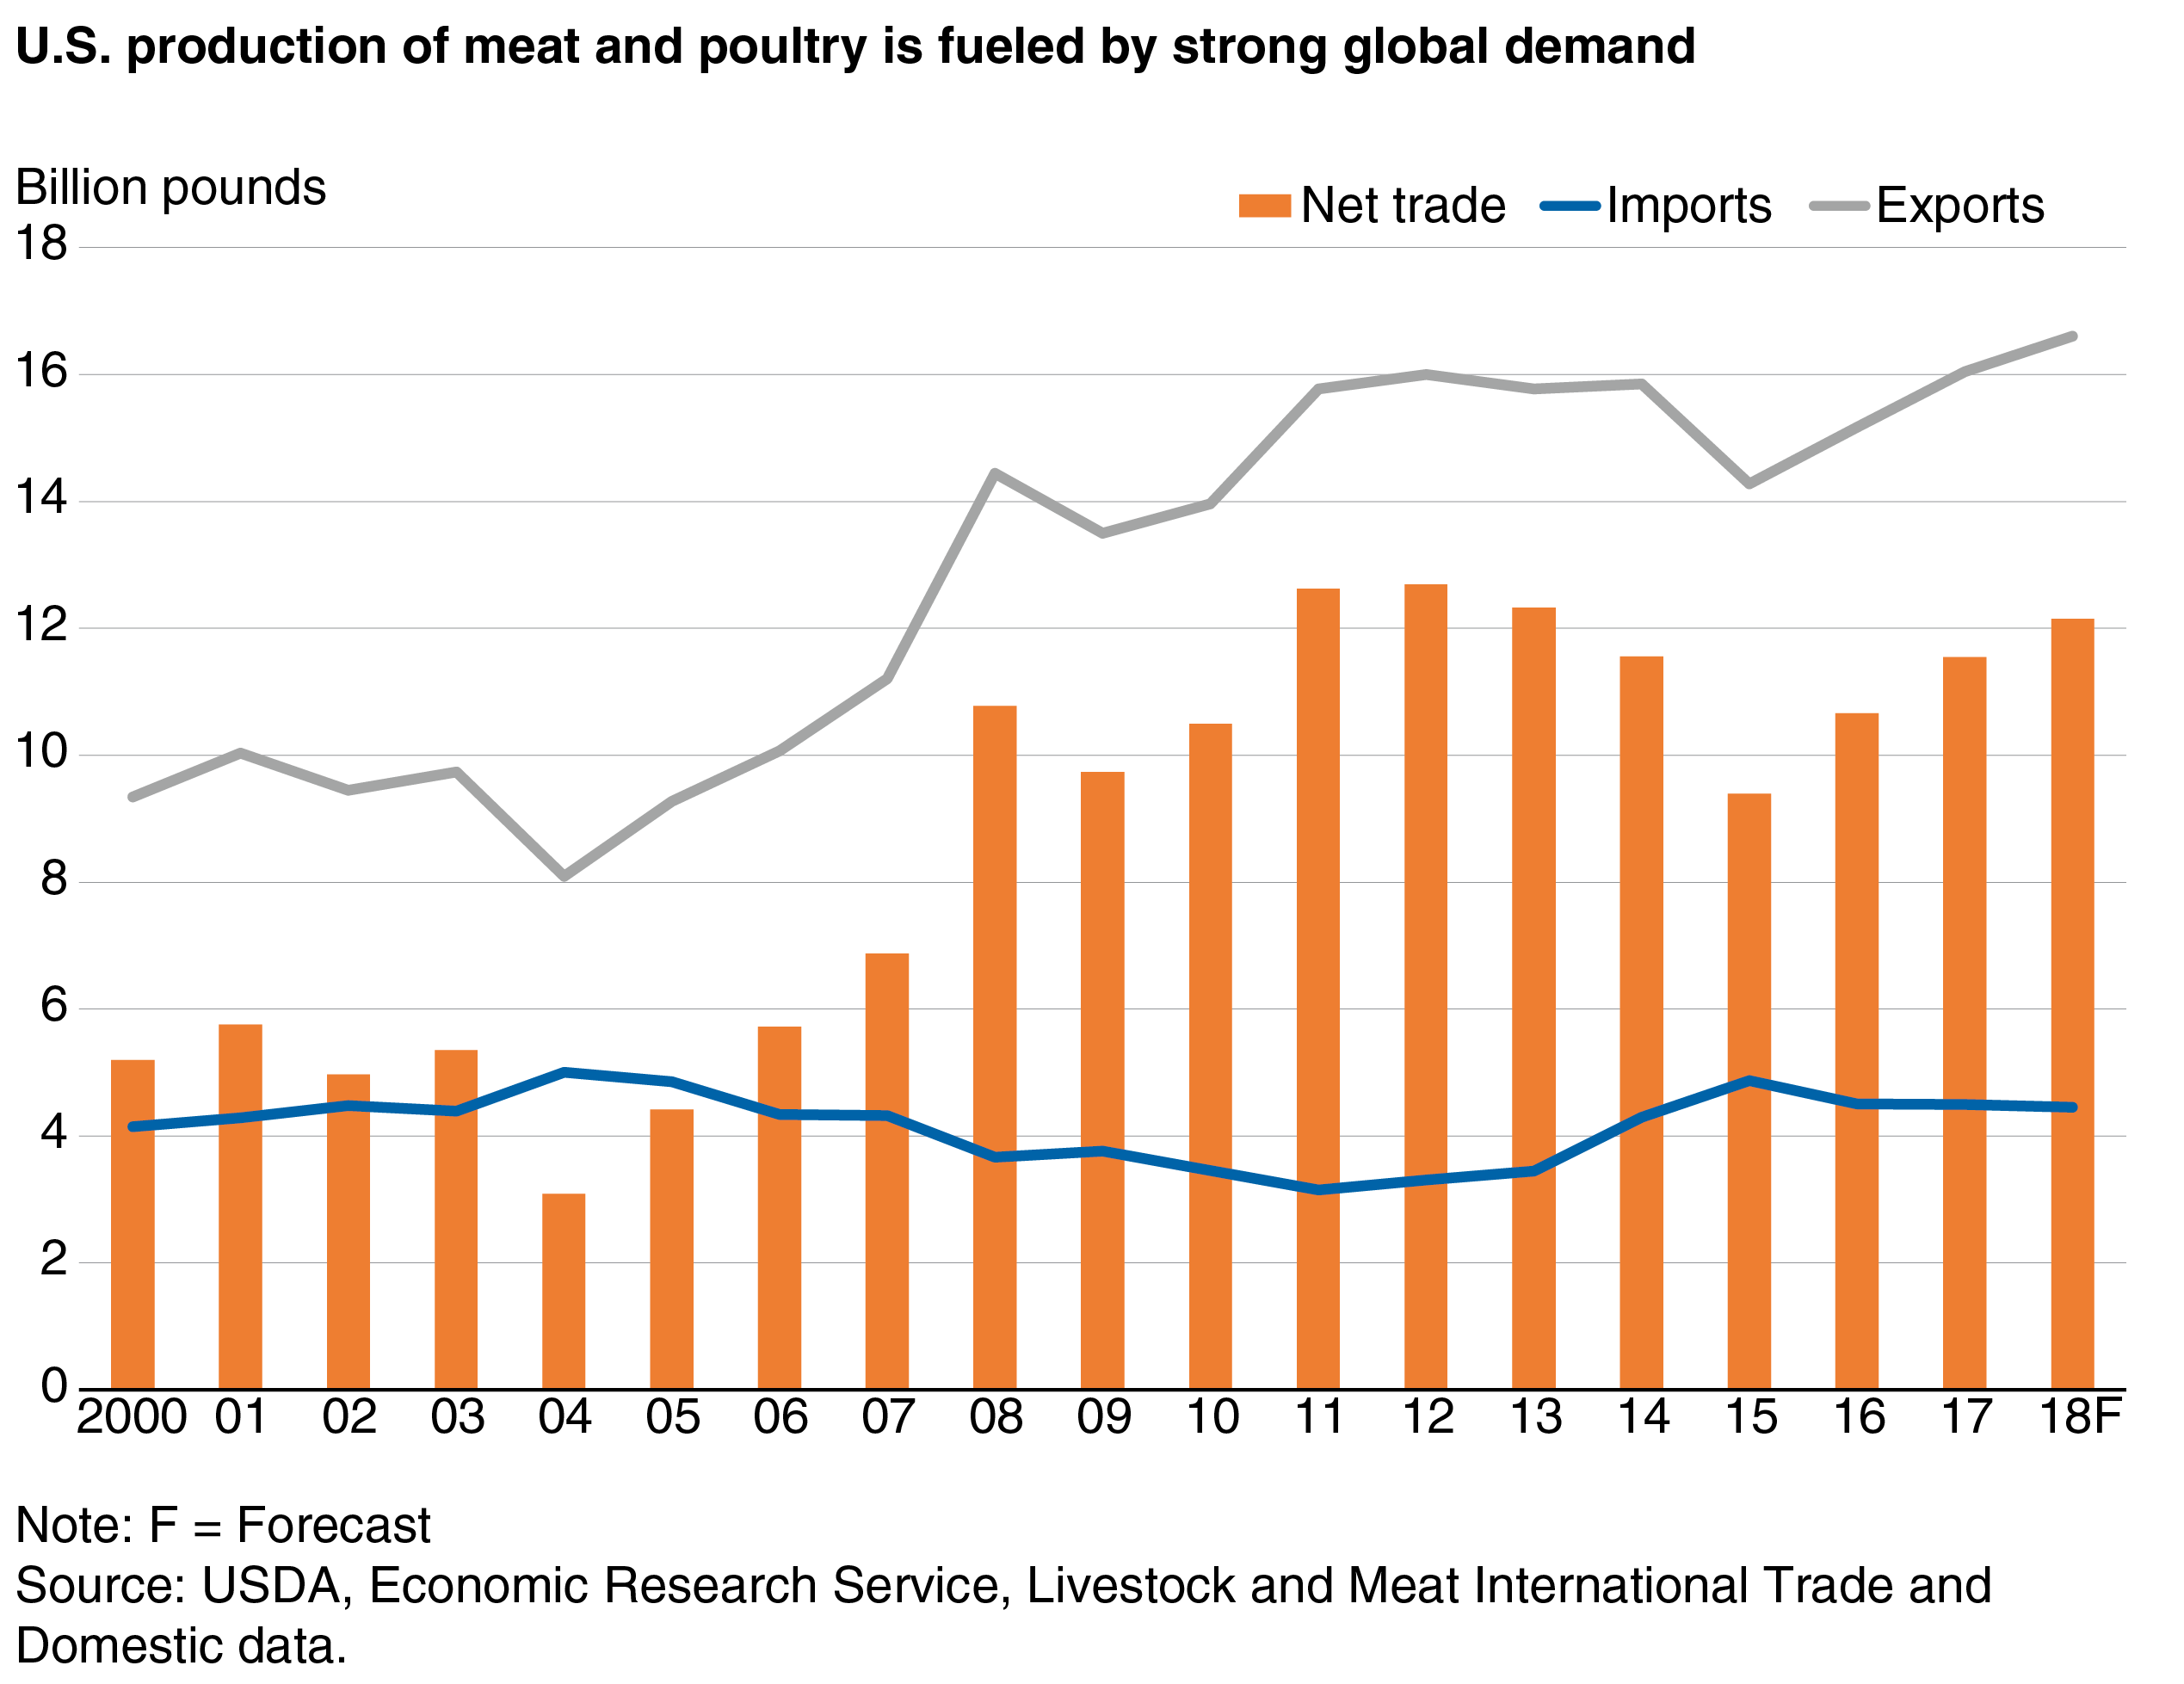
Global meat and poultry demand continues to fuel the growth in U.S. production, driven, in part, by economic expansion in the developing world. This is reflected in trade data. While U.S. meat and poultry imports have remained fairly stable since 2000, U.S. exports of the same goods have grown at an average of 4 percent per year. An increase in global demand has likely contributed to favorable conditions for U.S. exports. As a result, net exports have increased by an average of 7.2 percent since 2000 and are expected to increase a further 5 percent in 2018, or more than 600 million pounds. While net exports continue to grow at a rapid rate, U.S. meat and poultry production is expected to increase 4 percent in 2018, or nearly 4 billion pounds. These gains are sufficient to drive expected per capita meat disappearance higher even as net exports continue to expand. The forecasts and analysis presented in this article are based on current policy in place and do not speculate on policy. As such, they do not reflect potential trade disputes.
This article is drawn from:
- Livestock and Meat Domestic Data. (n.d.). U.S. Department of Agriculture, Economic Research Service.
- Livestock and Meat International Trade Data. (n.d.). U.S. Department of Agriculture, Economic Research Service.
You may also like:
- Haley, M. (2018). Livestock, Dairy, and Poultry Outlook: May 2018. U.S. Department of Agriculture, Economic Research Service. LDP-M-287.