
Understanding Irrigated Agriculture
- by Glenn Schaible
- 6/5/2017
The irrigation of agricultural crops accounts for most (80 percent) of the Nation’s water consumption. That is why U.S. agriculture is central to the challenge of balancing increasing water demands for urban, industrial, and environmental uses.
According to the 2012 Census of Agriculture, irrigated farms represented just 14 percent of U.S. farms, but contributed about 39 percent of the country’s farm sales—over $152 billion. The 17 Western States (including Nebraska, California, and Texas) together accounted for nearly three-quarters of all irrigated farms that year. Farm sales for Western irrigated farms averaged $513,272 per farm, over four times the average for Western dryland farms.
To better understand irrigation characteristics, such as acreage and water use, USDA conducts the Farm and Ranch Irrigation Survey (FRIS) every 5 years. The 2013 FRIS, the most recent survey available, reports data for both irrigation on acres in the open (AIO) as well as horticulture under protection (HUP). Crops irrigated on AIO include corn, wheat, and soybeans as well as vegetables, berries, and nut trees. By comparison, crops irrigated on HUP (such as greenhouses) include floriculture crops, nursery crops, and mushrooms.
In 2013, U.S. farms irrigated about 55.4 million acres. This required the application of more than 88.5 million acre-feet (MAF) of water, equivalent to about 28.8 trillion gallons. The irrigation of AIO accounted for nearly all the water use (98 percent).
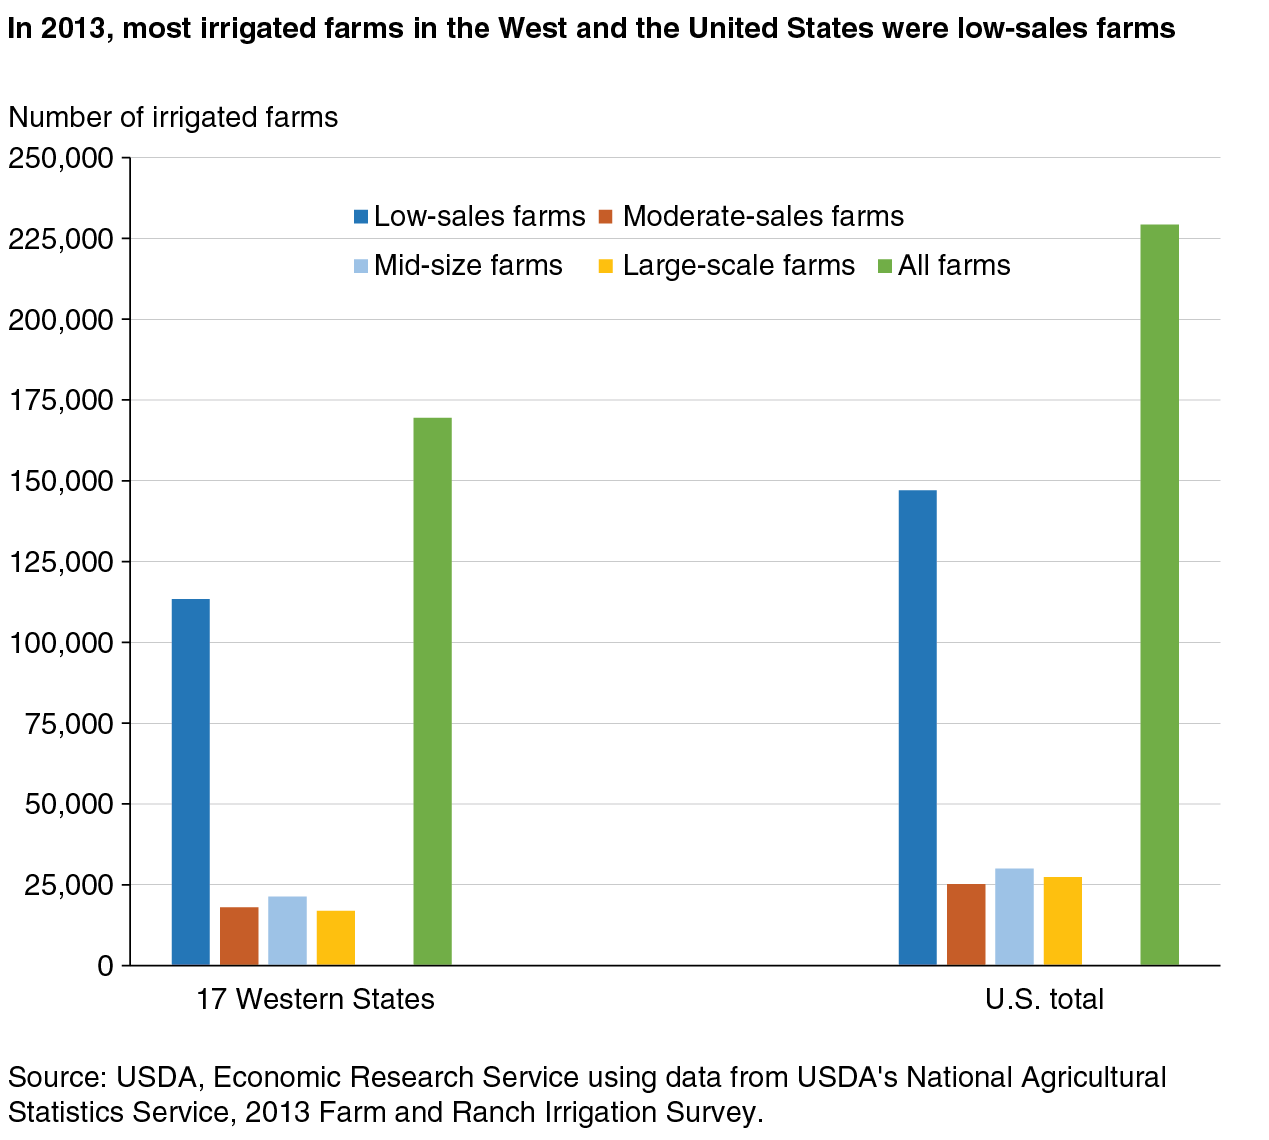
Most Irrigated Farms Are Low-Sales Operations, But Large Farms Use Most of the Water
The distribution of irrigated farms and acres and applied water varies significantly across farm size. Most irrigated farms in 2013 were low-sales operations with under $150,000 in annual farm sales: 67 percent of Western irrigated farms and 64 percent of U.S. irrigated farms. These farms are plentiful in number because they are very small—averaging less than 50 irrigated crop acres per farm, compared to 1,200 acres for large-scale irrigated farms.
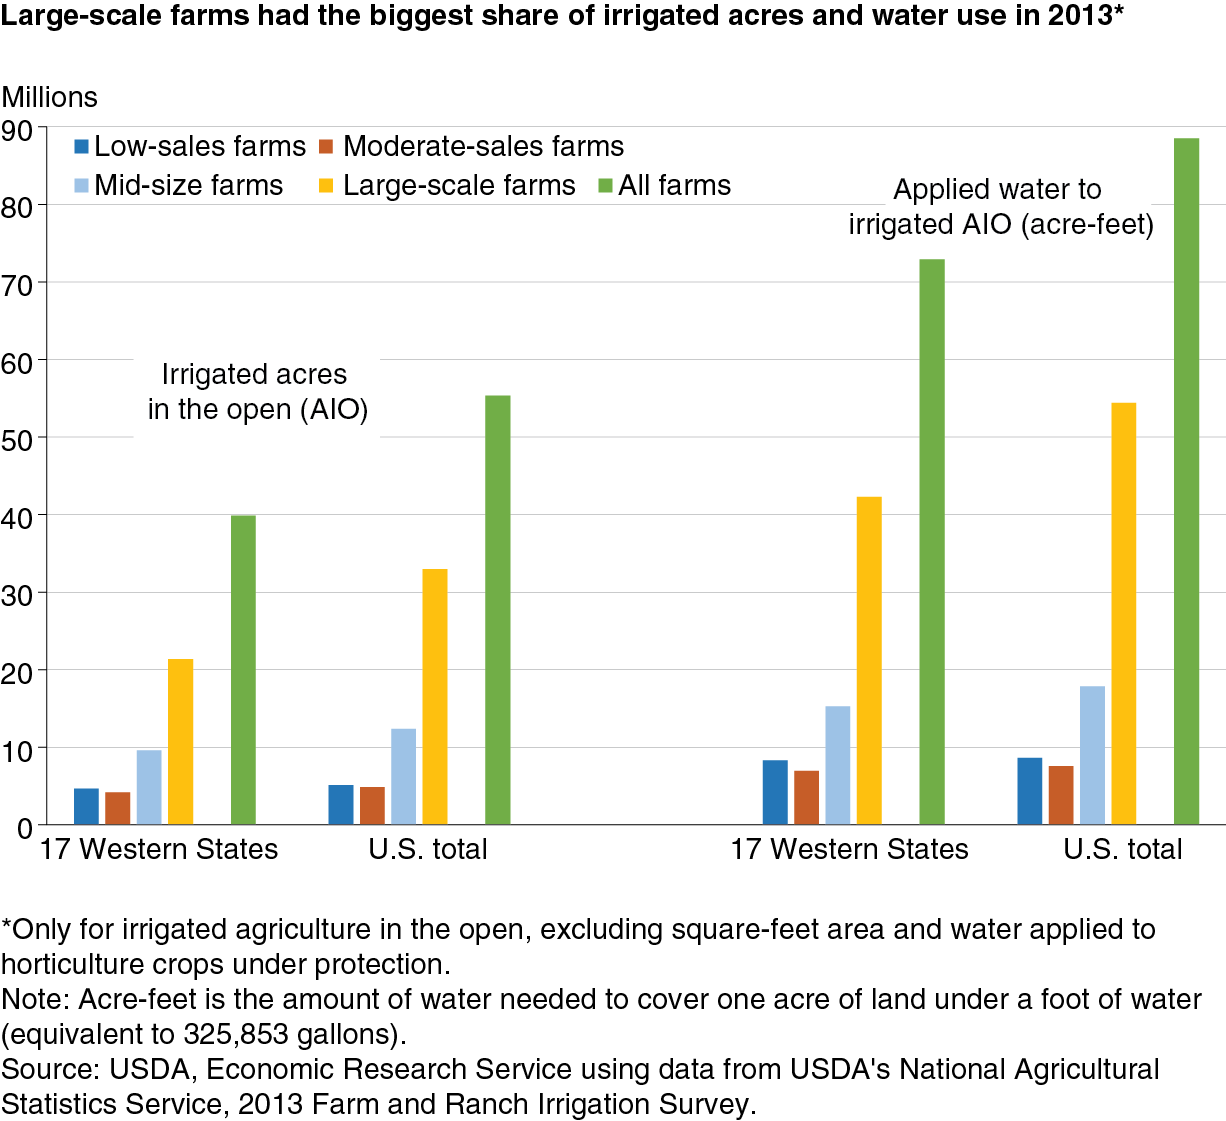
However, large-scale farms—those with $1 million or more in farm sales—accounted for over half of the irrigated AIO and about 60 percent of applied irrigation water in 2013. Large-scale irrigated farms also accounted for most (about 79 percent) of the value of irrigated farm production. These farms dominate these characteristics largely because their size allows them to spread costs over many more acres. For example, in the West, irrigation pumping costs for large-scale farms generally average about half that for low-sales farms.
The Use of Irrigation Systems in the West Has Changed Over the Years
There are two main types of irrigation systems: gravity and pressurized irrigation. Gravity irrigation uses the force of gravity and field borders or furrows to distribute water across a field. Open ditches or pipe systems along with siphon tubes, ditch gates, pipe valves or orifices deliver the water to the field. Pressurized irrigation, on the other hand, delivers water to the field under pressure in lateral, hand-move, and center-pivot pipe systems with attached sprinklers. It may also use drip/trickle tubes and micro-spray systems with drip emitters or micro-spray nozzles to distribute water.
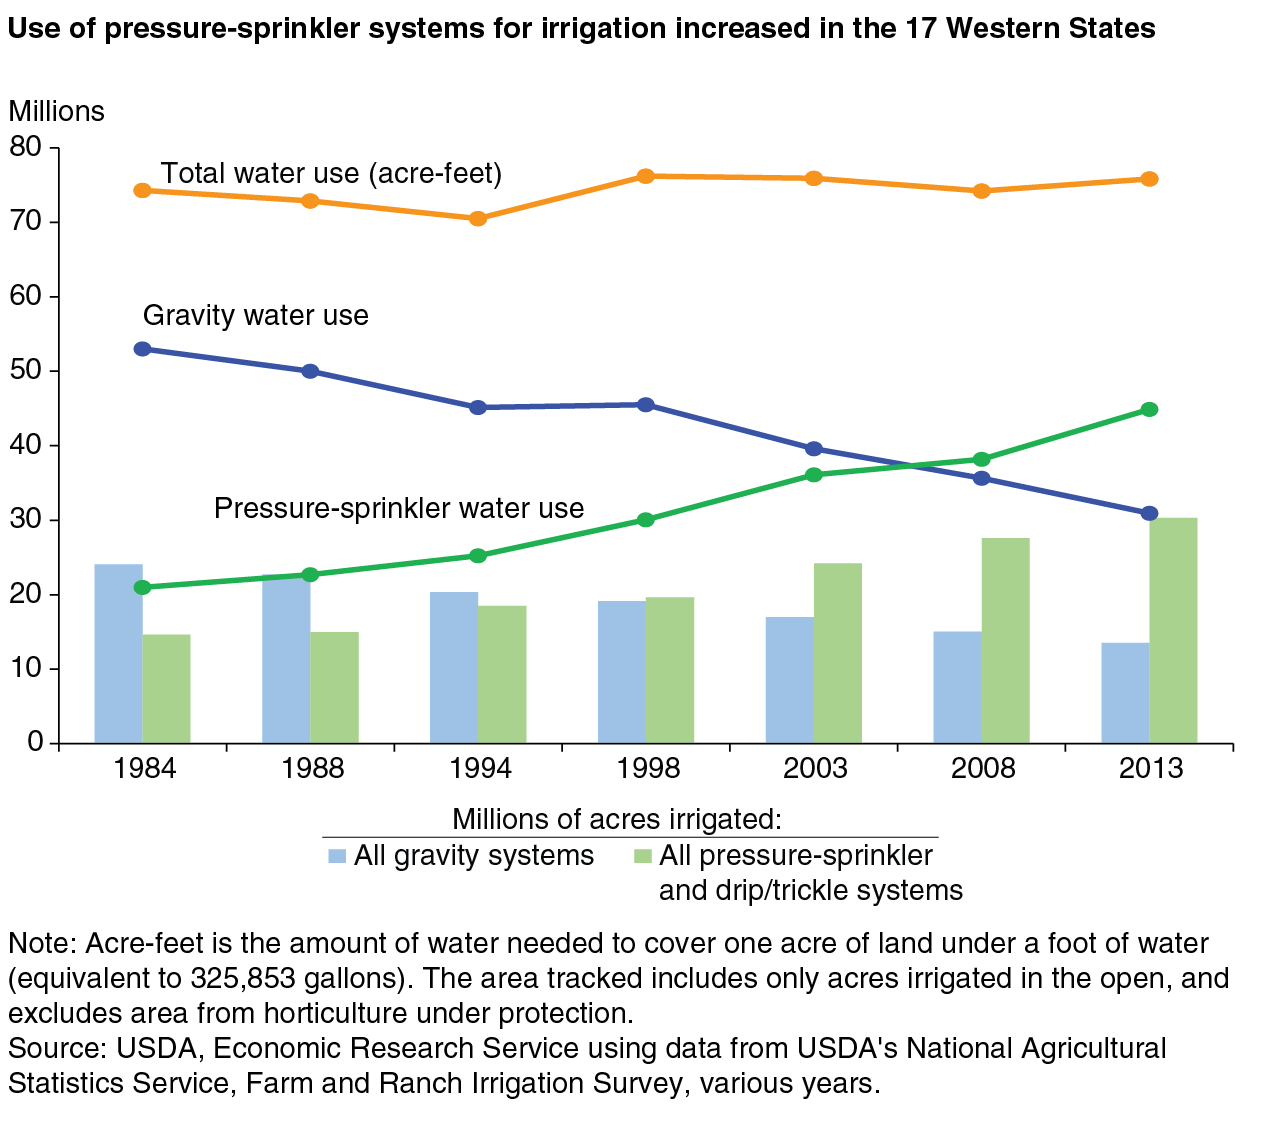
Comparing data from the 2013 FRIS to previous surveys can reveal trends in how Western farms have used irrigation systems over time. Total irrigated acres and applied water use, for example, remained relatively stable between 1984 and 2013. However, Western farmers have changed how they apply water to farmland. The share of water applied using gravity systems steadily declined from 71 percent in 1984 to 41 percent in 2013. Meanwhile, the share using pressure-sprinkler systems steadily increased from 28 percent in 1984 to 59 percent in 2013.
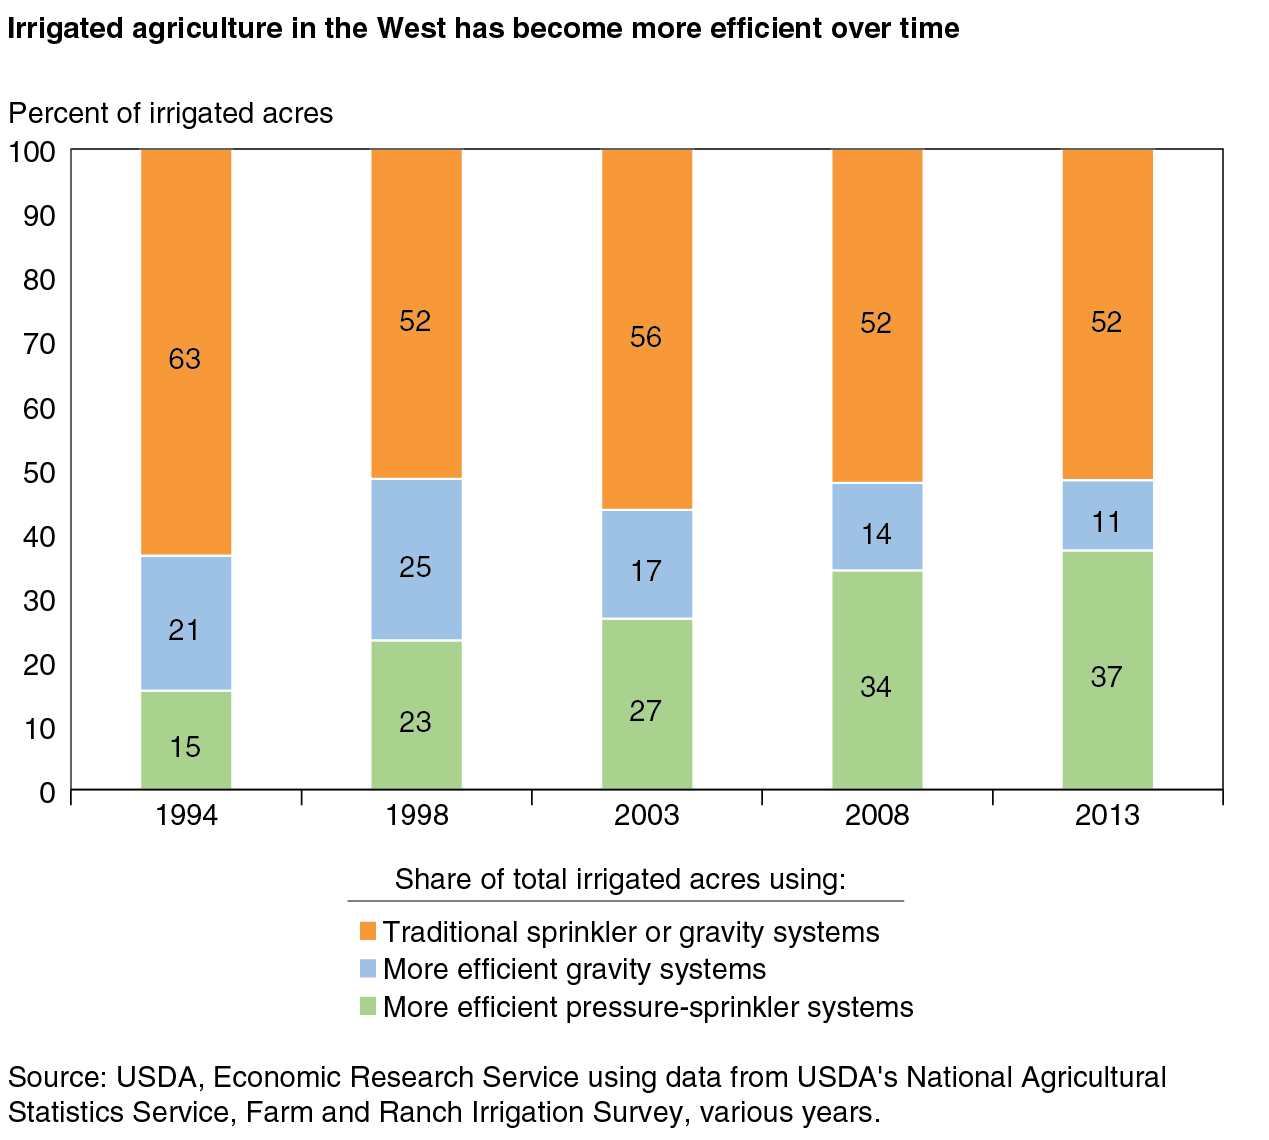
USDA conservation programs provide financial and technical assistance to encourage the adoption of more efficient onfarm irrigation systems. Efficient irrigation systems can help maintain farm profitability in an era of increasingly limited and more costly water supplies. FRIS data show that Western irrigated agriculture has become more efficient over time. More efficient irrigation (both gravity and pressure-sprinkler systems) accounted for about 37 percent of total irrigated acres in the West in 1994, but increased to nearly half by 2013. More efficient pressure-sprinkler irrigation alone accounted for about 15 percent in 1994, but more than 37 percent in 2013. The share of acres using more efficient gravity systems peaked in the late 1990s, but then declined as farmers increasingly turned to the even more efficient pressure-sprinkler systems.
In general, efficient irrigation increases with farm size. Smaller irrigated farms tend to have more traditional irrigation systems that operate at lower efficiency. Efficient systems require large capital investments that larger farms are better able to afford.
Irrigated Efficiency Varies by Region
FRIS data also reveal that the efficiency of irrigated agriculture varies significantly across U.S. farm production regions. The Southern Plains region, for example, had the highest share (87 percent) of total acres that used efficient irrigation systems in 2013. More efficient pressure-sprinkler systems alone accounted for 80 percent of total irrigated acres for the region. Efficient irrigation has become more important for the Southern Plains because of increasing pumping costs to reach deeper into groundwater aquifers.
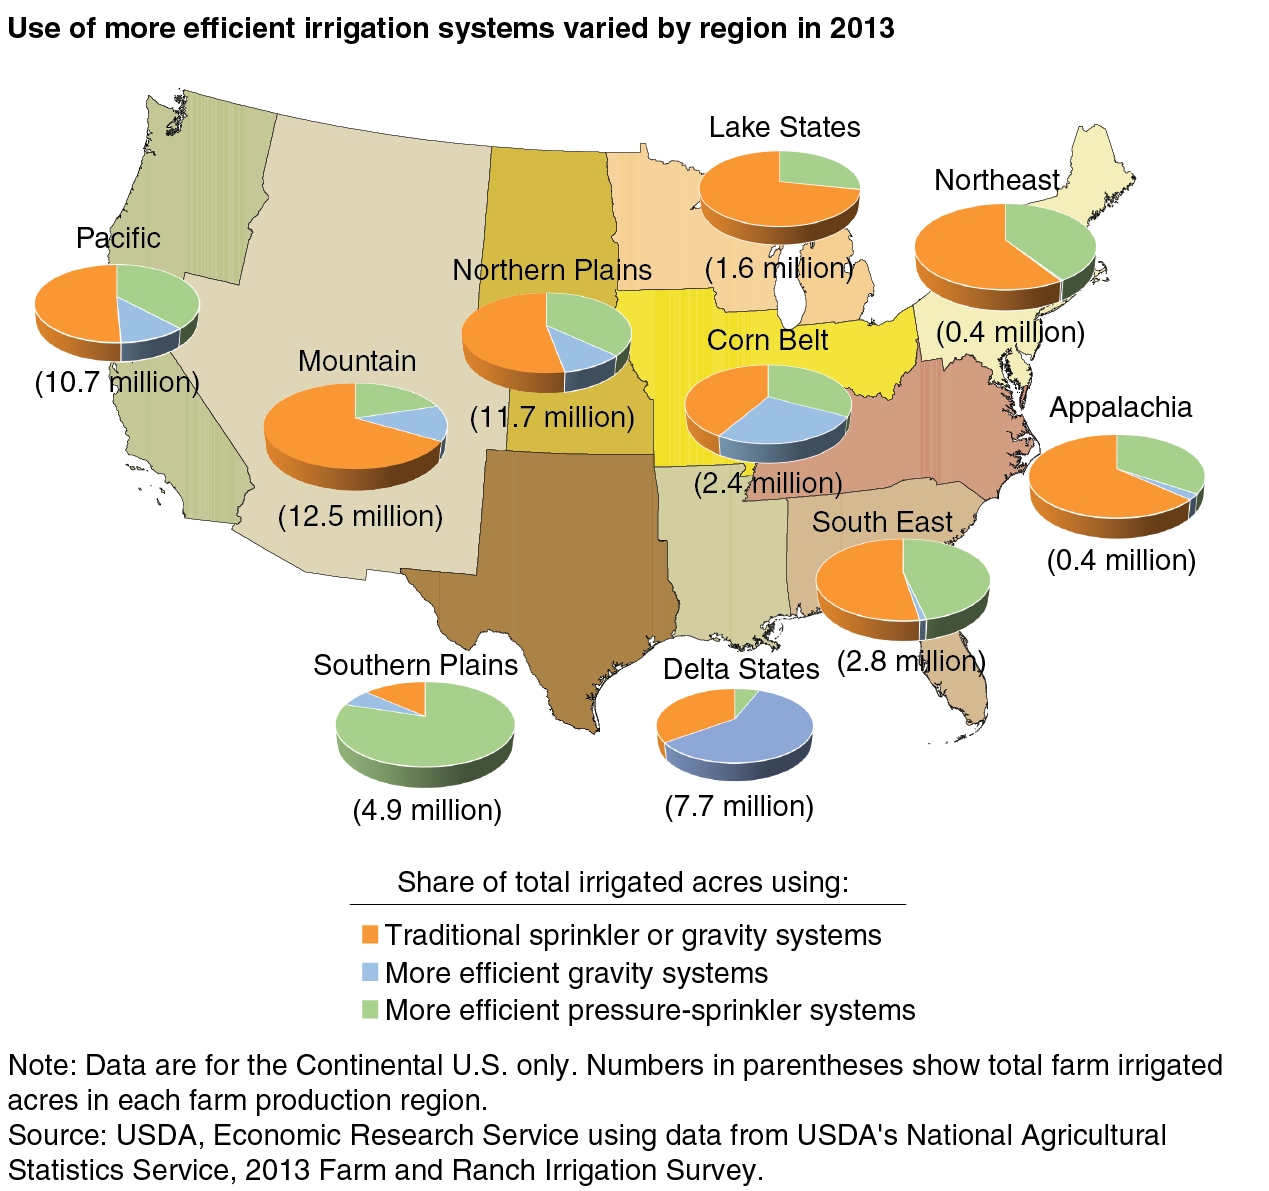
In the West, the Mountain region had the lowest share of acres irrigated with efficient systems. This region produces lower-valued crops (like hayland and alfalfa) for which traditional gravity systems remain the most economic choice. In the East, the Delta States region had the highest irrigation efficiency, with more efficient gravity systems accounting for nearly 60 percent of total irrigated acres. The South East region, on the other hand, depends more on the use of more efficient pressure-sprinkler systems, which accounted for about 46 percent of total irrigated acres.
Errata: On August 10, 2017 this article was reposted to correct a double-labeling issue in figures 2 and 3.
This article is drawn from:
- Irrigated Agriculture in the United States. (n.d.). U.S. Department of Agriculture, Economic Research Service.
You may also like:
- Schaible, G.D. and M.P. Aillery. Challenges for US Irrigated Agriculture in the Face of Emerging Demands and Climate Change. Chapter 2.1.1 in Competition for Water Resources: Experiences and Management Approaches in the US and Europe, eds. Jadwiga Ziolkow. (2016). Elsevier Publishing .