
USDA’s FoodAPS: Providing Insights Into U.S. Food Demand and Food Assistance Programs
- by Jessica E. Todd, Laura Tiehen and Dawn Marie Clay
- 8/16/2017
Highlights
- An analysis of data from the National Household Food Acquisition and Purchase Survey (FoodAPS) found that SNAP benefits accounted for over 60 percent of the average SNAP household’s food-at-home expenditures.
- SNAP benefits played a strong role in the food budgets of households with children and those in deep poverty.
- FoodAPS data revealed that more than 20 percent of the time that food was acquired, it was acquired for free.
Understanding the factors that influence the foods people purchase and eat—tastes and preferences, prices, interest in nutrition, time and money constraints, to name a few—takes data, lots of data. Analyzing just food store purchases, for instance, ignores the more than 40 percent of Americans’ calories that come from other sources—foods from restaurants and other eating places, schools, and food pantries. And, to understand the impacts of food assistance programs or dietary recommendations on food choices, researchers need information on program participation and awareness and use of dietary guidance.
USDA’s National Household Food Acquisition and Purchase Survey (FoodAPS) was designed to provide the data needed to study the factors that affect food choices and the outcomes related to those choices. This survey collected detailed information about all foods that a household purchased or otherwise acquired over a 7-day period, including grocery-store and eating out purchases; home production (gardening, fishing, and hunting); and food obtained for free from food pantries, family, and friends.
FoodAPS was also designed to help inform USDA food assistance programs and policies. Over one-half of USDA’s budget is allocated to food assistance programs, with the largest program being the Supplemental Nutrition Assistance Program (SNAP). The survey included a large number of SNAP participants and other low-income households, disproportionate to their population share (known as oversampling). This oversampling allows researchers to study the food purchase decisions of poorer Americans and their reliance on food pantries, free school meals, and other non-purchased foods. A total of 4,826 U.S. households completed the survey; 1,581 of those households participated in SNAP, 1,476 in the National School Lunch Program, and 461 in the Special Supplemental Nutrition Program for Women, Infants, and Children (WIC). A recent ERS study found that SNAP benefits accounted for 80 percent of the food-at-home spending of SNAP households with incomes less than half of the poverty line.
FoodAPS Collected Food Acquisition Information and Detailed Household Demographics
FoodAPS was innovative with respect to the breadth and depth of information collected about food acquisitions. Each household member age 11 and older was asked to track and report all food acquisitions during a 1-week period between April 2012 and January 2013 in specially prepared booklets. For each reported acquisition, respondents were asked to record who got the food, the name of the place where the food was obtained, the total paid (including forms of payment used), and if the food was received for free. Additional store and restaurant location data were used to provide measures of the number and density of stores and restaurants around each surveyed household’s residence.
Detailed demographic information about each household was collected through two in-person interviews with the household’s primary food shopper or meal planner: one before reporting any food acquisitions, and one after the food-reporting week was completed. These interviews also collected other information likely to influence what people purchase and eat, such as participation in food assistance programs, non-food expenditures, health status, diet and nutrition knowledge, and food allergies and other dietary restrictions.
To assess the quality of the FoodAPS data, ERS researchers compared several key food-related measures in FoodAPS to the same measures collected in other well-established and widely used national surveys. This comparison revealed that FoodAPS reliably collected a wide range of demographic and other food-related measures (see box, “Comparing FoodAPS to Other National Surveys”).
Households Obtain Food From a Variety of Stores and Other Sources in a Week
Data analysis can dispel misperceptions. For example, some public health advocates worry that households that live in “food deserts”—neighborhoods with no supermarkets or large, well-stocked grocery stores—are unable to access large, well-stocked stores with affordable prices. People living in food deserts, they assert, are stuck buying their food at small, poorly stocked nearby food stores.
ERS analyses of FoodAPS data found that distance to a store is only one factor consumers consider when deciding where to shop for food, and perhaps not the biggest one. The researchers discovered that, on average, households did not select the nearest large grocery store or supermarket for their main grocery shopping. And, this result also held true for low-income households. Even households that did not have their own car, or walked or took the bus to do their main grocery shopping typically selected a store that is further from home than their nearest store. Store proximity may be important, but price, quality, and selection also affect where households shop.
FoodAPS data provide detailed information on where and how often households acquire food. During the survey week, 87 percent of households acquired food at least once from a large grocery store or supermarket, while 85 percent acquired food from a restaurant or other type of eating place. Six percent of households acquired food from their own or others’ home production, while 37 percent of households acquired food from social gatherings, such as at a family member’s or friend’s home, parties, and places of worship. Fourteen percent of households obtained food at school, 22 percent at work, and 1 percent obtained food from food pantries or Meals on Wheels. Non-SNAP households were more likely to report food from their own or others’ production than SNAP households, and less likely to report acquisitions from food pantries and Meals on Wheels.
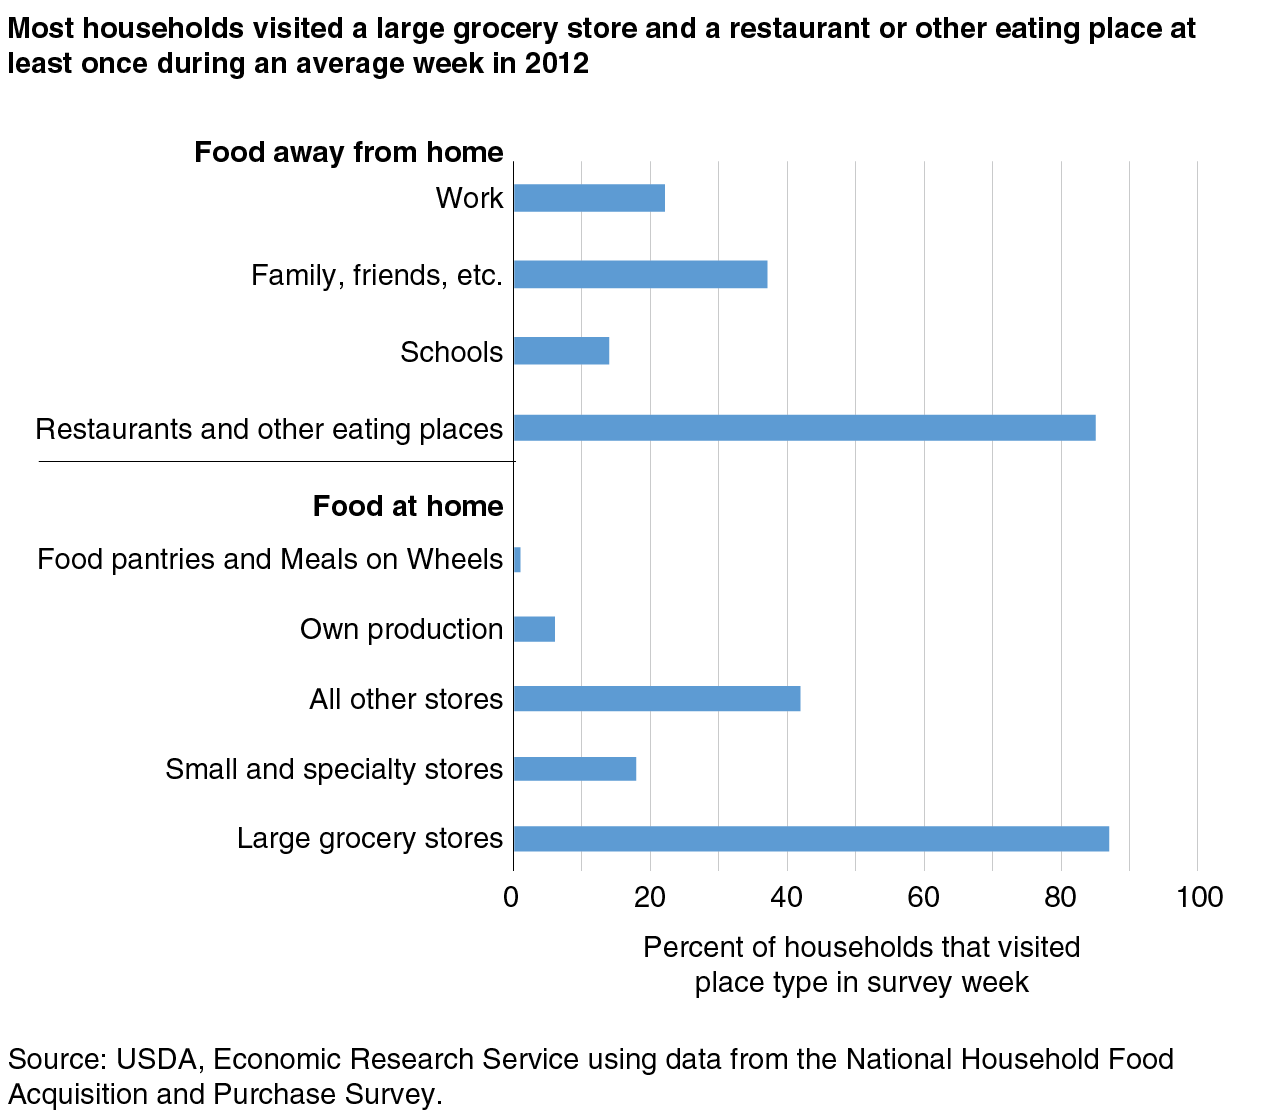
Households acquired food an average of 11 times per week, and those that acquired food from restaurants and other eating places did so twice as frequently (5.4 times per week) as those that acquired food from large grocery stores and supermarkets (2.8 times per week). This is consistent with grocery store trips being used to purchase food for multiple days, while restaurant visits are typically only to acquire a single meal.
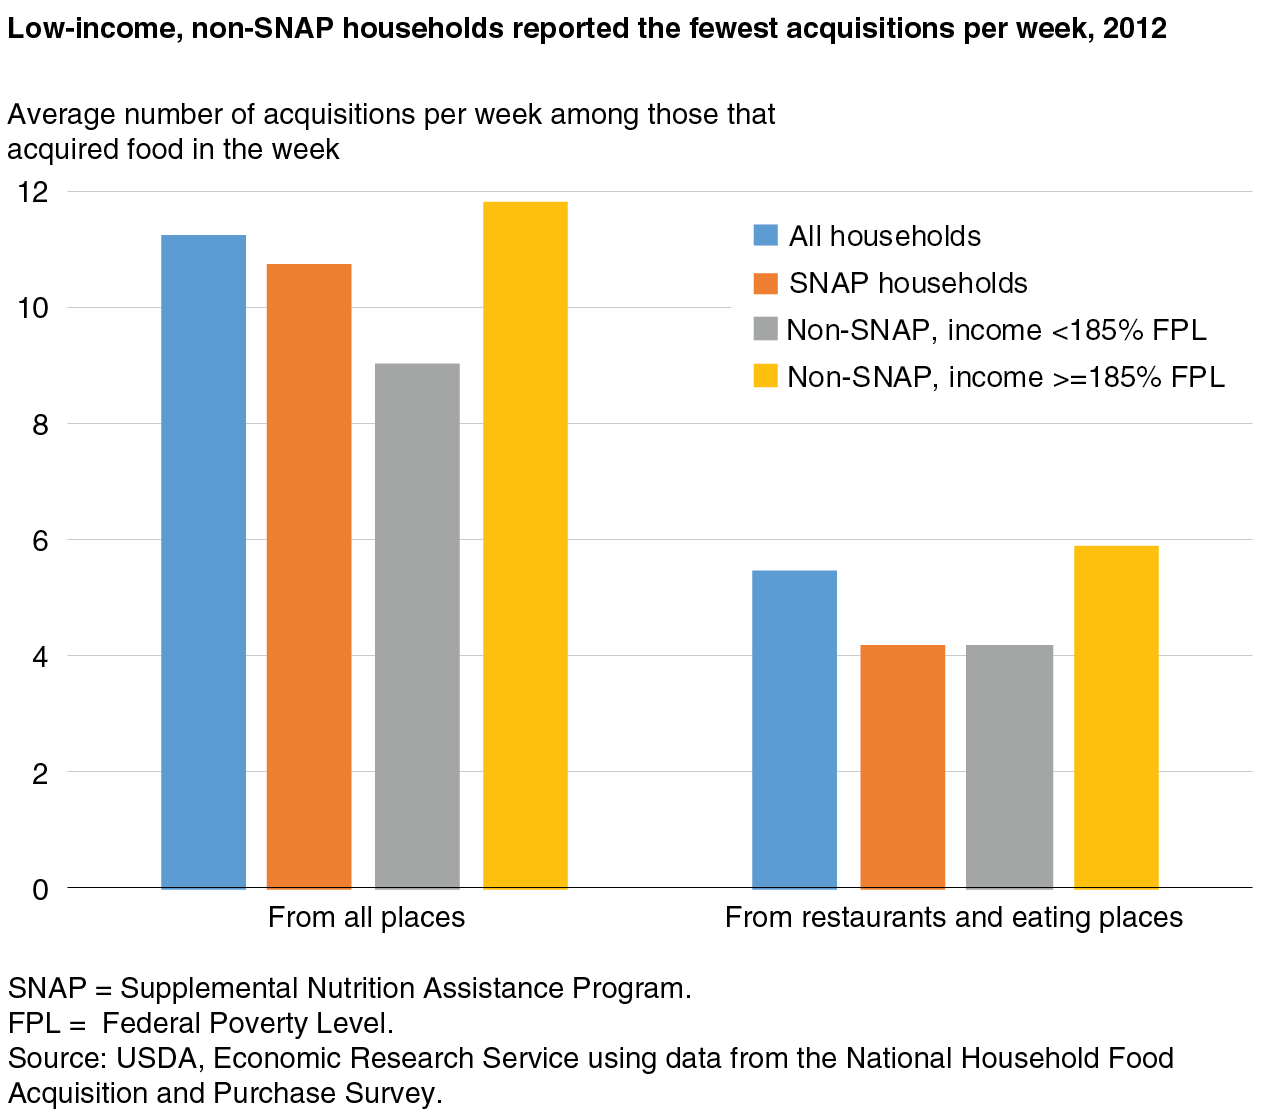
Higher income households reported the greatest number of food acquisition events per week (11.8), while low-income non-SNAP households reported the least (9.1). SNAP households and lower income non-SNAP households reported fewer acquisitions from restaurants and other eating places (4.2) than higher income non-SNAP households (5.9).
More Than 20 Percent of Food Acquisitions Were Free
Databases that contain only purchased foods provide an incomplete look at food acquisitions because they miss foods that are acquired at no cost to the household. If household members, for example, regularly have their lunches provided by an employer or school, their grocery store and restaurant purchases would reflect mostly breakfast and dinner foods. Free food may make up a significant share of some households’ weekly food consumption.
FoodAPS data revealed that, on average, 22 percent of all food acquisitions reported were free. As expected, most acquisitions from home production, food pantries and Meals on Wheels, and social gatherings were free (95 to 99 percent). Half of all school acquisitions were free, while 70 percent of food acquisitions at work were free. Of all acquisitions at restaurants and other eating places, 15 percent were free. The data do not allow researchers to determine if someone else paid for the meal, or if a restaurant worker reported a complimentary meal from his or her employer as being from a restaurant rather than as being from the workplace.
SNAP households reported the highest share of all events (30 percent) and nearly all school acquisitions (91 percent) as free. In comparison, lower income non-SNAP households reported 64 percent of school acquisitions as free, and higher income non-SNAP households reported 36 percent of events from school as free. This difference may be due to SNAP households’ pre-qualification for free meals from the National School Lunch and School Breakfast Programs.
SNAP households also reported a larger share of events from restaurants and eating places as free (19 percent) as compared to higher income non-SNAP households (14 percent). These differences may reflect the fact that low-income households are more likely to have members who work at restaurants and eating places and receive free meals from their place of employment.
SNAP Benefits Play a Strong Role in the Food Budgets of Recipient Households
With its deliberate oversampling of SNAP participants and other low-income households, the FoodAPS survey provides a comprehensive picture of the food spending patterns of these groups. A recent ERS report found that SNAP households spent an average of $108 per household per week on food, with $81 spent on food at home (from grocery stores or other food stores), and $27 spent on food away from home (from restaurants, cafeterias, or other eating places). Food-away-from-home spending accounted for about one-quarter of the total food expenditures of SNAP households, a significant but smaller share than the average 38-percent share for all U.S. households.
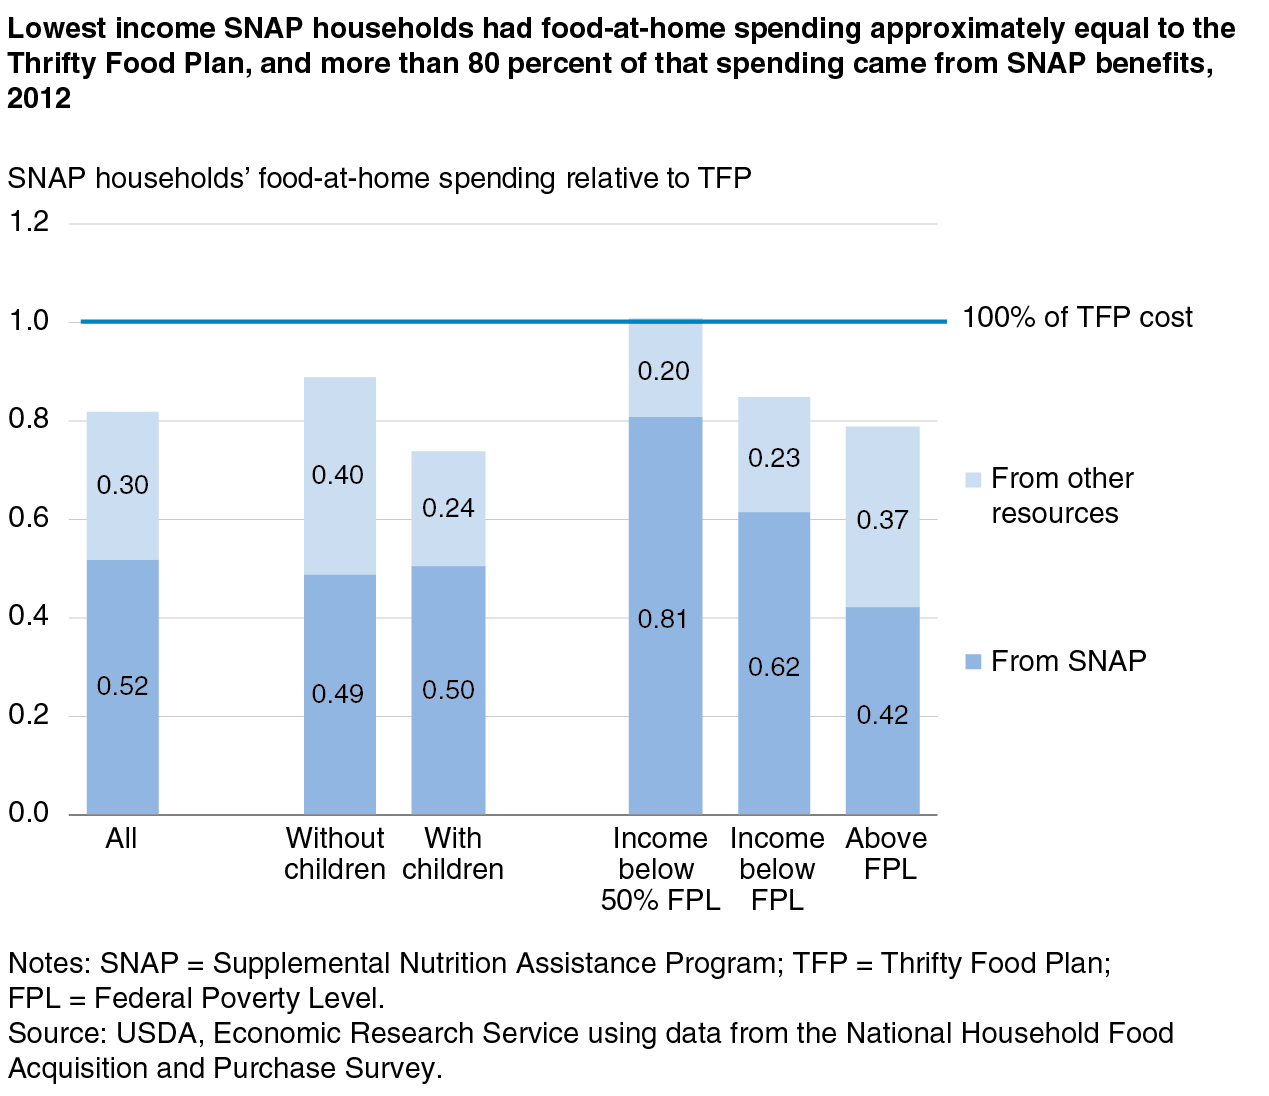
Household size and composition influence what and how much food households need. Researchers often adjust for differing food needs by comparing household food spending to the cost of USDA’s Thrifty Food Plan (TFP). The TFP is a low-cost food plan that accounts for differences in food needs by age and gender. Using the cost of the TFP to adjust for household size and composition, SNAP households spent less on total food than other households, even households whose income and assets are low enough to make them eligible for SNAP. The average food-at-home spending of SNAP households did not differ significantly from that of eligible nonparticipant households, but eligible nonparticipant households spent almost 90 percent more on food away from home than SNAP households. (SNAP benefits can only be used for at-home food.)
SNAP households’ weekly average spending on food at home was 81 percent of the TFP cost, though average weekly total food spending (including food away from home) was slightly greater than the cost of the Thrifty Food Plan. SNAP benefits accounted for over 60 percent of the average food-at-home spending of SNAP households. SNAP is designed so that benefits increase with household size and decrease with income. Consequently, SNAP benefits play a particularly strong role in the food budgets of households with children and those in poverty. SNAP benefits accounted for almost three-fourths of the food-at-home spending of SNAP households with incomes below the Federal poverty guidelines, and an even greater share (80 percent) of food-at-home spending of SNAP households with incomes below 50 percent of the Federal poverty guidelines.
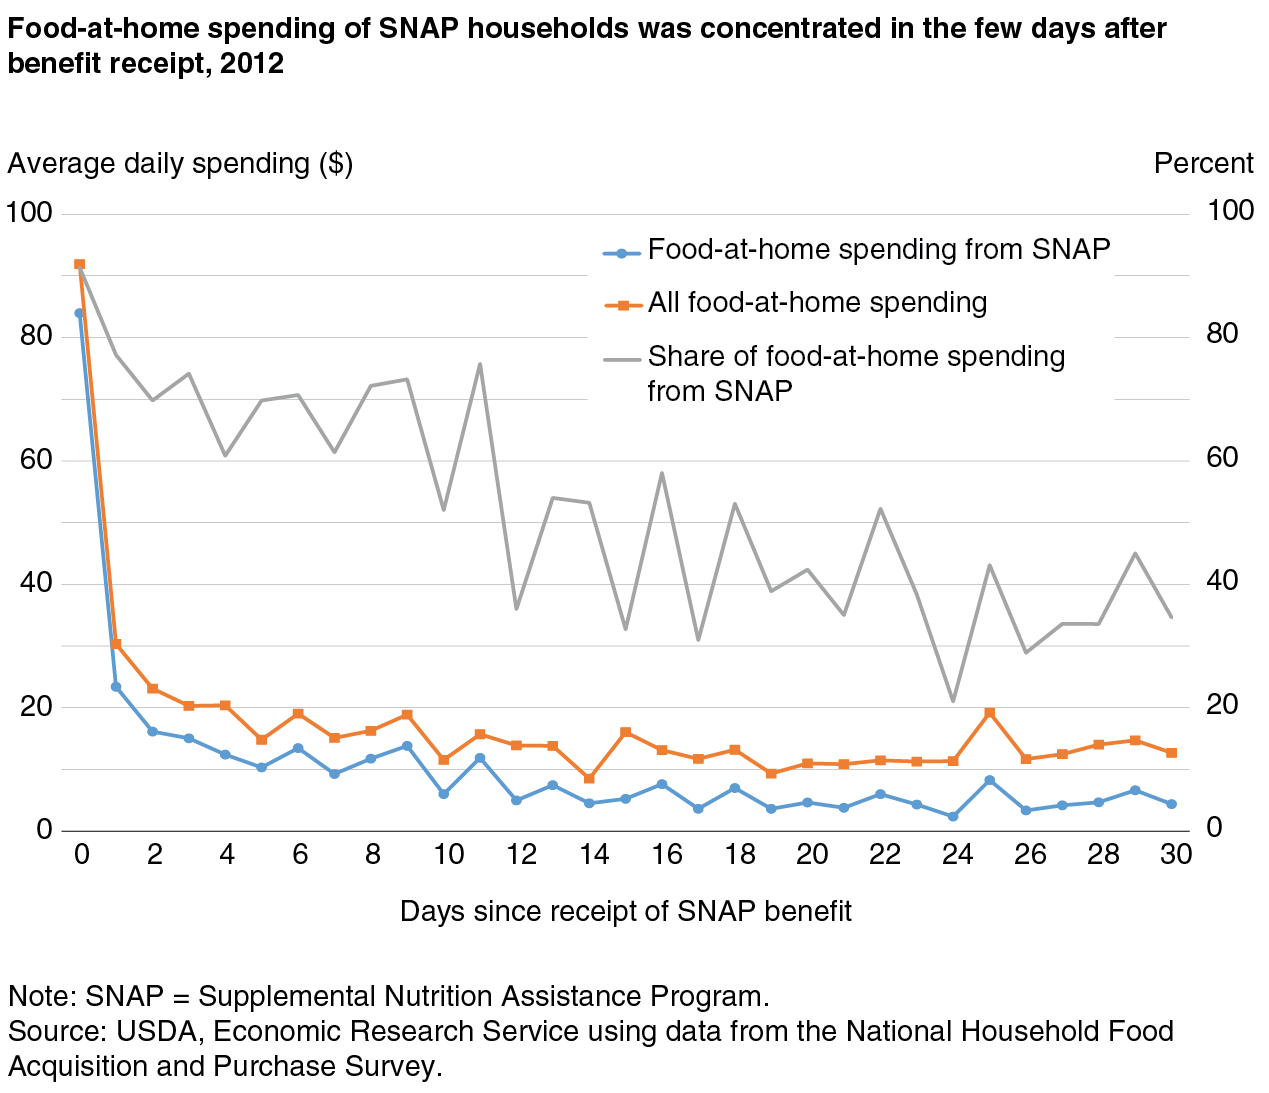
The ERS report also adds to a growing body of research that shows that SNAP households have cyclical purchasing patterns, with a large share of food-at-home spending occurring soon after the household receives its SNAP benefits, and then declining steadily throughout the rest of the month. SNAP households may be able to smooth their food consumption over the month by making a large shopping trip right after their benefit receipt and slowly drawing down their food stores over the course of the month. However, studies have found that SNAP participants consume fewer calories and that diet quality decreases toward the end of the month.
SNAP households spend an average of $92 on food at home on the day of benefit receipt, almost all of which is purchased with SNAP benefits. Over the rest of the month, average daily food-at-home spending ranges from $9 to $30 per day, and the share of food-at-home spending from SNAP benefits trends downward over the month. In contrast, spending on food away from home by SNAP households does not vary significantly over the month, with a daily average ranging from $4 to $6 per household.
ERS’s first reports have uncovered insights into household food demand and acquisition patterns, including the use of food pantries, Meals on Wheels, and other no-cost food sources such as home production and meals with family and friends. With its oversampling of SNAP households, FoodAPS provides a rich source of data to study food acquisition patterns of people participating in USDA’s food and nutrition assistance programs. Information about research using FoodAPS data underway at ERS and at universities and research institutes can be found online at www.ers.usda.gov/foodaps.
This article is drawn from:
- Tiehen, L., Newman, C. & Kirlin, J.A. (2017). The Food-Spending Patterns of Households Participating in the Supplemental Nutrition Assistance Program: Findings From USDA's FoodAPS. U.S. Department of Agriculture, Economic Research Service. EIB-176.
- Todd, J.E. & Scharadin, B. (2016). Where Households Get Food in a Typical Week: Findings from USDA’s FoodAPS. U.S. Department of Agriculture, Economic Research Service. EIB-156.
- Clay, D.M., Ver Ploeg, M., Coleman-Jensen, A., Elitzak, H., Gregory, C.A., Levin, D., Newman, C. & Rabbitt, M.P. (2016). Comparing National Food Acquisition and Purchase Survey (FoodAPS) Data With Other National Food Surveys’ Data. U.S. Department of Agriculture, Economic Research Service. EIB-157.
- Ver Ploeg, M., Mancino, L., Todd, J.E., Clay, D.M. & Scharadin, B. (2015). Where Do Americans Usually Shop for Food and How Do They Travel To Get There? Initial Findings from the National Household Food Acquisition and Purchase Survey. U.S. Department of Agriculture, Economic Research Service. EIB-138.
You may also like:
- FoodAPS National Household Food Acquisition and Purchase Survey. (n.d.). U.S. Department of Agriculture, Economic Research Service.
- Morrison, R.M. & Mancino, L. (2015, August 3). Most U.S. Households Do Their Main Grocery Shopping at Supermarkets and Supercenters Regardless of Income. Amber Waves, U.S. Department of Agriculture, Economic Research Service.