
After a Sharp Rise Between 1990 and 2005, Supercenters’ Share of At-Home-Food Spending Has Leveled Off
- by Annette Clauson and Howard Elitzak
- 4/4/2016
American consumers, businesses, and government entities spent $1.46 trillion on food in 2014—divided between the away-from-home-food market (50.1 percent) and the at-home-food market (49.9 percent). The U.S. at-home-food market comprises a variety of outlets and store types—supermarkets, supercenters, convenience stores, farmers’ markets, drug stores, and other retailers. Some of these retailers have seen their share of total U.S. food sales change significantly during the last 25 years.
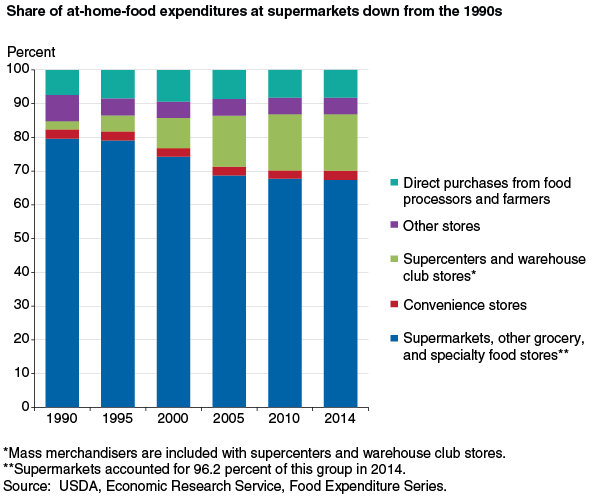
Supermarkets, defined as stores offering a full line of meats, groceries, and produce with at least $2 million in annual sales, had a 64.9-percent share of at-home-food spending in 2014, down from a peak of 76.3 percent in 1993. Warehouse club stores (such as Costco, Sam’s Club, and BJ’s) and supercenters (such as Walmart and Target) began springing up in the mid-1980s. These large discount stores, selling a variety of goods in addition to food and grocery products, grabbed food-at-home market share by offering consumers lower prices and convenient one-stop shopping. Food expenditures at warehouse club stores and supercenters accelerated sharply from 2.4 percent of total at-home expenditures in 1990 to 15.1 percent in 2005 and then grew slowly to 16.7 percent in 2010. Over the last 4 years, warehouse club stores and supercenters’ share has increased just 0.1 percentage point to 16.8 percent.
Another option for consumers in the at-home-food market is direct purchases from food processors and farmers. The share of at-home-food expenditures attributable to these sources grew during the 1990s but has remained relatively constant over the last decade, averaging roughly 8.4 percent. The “other stores” category, which includes dollar stores, drug stores, department stores, and other retailers, accounted for 4.9 percent of the at-home-food market in 2014. Convenience stores’ share has remained relatively flat since 1990, ranging from 2.3 to 2.8 percent of at-home-food sales.
Warehouse clubs and supercenters’ current 17-percent share of at-home-food spending may have implications for consumer food choices and diet quality. ERS analyses of 1998-2006 at-home-food purchase data found an inverse relationship between increased market share of supercenters and consumer purchases of groceries classified as healthful in USDA’s nutritional guidance. For example, consumers tended to purchase relatively fewer fruits and vegetables and more packaged and processed foods at supercenters than in supermarkets. These latter foods tend to be higher in saturated fats, sodium, or added sugars. With supercenters’ food offerings expanding to include fresh meats, produce, and other perishables and becoming more similar to supermarkets', differences in purchase patterns between the two store types may become less pronounced.
This article is drawn from:
- Food Expenditure Series. (n.d.). U.S. Department of Agriculture, Economic Research Service.
- Volpe, R. (2014, June 2). Consumers Devote a Higher Share of Food Spending to Fruits and Vegetables in Supermarkets Than In Supercenters. Amber Waves, U.S. Department of Agriculture, Economic Research Service.