
Higher Corn Returns Changes Corn Farm Dynamics
- by Linda Foreman and William D. McBride
- 11/3/2014
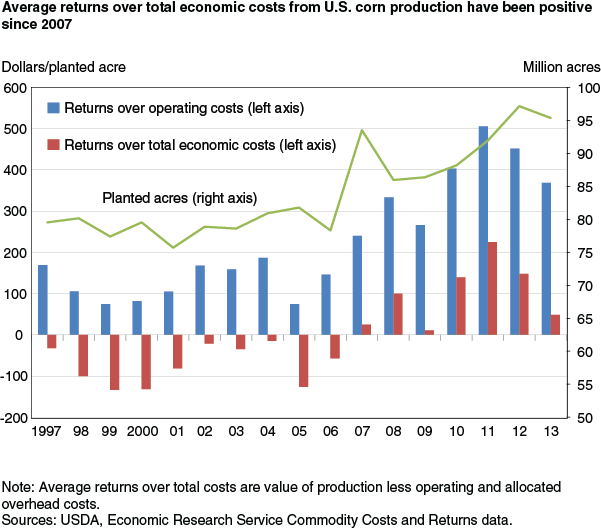
Starting with 2007, the returns to corn production per acre have improved substantially compared with the 1997-2006 period, primarily because of higher corn prices. Returns to corn production are defined as the value of production above operating cost, including only the cost of operating inputs such as seed and pesticides, or as the value of production over total economic costs—a measure that also includes the opportunity costs of land, labor, and other owned resources. During 2007-2013, both the average returns to operating costs and average returns to total economic costs have been positive. Average total economic returns reached $224 per planted acre in 2011 before declining to $48 in 2013. These higher returns helped stimulate nearly a 25-percent increase in planted corn acres nationally, from 78 million in 2006 to a record of 97 million in 2012. In 2013, lower corn price expectations pushed down planted area, and lower corn prices, along with higher land costs, reduced returns to corn production.
During the 1997-2006 period, returns above operating costs averaged $127 per acre—well below the average of $367 per acre average for 2007-13—and total economic returns to corn production averaged -$74 per planted acre. Negative returns over total economic costs indicated that producers realized a lower rate of return to their land, labor, and capital than those used in ERS commodity cost and returns accounts. From 1997 to 2006, planted corn acreage was relatively stable between 75 and 82 million acres.
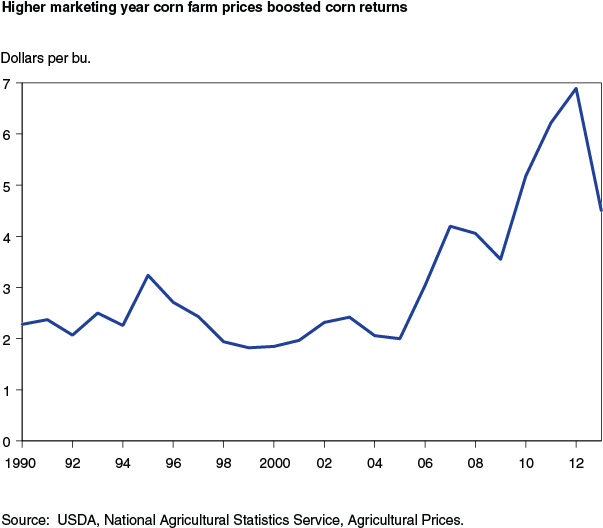
The improvement in the corn returns during 2007-2013 has been largely the result of higher corn prices. Marketing year average corn prices (September through August) were relatively stable from 1990 to 2006, ranging between about $1.50 and $3.25 per bushel. Between 2007 and 2013, corn prices ranged from about $4.00 to over $6.00 per bushel. Prices reached a peak in 2011 and 2012 before declining in 2013. However, the 2013 price remained well above historical norms. Many factors influence corn prices. The rising ethanol demand had a role in increasing corn prices since corn is the major starch source for U.S. ethanol production. Between 2006 and 2013, the amount of corn used for fuel rose from about 2 to 5 billion bushels. Other factors also played roles, including depreciation of the U.S. dollar, growth in global population and per capita income, and rising world consumption of animal products.
Data from commodity versions of USDA’s annual Agricultural Resource Management Survey (ARMS) are used as the basis for setting estimates of commodity costs and returns each year. Corn versions of the ARMS were conducted in 1996, 2001, 2005, and 2010. Corn costs and returns are estimated for years between these surveys using additional data on price, acreage, and production changes over time. These annual cost and return estimates provide an indication of changes in corn production practices and profitability.
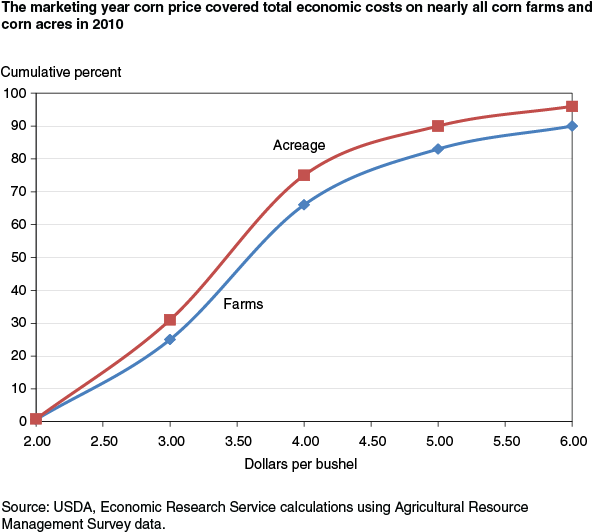
An analysis of data from USDA’s 2001 and 2010 ARMS shows relationships between corn production, prices, and acreage before and after the price rise. For example, the distribution of corn farms and acreage by cost level in 2010 indicates that corn production has been profitable on most corn farms and acres at prevailing corn prices since 2007. With a marketing year corn price of $5.18 in 2010, between 80 and 90 percent of corn farms covered total economic costs. These farms accounted for between 90 and 95 percent of U.S. corn acreage. Production costs increased in years after 2010, due in large part to higher land costs; however, marketing year corn prices reached $6.22 and $6.89 per bushel, respectively, in 2011 and 2012, and most farms continued to see positive returns.
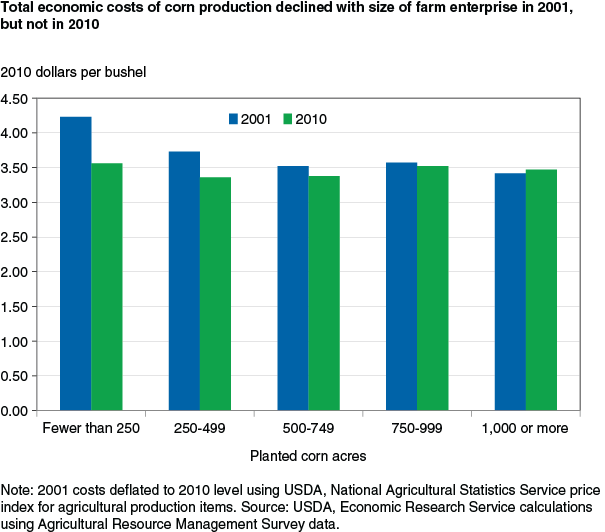
Data from the 2001 and 2010 ARMS also reveal a relationship between production costs and size of operation in each year. One might expect average total economic costs to decline with size of operation, due to economies of size. In 2001, corn production costs were highest for producers planting the fewest corn acres per farm and the lowest among those planting the most corn acres. However, these economies of size were not apparent in 2010; in that year, average total economic costs per bushel did not vary significantly by the number of planted corn acres. Twelve million corn acres were added nationally between 2001 and 2010, most of these on the largest corn farms. Some of these additional acres may have been marginal land with higher production costs, thus increasing average corn production costs among larger farms. In most cases, high corn prices in 2010 were sufficient to cover higher costs incurred on this additional acreage. This contrasts with conditions in 2001, where corn prices were just about $2.00 per bushel, making return margins much tighter than in 2010.
Since prices are a major factor in the returns to corn production, significant changes in corn prices will alter the returns. A fall in corn prices would likely reduce the net returns earned from corn production causing producers to avoid marginal land for corn production.
This article is drawn from:
- ARMS Farm Financial and Crop Production Practices. (n.d.). U.S. Department of Agriculture, Economic Research Service.
- Commodity Costs and Returns. (n.d.). U.S. Department of Agriculture, Economic Research Service.