
Onshore Oil and Gas Development in the Lower 48 States: Introducing a County-Level Database of Production for 2000-2011
- by Jeremy G. Weber, Sarah A. Low and Nicholas Walsh
- 2/3/2014
New drilling methods have caused a surge in onshore drilling in the Lower 48 States
For many years, geologists knew that large quantities of oil and gas were trapped in shale and other less permeable formations around the country. Drilling technology did not permit profitable extraction, but in the 1990s and early 2000s, drilling companies combined and refined hydraulic fracturing (“fracking”) and horizontal drilling methods. Hydraulic fracturing—shooting a mixture of water, chemical, and sand into underground rock formations at high pressure—frees trapped oil and gas to flow to the surface. Drilling wells horizontally lowers costs by allowing companies to access more oil and gas with one well bore.
Prior to the application of unconventional drilling methods, U.S. natural gas had been growing slowly, and U.S. oil production had been in decline since the mid-1980s. Both trends changed during the 2000s. From 2000 to 2011, onshore gross withdrawals of natural gas in the Lower 48 States increased by about 47 percent, reaching historic highs in every year after 2006. Over the same period, withdrawals of oil increased by 11 percent, with much of that growth occurring between 2007 and 2011.
Until now, there have been no publically available nationwide data on oil and gas production at the county level
Most policies regarding oil and gas development occur at the State level, and most States with oil or gas production have a government agency that manages information on oil and gas wells. Using data from State agencies, the Energy Information Administration of the U.S. Department of Energy publishes oil and gas production totals by State, but more local data for the entire United States were not widely available.
By acquiring disaggregated oil and gas production data from State agencies, researchers have created a county-level database covering onshore production in the Lower 48 States. Some States had published county-level production statistics available to draw from. In other States, researchers acquired well-level databases which were then aggregated to the county level by year. Similar data for several States have already been used to study the economic impacts of natural gas development (see “Natural Gas Extraction Creates Local Jobs in the Short Term” in the December 2012 issue of Amber Waves). Nationwide data permit a more comprehensive assessment of the geography of oil and gas development and is now available in ERS’s County-level Oil and Gas Production in the U.S. Nationwide, disaggregated data also allow researchers to assess changes in rural production over the past decade.
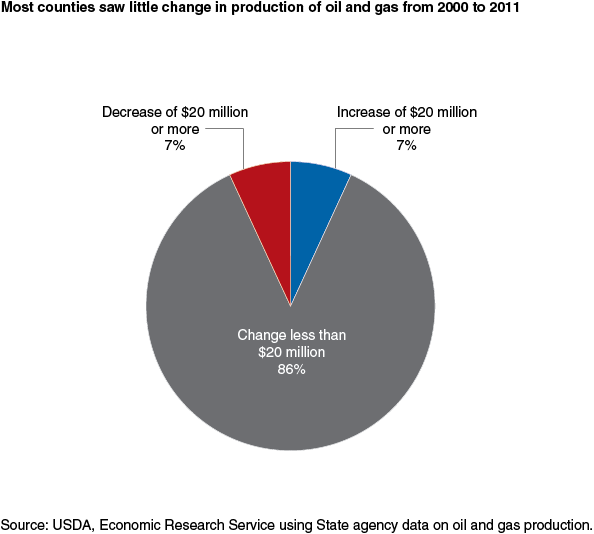
Changes in production between 2000 and 2011 have been concentrated in 14 percent of the counties in the Lower 48 States
Just over 35 percent of counties in the Lower 48 States had some on-shore oil or gas production in 2011; however, production in many of these counties was low. Large changes in production between 2000 and 2011 were concentrated in just 14 percent of counties in the Lower 48 States. Researchers calculated the change in oil and gas production from 2000 to 2011, and valued the change using national prices averaged over the period using the first purchase price for oil and the wellhead price for natural gas. This allowed approximation of the combined dollar value change in oil and gas production for each county. Notably, the percentage of counties with an increase of $20 million or more was the same as the percentage with a decrease of $20 million or more (7 percent of counties in the Lower 48 States). At typical rates, $20 million in production would generate roughly $3 million in royalty income for the owners of oil and gas rights and $1 million in State severance tax revenue.
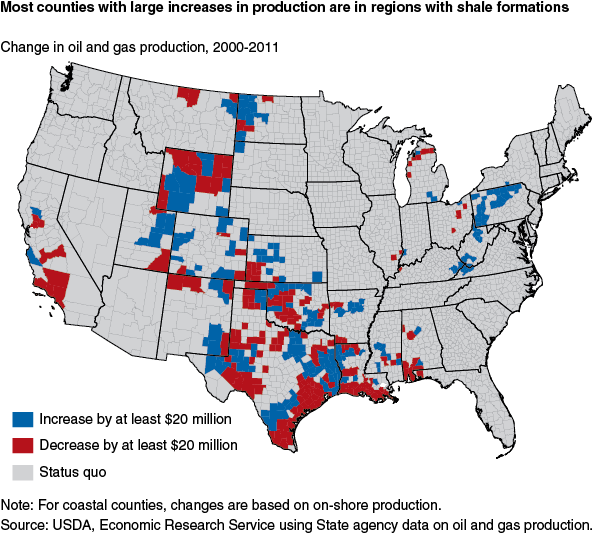
With the exception of Pennsylvania, most growth in production from 2000 to 2011 occurred in the central United States
Unconventional drilling is most cost effective in thick shale formations rich in oil or gas which are concentrated in specific locations, leading to regional pockets with large changes in oil and gas production. Formations holding oil or gas that share similar characteristics are known as a play. Counties with large increases in production in Arkansas correspond with the location of the Fayetteville shale play, in Pennsylvania with the Marcellus shale play, in Texas with the Barnett and Eagle Ford plays, and in North Dakota with the Bakken shale play. Many traditional oil- and gas-producing areas of the country, such as parts of Texas and Oklahoma, had a large decrease in production from 2000 to 2011, possibly from labor and equipment moving to areas made profitable with unconventional drilling methods.
Seventy-five percent of counties experiencing substantial production increases were rural (nonmetropolitan) counties
This is 14 percentage points higher than for counties with little change in production. Counties with a large increase in production also had lower income per capita and lower median household income in 2000 compared to other counties. Both counties with large increases in production and those with large decreases had higher employment and per capita income growth from 2001 to 2011.
| County characteristic | Oil and gas production decline of $20 million or more | Status quo (less than a $20 million increase or decrease) | Oil and gas production increase of $20 million or more |
|---|---|---|---|
| Counties that are nonmetropolitan, 2000 (percent) | 67 | 61 | 75 |
| Average median household income, 2000 (dollar) | 43,673 | 46,309 | 41,629 |
| Average per capita personal income, 2000 (dollar) | 29,530 | 30,871 | 29,210 |
| Average growth rate, per capita personal income, 2001 to 2011 (percent) | 22 | 13 | 22 |
| Average growth rate, full and part-time jobs, 2001 to 2011 (percent) | 13 | 5 | 15 |
| Source: USDA, Economic Research Service. | |||
Why did counties with large declines in production have higher economic growth than those with little change? This is the type of question that researchers can address with these new data
Increasing production does not necessarily correspond with where energy-related companies are expanding employment, nor do decreases indicate where energy-related employment is declining. Energy-related companies may have their headquarters in traditional production regions experiencing a long-term decline in production from high levels. Development of oil and gas elsewhere may still stimulate their business and cause them to expand their headquarters payrolls. This hypothesis is consistent with data showing that employment in oil and gas extraction doubled between 2001 and 2011 in counties with a decline in oil and gas production of $20 million or more, a higher rate of growth than in counties with an increase of $20 million or more. Alternatively, new drilling or stimulation of old wells may be occurring in traditional producing areas but be insufficient to offset the effect of many older wells whose production has been declining for many years. Still, increases in production from development of unconventional formations are associated with increases in employment, income, and population. Newly released data may stimulate further research in this area.
This article is drawn from:
- County-level Oil and Gas Production in the United States. (n.d.). U.S. Department of Agriculture, Economic Research Service.
You may also like:
- Weber, J.G. (2012, December 3). Natural Gas Extraction Creates Local Jobs in the Short Term . Amber Waves, U.S. Department of Agriculture, Economic Research Service.
- Atlas of Rural and Small-Town America. (n.d.). U.S. Department of Agriculture, Economic Research Service.
- 'The Effects of a Natural Gas Boom on Employment and Income in Colorado, Texas, and Wyoming'. (2012). Energy Economics, Vol. 34: 1580-1588.
- 'A Decade of Natural Gas Development: The Makings of a Resource Curse?” . (2013). Resource and Energy Economics.