
Despite Improvements in International Food Security, Nutritional Adequacy of Diets Falls Short of Targets in Many Countries
- by Birgit Meade and Stacey Rosen
- 11/18/2013
Highlights
- Food security in 76 countries analyzed by ERS improved between 2000 and 2013, on average, with the overall share of food-insecure people declining from more than 37 percent to about 20 percent.
- In each of the regions analyzed, the populations, on average, exceeded the nutritional target of 2,100 calories.
- Despite the improvements in food security, consumption of protein and fat by lower income groups in many of the study countries fell short of targets.
The overall food security situation in 76 countries analyzed in ERS’s International Food Security Assessment, 2013-23 showed significant improvement over the past decade. On average, the number and share of food-insecure individuals declined sharply. On an aggregate level, calorie consumption in the countries studied exceeded the nutritional standard of 2,100 calories per person per day, and consumption of the basic macronutrients, carbohydrates, fat, and protein, increased markedly. However, these aggregate measures mask significant variations among countries and among income groups within countries. In a number of countries, consumption of fat and protein fell short of the nutritional target, and many individuals in the lowest income groups were unable to meet the daily target of 2,100 calories per person.
The improvements observed in overall food security come mainly as a result of rapid income growth in developing countries. If this growth continues, those countries and income groups that currently fall short of the nutritional target may also show improvements in those measures.
Food Insecurity Changed Little From 2012 to 2013, but Progress Has Been Made
Food security refers to a person’s ability to obtain adequate food for a healthy active life. Food consumption and food access are tracked over time going back to 2000; evaluated for the current time period, 2012 and 2013; and projected out a decade for 76 low- and middle-income developing countries—39 in Sub-Saharan Africa, 4 in North Africa, 11 in Latin America and the Caribbean, and 22 in Asia. Food security in the countries analyzed is estimated to remain mostly unchanged between 2012 and 2013. The total number of food-insecure people in the countries analyzed is estimated at 707 million in 2013, up 3 million from 2012, but ERS estimates show a decline in the share of the population that is food insecure, from about 21 percent in 2012 to about 20 percent in 2013. The distribution gap (the quantity of food needed to raise consumption in each income decile to the nutritional target of roughly 2,100 calories per capita per day) is estimated at about 15.4 million tons in 2013, virtually unchanged from the 2012 level. When broken down by region, ERS estimates of the number of food-insecure people show a slight year-to-year increase for Sub-Saharan Africa (SSA) and Asia but a 4-percent decline for the Latin America and Caribbean (LAC) region. North Africa (NA) continues to be the most food-secure region included in this study, with less than 10 percent of the population facing food insecurity. The outlook is strongly driven by population growth and productivity projections that are unfavorable in some countries, thus leading to the possibility of deteriorating food security in those countries over the next 10 years.
Despite small changes in overall food security between 2012 and 2013, progress over the longer term is evident. Between 2000 and 2013, all indicators of food security used in this analysis showed marked improvements: the number of food-insecure people declined from over 1 billion to 707 million, the distribution gap declined from nearly 24 million tons to 15.4 million tons, and the share of food-insecure people declined from more than 37 percent to about 20 percent. In SSA, the most food-insecure region in the world, the share of population that is food insecure dropped from 52 percent in 2000 to less than 30 percent in 2013.
The same period also saw robust economic growth in the regions covered by the report, ranging from 4 to 6 percent per year. This growth even appears to have reached some of the lower income groups, which will likely lead to improved access to food. Several World Bank studies on specific countries and regions, as well as household surveys, confirm a widespread decline in poverty. According to the World Bank (WDI database), the share of population living at or below $1.25 per day—expressed in international dollars maintaining purchasing power parity (PPP)—in low- and middle-income countries, on average, declined from nearly 31 percent in 2002 to less than 21 percent in 2010 (most recent data available).
Calorie Consumption Exceeds Nutritional Target…
The ERS report includes the outlook for food security as well as a review of consumption of macro nutrients. This article focuses on the latter. Rising incomes and improved food security also appear to have led to improved nutritional status in many countries. For the 76 countries included in the report, overall per capita food consumption (calories) increased 8.3 percent from 2000 to 2009 (the most recent year for which these detailed data are available). This growth occurred in all regions, and by 2009, all exceeded, on average, the nutritional standard of 2,100 calories per person per day. Despite having a 7.5-percent increase in per capita calorie consumption, the same rate of growth as in Asia, SSA had the lowest overall consumption level among all regions during the period. Calorie consumption increased by more than 6 percent in LAC and by 3.8 percent in NA during 2000-09. NA’s consumption has been above target levels and was substantially higher in all four of the region’s countries included in this study than that in the other regions. One of the main drivers of high consumption in NA is government programs that subsidize grain consumption, which boosts per capita calorie and protein consumption.
| Region | Ratio to targets (per capita daily) 2,100 calories, energy |
Ratio to targets (per capita daily) 10 percent protein1 |
Ratio to targets (per capita daily) 20 percent fat2 |
|---|---|---|---|
| 2000 | |||
| 76-country average | 1.05 | 1.00 | 0.93 |
| Sub-Saharan Africa | 1.02 | 0.97 | 0.86 |
| Asia | 1.07 | 0.96 | 0.86 |
| Latin America and Caribbean | 1.10 | 1.00 | 1.16 |
| North Africa | 1.49 | 1.10 | 0.99 |
| 2009 | |||
| 76-country average | 1.11 | 1.04 | 1.03 |
| Sub-Saharan Africa | 1.09 | 0.99 | 0.98 |
| Asia | 1.15 | 1.06 | 0.97 |
| Latin America and Caribbean | 1.17 | 1.04 | 1.17 |
| North Africa | 1.57 | 1.14 | 0.93 |
| 1Based on U.S. Food and Drug Administration, recommended threshold target 10 percent of diet. 2Based on American Heart Association, recommended threshold target 20 percent of diet. Source: USDA, Economic Research Service based on Food Balance Sheet data from Food and Agriculture Organization of the United Nations. |
|||
…But Protein and Fat Consumption Falls Short in Some Regions
In recent years, researchers involved in measuring food security have placed increasing emphasis on the nutritional adequacy of diets in addition to the levels of overall per capita calorie consumption. The need to ensure a balanced diet by reaching targeted consumption levels of the three macronutrients—carbohydrates, protein, and fat—is well established. In recent years, governments and aid organizations alike have also begun to stress the importance of micronutrients, such as vitamins and minerals. The World Food Program now publishes the nutritional content of all food aid products in response to this increased awareness. Missing micronutrients can lead to serious, often easily preventable, illnesses. The most recent estimates of the Food and Agriculture Organization of the United Nations (FAO) indicate that 2 billion people suffer from deficiencies in one or more micronutrients. However, since studying micronutrient availability is beyond the scope of the ERS report, the focus here is on consumption of macronutrients. Researchers analyzed indicators such as average consumption of calories per capita per day—total and by food group—as well as average consumption of protein and fat measured in grams per day. By converting protein and fat into calories—1 gram of protein has 4 calories and 1 gram of fat has 9—one can calculate protein and fat consumption as a share of total consumption. The World Health Organization, the American Heart Association, the U.S. Food and Drug Administration, and other sources recommend a diet in which fat makes up 20 to 35 percent of a person’s daily intake and protein makes up 10 percent. Given a nutritional target of 2,100 calories per capita per day, a threshold protein consumption would be 53 grams and a threshold fat consumption would be 47 grams. Using data from FAO food balance sheets, ERS compared total calorie intake, as well as fat and protein consumption, with the healthy threshold target across countries and over time.
Per capita consumption of proteins and fats in the 76 countries increased faster than total calorie consumption over 2000-2009. Growth in protein consumption (grams per capita) was highest in Asia (18.5 percent) but was also strong in LAC (10.3 percent) and SSA (9.6 percent). Fat consumption increased by more than 20 percent in both SSA and Asia and by 7.6 percent in LAC. Per capita consumption of fats was highest in NA, with 69 grams per capita per day, although this translates into slightly less than the 20-percent fat share due to the region’s relatively high total calorie consumption.
Despite this overall growth, consumption of proteins and fats continues to fall short of target levels in many countries. Average consumption of proteins remained just below target levels in SSA and fat consumption fell short in both SSA and Asia, even though both regions made improvements in overall diet quality. If current trends persist, both SSA and Asia may join the other lower income regions in meeting macro nutritional targets within the next few years.
Regional averages mask great differences among individual countries. Protein consumption levels in 14 of 39 SSA countries analyzed fell below the target, and fat consumption fell short in 16 countries. Among all 76 countries, consumption levels of protein and fat varied greatly from country to country and ranged from as low as less than half of target levels to as high as 80 percent above. For example, fat consumption per person per day was estimated at 28 grams in Bangladesh but 88 grams in Mongolia. In SSA, fat consumption varied from a low of 18 grams in Burundi to a high of 84 grams in Mauritania. But variation also exists within countries: For example, the Philippines reached the target level for average consumption of fat, but 40 percent of its households were estimated to fall below the target.
Lowest Income Groups in SSA and LAC Fall Short of Nutritional Targets
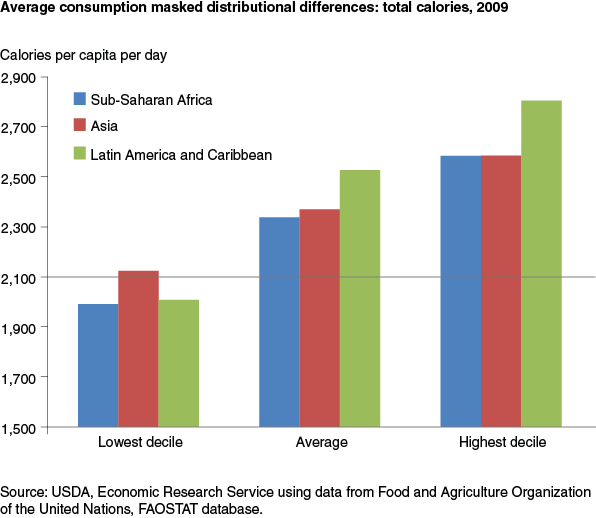
While average per capita consumption levels exceed recommended targets, large disparities in consumption exist among different income groups within and across countries. The degree to which the distribution of consumption is skewed is related to income inequality. Based on an income/consumption relationship and World Bank data on income and income distribution, the total amount of available macronutrients (calories, grams of protein, grams of fat) was allocated among 10 income deciles within each country. This allowed for estimates of protein and fat consumption, as well as calorie consumption, by income group. This analysis focuses on the three regions—SSA, Asia, and LAC—where the food security assessment found food gaps at lower income levels within countries (NA was therefore excluded).
While average regional calorie consumption levels were all above the nutritional target of 2,100 calories per person per day in 2009 (most recent data available), the lowest income groups in SSA and LAC did not meet this target, and those in Asia were estimated to barely exceed the target. At average and higher income levels, consumption is above the 2,100-calorie target in all regions studied. The LAC region is found to be more food secure than SSA and Asia when using national average measures, but because income distribution is more unequal in this region, consumption levels of the lowest income groups were lower than those in Asia and roughly equivalent to those in SSA. Asia, on the other hand, had a more equal income distribution and, despite Asia having lower average consumption levels than LAC, its lowest income groups were estimated to have greater access to food, protein, and fat than those in either LAC or SSA.
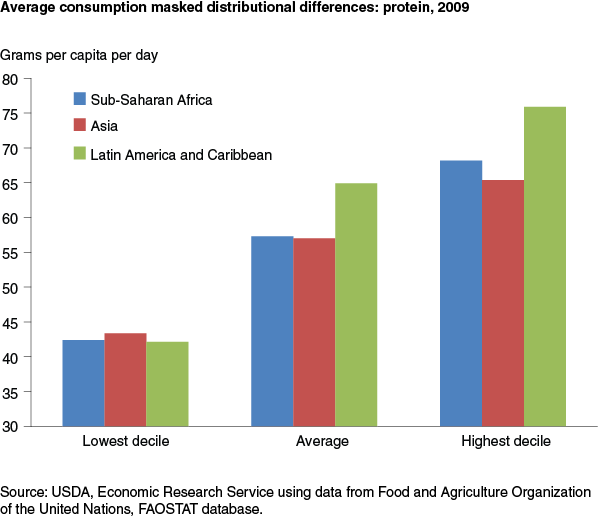

This broad regional assessment suggests progress in improving nutritional status and food security. Food consumption increased across all countries with respect to overall calorie levels as well as protein and fat consumption, stemming from increased consumption of foods such as meats and vegetable oils. However, many countries in SSA and Asia still fall short of recommended levels of protein and fat. In LAC, a region with relatively high average food consumption levels but highly skewed income distribution, consumption levels in lower income groups are similar to those seen in lower income households in SSA. However, if income growth remains strong, protein and fat consumption is likely to continue to increase and approach and/or exceed target levels as consumers allocate relatively large shares of new income to diversifying their diets and increasing consumption of meats, dairy products, and vegetable oils.
This article is drawn from:
- Meade, B. & Rosen, S. (2013). International Food Security Assessment, 2013-2023. U.S. Department of Agriculture, Economic Research Service. GFA-24.
You may also like:
- Muhammad, A., Seale, Jr., J.L., Meade, B. & Regmi, A. (2011). International Evidence on Food Consumption Patterns: An Update Using 2005 International Comparison Program Data. U.S. Department of Agriculture, Economic Research Service. TB-1929.
- FAOSTAT database. (2013). Food and Agriculture Organization of the United Nations.
- The State of Food and Agriculture. (2013). Food and Agriculture Organization of the United Nations.
- World Development Indicators database. (2013). World Bank.