Nonmetro Areas as a Whole Experience First Period of Population Loss
- by John Cromartie
- 5/6/2013
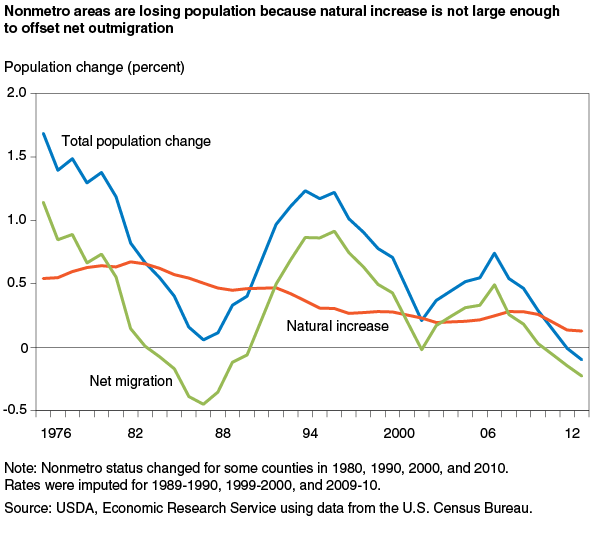
The number of people living in nonmetropolitan (nonmetro) counties now stands at 46.2 million--15 percent of U.S. residents spread across 72 percent of the land area of the U.S.* Population growth rates in nonmetro areas have been lower than those in metro areas since the mid-1990s, and the gap widened considerably in recent years. While nonmetro areas in some parts of the country have experienced population loss for decades, nonmetro counties as a whole gained population every year for which county population estimates are available--until recently. Between April 2010 and July 2012, nonmetro counties declined in total population by 44,000 people, a -0.09-percent drop according to the most recent release of annual county population estimates from the U.S. Census Bureau. County population change includes two major components: natural change (births minus deaths, also available separately) and net migration (inmigrants minus outmigrants). Nonmetro population loss during 2010-12 reflects natural increase of 135,000 offset by net outmigration of -179,000.
New population estimates are subject to revision, the rate of nonmetro population decline since 2010 is quite small, and the trend may be short-lived depending on the course of the economic recovery. Nonetheless, the 2010-12 period marks the first years with estimated population loss for nonmetro America as a whole. Even if temporary, this historic shift highlights a growing demographic challenge facing many regions across rural and small-town America, as population growth from natural change is no longer large enough to counter cyclical net migration losses.
Lower Rates of Natural Change Contribute to Historic Demographic Shift
While natural change has gradually trended downward over time, net migration rates tend to fluctuate in response to economic conditions. Historically, nonmetro population grew because high natural increase always offset any net migration loss, even when outmigration peaked in the 1950s and 1960s. Net outmigration from nonmetro areas was more severe during the 1980s than in 2010-12, but overall population change in these areas remained positive during the 1980s because natural increase was higher. Falling birth rates and an aging population have steadily dampened the contribution of natural increase to nonmetro population growth. Nonmetro net migration rates peaked during the “rural rebound” in the mid-1990s and, again, just prior to the recent housing mortgage crisis. Net migration remained positive for much of the past two decades and helped increase nonmetro population every year but one from 1990 to 2008, but it has since contributed to population loss.
Geography of Population Change Is Shifting
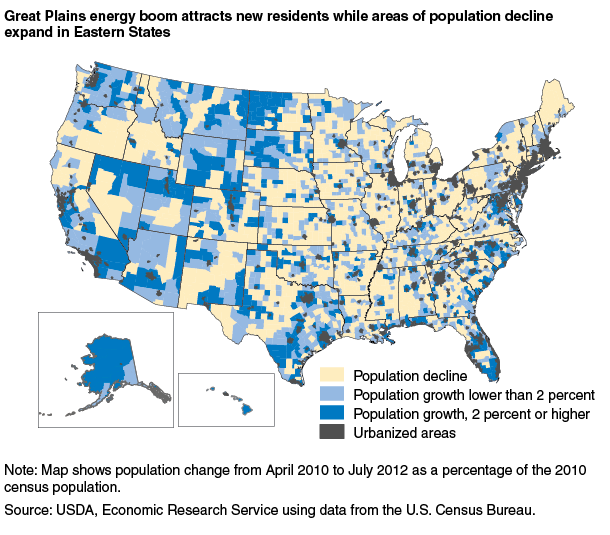
Opportunities for population growth and economic expansion vary widely from one nonmetro county to another, and new regional patterns of growth and decline have emerged in recent years. Spurred by an energy boom, large sections of the Northern Great Plains turned around decades of population decline. At the same time, nonmetro population growth switched to decline in 21 Eastern States between 2004-06 and 2010-12. For example, most metro counties in Florida maintained above-average population growth through the recent housing crisis and recession, but nonmetro areas went from 3-percent growth during 2004-06 to a -0.44-percent decline in the past 2 years.
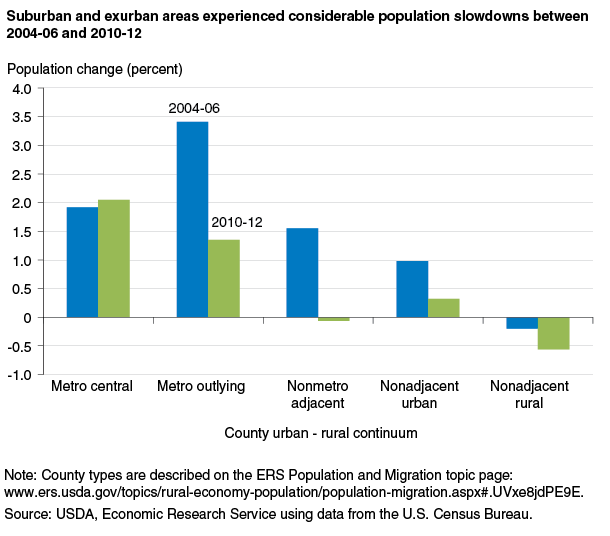
Urban population size, metro proximity, attractive scenery, and recreation potential have historically contributed to nonmetro population growth. For the time being at least, their influence has weakened. Over the last 2 years, suburban and exurban population growth has contracted considerably--for the first time since World War II--affecting not only outlying metro counties but nonmetro counties adjacent to metro areas as well. The housing mortgage crisis slowed suburban development and contributed to an historic shift within metro regions, with outlying counties now growing at a slower rate than central counties. Similarly, nonmetro counties adjacent to metro areas grew rapidly from exurban development for decades, with many hundreds of counties growing large enough to be reclassified as metropolitan. These types of counties declined in population for the first time as a group during 2010-12. The rate of decline was marginal (6,100 fewer people), but the drop from 2004-06 when a half-million people were added was considerably more significant than the drop in counties not adjacent to metro areas. This period may simply be an interruption in suburbanization or it could turn out to be the end of a major demographic regime that has transformed small towns and rural areas throughout the country.
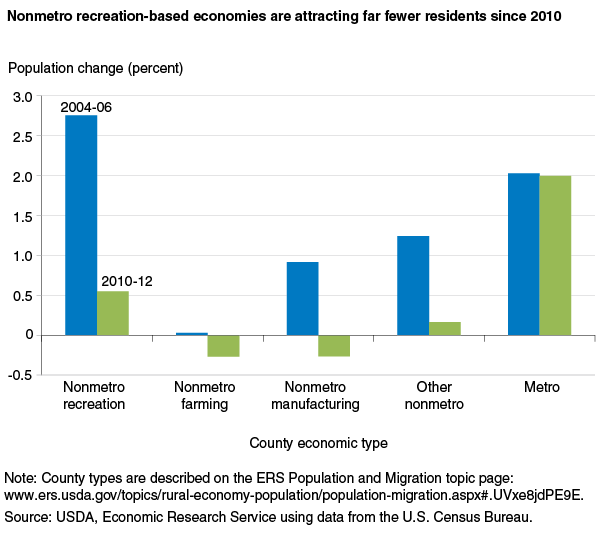
Long-term population growth from steadily booming recreation, tourism, and retirement economies has also been interrupted in nonmetro counties. During the 1990s and early 2000s, rapid inmigration to nonmetro regions with mountains, lakes, moderate climates, and other natural amenities generated jobs in construction and the service sector, which attracted additional migrants. Population growth in nonmetro counties with recreation-based employment has dropped to only 0.5 percent since 2010. While this may be a large drop in population growth, recreation counties are still growing faster than most other nonmetro counties. For example, manufacturing-dependent counties switched from population growth in 2004-06 to population decline in 2010-12. The extent to which these economic sectors recover will strongly influence the overall rates and geography of nonmetro population change in the coming years.
*An error in the nonmetro population estimate (previously 45 million) was corrected on May 13, 2013, to reflect the actual estimate of 46.2 million.
This article is drawn from:
- County-level Data Sets. (n.d.). U.S. Department of Agriculture, Economic Research Service.
- Population & Migration. (n.d.). U.S. Department of Agriculture, Economic Research Service.
You may also like:
- Atlas of Rural and Small-Town America. (n.d.). U.S. Department of Agriculture, Economic Research Service.


