
Price Inflation for Food Outpacing Many Other Spending Categories
- by Richard Volpe
- 8/5/2013
Retail food prices are garnering a lot of attention in the media and among economists due to their increased volatility in recent years. For most of the last two decades, prices at both supermarkets and restaurants may have moved up and down on a monthly basis, but these swings tended to smooth out into modest yearly increases. As a result, the all-food Consumer Price Index (CPI) followed a fairly predictable pattern of about 2-3 percent inflation each year from 1990 through 2005.
However, since 2006, a series of interrelated factors—including spikes in prices for food commodities and energy, major weather events, shocks to global commodity markets, and the U.S. economic recession and subsequent recovery—have resulted in annual changes in the all-food CPI ranging from a 0.8-percent increase in 2010 to a 5.5-percent jump in 2008. Volatility is not the only characteristic of the recent trend in food prices. Food prices have also been rising faster than in earlier years, and food price inflation has easily outpaced price inflation for many other types of goods. Among major consumer spending categories, only prices for transportation, which include a number of energy price measures, and medical care have risen faster than food prices.
Rising Food Prices Pushed Up All-Items CPI
The U.S. Bureau of Labor Statistics maintains a series of Consumer Price Indices for seven major consumer spending categories—food, housing, apparel, transportation, medical care, education, and recreation—that make up the all-items CPI. The all-items CPI is used to track inflation for all consumer goods and services. These seven major CPI components have been measured and tracked according to their current definitions since 1993. From 1993 to 2005, the rate of inflation for the seven component categories varied considerably. For example, the medical care CPI increased by 60 percent, while the apparel CPI fell by 11 percent. During this time, food prices and overall price inflation both grew by 35 percent.
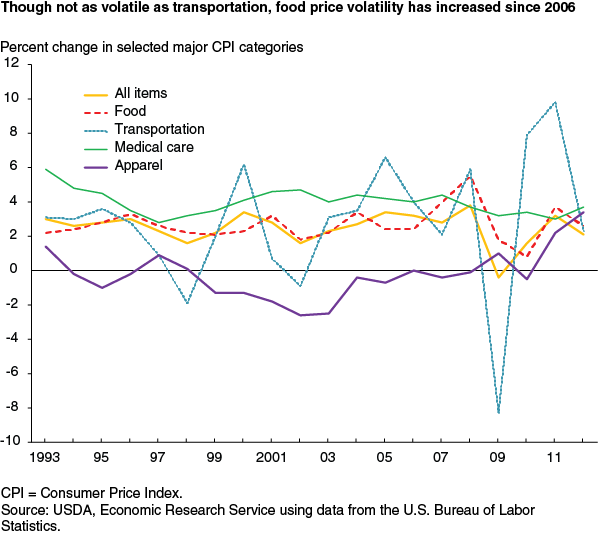
Since 2006, when commodity prices began their rollercoaster ride, the all-items CPI has risen 14 percent while the all-food CPI is up close to 20 percent. The wider differential in the post-2005 era means that a number of the macroeconomic inflationary factors have been specific to food prices. This effect was largely due to rising U.S. farm prices for corn, wheat, soybeans, and other food commodities. A number of factors triggered the price increases, including weather events that reduced output and storage levels, increased production of corn-based ethanol, and sharply increased U.S. exports to Southeast Asia, Africa, and South America.

Percent of Income Spent on Food Higher Than in 2008
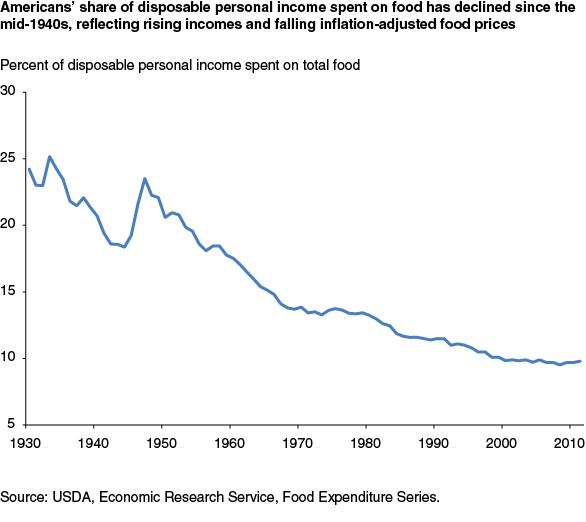
How have rising food prices affected the share of consumer income spent on food? Historically, as food prices have fallen in real (inflation-adjusted) terms, Americans’ food expenditures as a share of disposable income have fallen at a similar rate. In 1930, Americans spent 24 percent of their disposable income on food, including both at-home food and food purchased at restaurants and other eating places. Since 1947, the share of income spent on food has trended downward, with occasional reversals in response to economic conditions, before flattening at around 10 percent for the last decade. In 2008, Americans spent 9.5 percent of their incomes on food. More recently, rising food prices, coupled with stagnant or falling incomes for many, have caused consumer spending on food as a share of disposable income to move upward. In 2011, Americans spent 9.8 percent of their disposable income on food.
This article is drawn from:
- Consumer and Producer Price Indexes. (n.d.). U.S. Department of Agriculture, Economic Research Service.
- Food Expenditure Series. (n.d.). U.S. Department of Agriculture, Economic Research Service.