Retail Dairy Prices Fluctuate With Farm Value of Milk
- by Hayden Stewart and Donald Blayney
- 12/1/2009
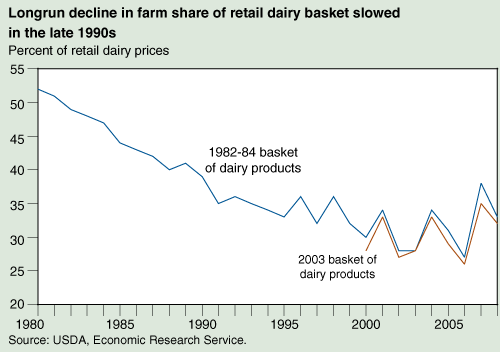
Retail dairy prices increased faster than prices received by dairy farmers nearly every year over the past few decades. Between 1980 and 1999, the farm share of retail dairy prices fell from 52 to 32 percent as marketing costs rose, primarily reflecting consumer demand for more convenience and variety. Bagged, shredded cheese and more flavors and types of ice cream increased the amount of packaging and processing needed to transform milk into the foods Americans wanted, widening the difference between farm and retail prices for milk and milk products.
In the late 1990s, however, the steady decline in farm share slowed and in 2000-2008, farm share fluctuated between 26 and 35 percent. Consumers saw modest increases in dairy prices over this period until the 2007-08 jump in food price inflation. Farmers experienced both rising and falling prices for their milk.
In 2009, the farm price of milk declined sharply. It remains to be seen whether retail prices and prices received by farmers will track closely after this recent volatility or if the farm share of dairy prices will resume its downward trend.
A Look at Dairy Product Prices
ERS examines the relationship between farm and retail prices using two measures. The difference between retail price and the farm value of the commodities in a food represents value added by food processors and marketers—also called farm-to-retail price spread. Farm share is defined as the ratio of farm value to retail price.
ERS measures trends in retail prices and farm value for baskets of foods. These baskets represent the food items and quantities bought by a typical American household in a year. The dairy products basket includes 14 dairy products ranging from butter to yogurt. The contents of the basket were based on 1982-84 data on grocery store purchases by U.S. households. However, U.S. food shopping habits have changed, and ERS updated the contents using 2003 purchase data for over 8,000 households. Farm shares calculated for both the 1982-84 and the 2003 baskets moved similarly over the 2000-2008 period.
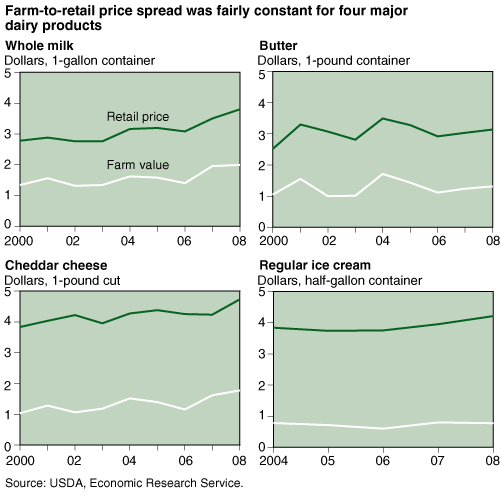
In addition to a basket of dairy products, ERS monitors trends in retail and farm prices for four representative dairy products: whole milk, butter, Cheddar cheese, and regular ice cream. Data from several sources are used, including:
- Farm prices reported by USDA’s Agricultural Marketing Service and National Agricultural Statistics Service are used to place a value on the farm milk in dairy products. Farm milk has two economically significant components—fat solids and skim solids, each with its own farm price. One hundred pounds of farm milk typically contains 3.7 pounds of fat solids and 8.62 pounds of skim solids.
- Conversion factors developed by various USDA agencies are used to estimate the amount of each type of milk solid in different dairy products. Whole milk, for example, is produced by reducing the fat content of farm milk to 3.3 percent, while butter contains 80.3 percent fat solids and 1 percent skim solids.
- Retail prices reported by the Bureau of Labor Statistics are based on what consumers, on average, pay at a sample of retail stores across the country.
The gap between the retail price and farm value is larger for Cheddar cheese and ice cream than for whole milk and butter. These wider spreads represent the greater value of nonmilk inputs, like packaging, advertising, and ingredients—such as nuts and cookie bits in ice cream.
For each of the four products, the farm-to-retail price spread remained fairly constant between 2000 and 2008. Retail prices tended to rise and fall with the farm value of the milk in the foods.
Farm Shares Did Not Fall
Like the trend for the overall dairy products basket, farm share did not trend downward for any of the four individual products between 2000 and 2008. The farm shares for whole milk, butter, Cheddar cheese, and ice cream moved in the same directions in 2000-07. In 2008, however, farm prices for skim solids fell and fat solid farm prices rose. As a result, there was little net change in the farm value of whole milk, and farm share for whole milk fell from 56 percent in 2007 to 53 percent in 2008. The situation was different for butter. Strong farm prices for fat solids led to a substantial increase in farm value and drove farm share for butter from 41 to 42 percent.
| Year | Whole milk | Butter | Cheddar cheese | Ice cream |
|---|---|---|---|---|
| 2000 | 48 | 42 | 27 | * |
| 2001 | 54 | 47 | 32 | * |
| 2002 | 47 | 33 | 25 | * |
| 2003 | 49 | 36 | 30 | * |
| 2004 | 51 | 49 | 35 | 20 |
| 2005 | 50 | 44 | 32 | 19 |
| 2006 | 45 | 38 | 27 | 16 |
| 2007 | 56 | 41 | 38 | 20 |
| 2008 | 53 | 42 | 38 | 18 |
| * Estimate not available. Source: USDA, Economic Research Service. |
||||
This article is drawn from:
- Price Spreads from Farm to Consumer. (n.d.). U.S. Department of Agriculture, Economic Research Service.
- Food Markets & Prices. (n.d.). U.S. Department of Agriculture, Economic Research Service.
You may also like:
- Dairy. (n.d.). U.S. Department of Agriculture, Economic Research Service.


