Population Dynamics Are Changing the Profile of Rural Areas
- by Carol Jones, William Kandel and Timothy Parker
- 4/1/2007
Highlights
- Nonmetro America is less ethnically diverse and older than the rest of the country, though demographic trends indicate some changes lie ahead.
- Nonmetro populations will continue to be older than metro populations because a greater proportion of retirees are moving to nonmetro counties than to metro counties, and because older people account for a larger share of the population in counties that are losing residents.
- Hispanic population growth is counteracting persistent population decline in many rural counties, especially in the Midwestern and Great Plains States.
Rural Americans can be Norwegian bachelor farmers. They can also be Hispanic meatpackers, Indian computer programmers, or recently retired doctors focusing on their golf game. Rural populations are changing. Patterns of migration, in tandem with the age structure and ethnic composition of the nonmetro population, will influence future development patterns. While today’s nonmetro America is less ethnically diverse and a bit older than the rest of the country, several population trends are increasing rural ethnic diversity and further increasing the rural share of the elderly.
For half a century or more, youth have moved out of farming-dependent areas to the cities. This longstanding trend has led to a rural age structure that yields more deaths than births. Such “natural decrease” further skews the population toward the elderly. As a result, schools and businesses are closing in some areas due to lack of students and customers.
In contrast, retirees are moving to some rural areas rich in natural and cultural amenities, such as those with proximity to ocean, lakes, or mountains, or within driving distance of urban areas. This in-migration has created new business opportunities, especially in recreation and retirement services, as well as new challenges associated with managing growth. Baby-boom aging nationwide will increase the elderly share of the population in both metro and nonmetro counties, but it will heighten the concentrations of elderly residents in current high-elderly areas.
At the other end of the age distribution, Hispanics, many of whom are foreign-born, are settling in nonmetro counties, taking jobs in farming, construction, and manufacturing. Foreign-born population growth—fueled by international migration and reinforced by a younger population and higher fertility rates—has mitigated and in some cases reversed the long-term patterns of population decline and aging populations in many Midwestern and Great Plains counties. At the same time, Hispanic, Asian, and other international inmigration is creating a need for bilingual teachers, nurses, and other service providers to educate and care for an increasingly diverse and youthful population in these areas.
Concentrations of Elderly Higher Than Average in Many Nonmetro Areas
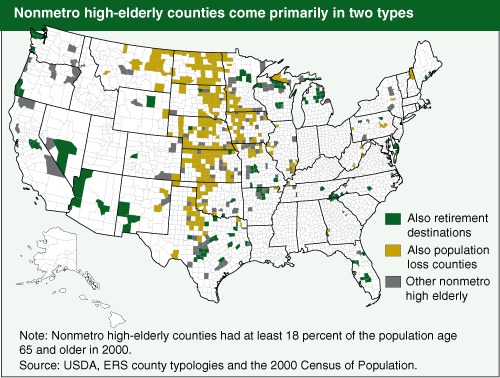
Of the 50 million people living in nonmetro counties in 2005, just under 7.5 million were age 65 and older. The difference between nonmetro and metro shares of the elderly is not dramatic on a national level (15 percent versus 12 percent), but the concentration of nonmetro elderly is much higher than average in some areas. A quarter of nonmetro counties have elderly population shares above 18 percent, reflecting two different population dynamics: a long-term pattern of net outmigration of young people from farming-dependent counties, and the migration of retirees to amenity-rich rural areas.
Population-loss counties. The majority of high-elderly counties (288 out of 536) are classified by ERS as population-loss counties (the number of residents declined in both the 1980s and the 1990s). The elderly make up 17 percent of the total population of all nonmetro population-loss counties. These counties have withstood long-term outmigration of their youth—particularly in the Great Plains and the Corn Belt—due to declining labor needs on the farm and limited alternatives to farm work. In almost all settings, the propensity to migrate is highest among 20-30 year olds, and rural-to-urban migration among young adults typically outnumbers its urban-to-rural counterstream. Net outmigration rates peaked in the 1950s and 1960s and have fluctuated since then, but even during periods of higher rural growth (such as the 1990s), outmigration exceeded inmigration among young adults.
Historically, net outmigration was not as severe in the South and the East, though farm labor requirements diminished there, too, due to dramatic productivity increases in the sector. However, these regions developed work in manufacturing and services to offset the job losses in farming. Plus they have more cities offering employment opportunities within commuting distance for rural people.
Retirement-destination counties. Among the remaining high-elderly counties, more than half (141) are classified by ERS as retirement-destination counties (the number of residents 60 and older grew by 15 percent or more between 1990 and 2000 due to inmigration). While Florida remains very popular with retirees, clusters of retirement counties have developed in the Upper Great Lakes, the Ozark Mountains, the Texas Hill country, the Great Smoky Mountains, and throughout the Southwest. The elderly make up at least 18 percent of the population in all retirement-destination counties.
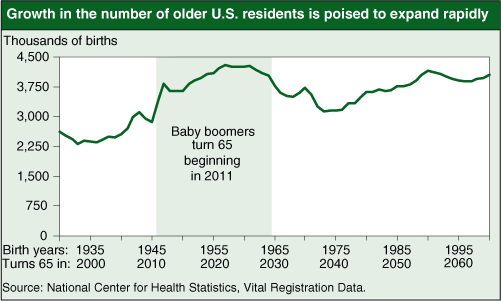
These patterns of high elderly concentrations in selected county types will be reinforced with the aging of the baby boom generation. The number of people turning 65 each year reached a low point in the first half of this decade, reflecting the small birth cohorts during the Great Depression in the 1930s, but is poised to increase rapidly beginning in 2007.
If the current nonmetro population were to remain in nonmetro areas, growth rates of the elderly from so-called aging-in-place alone would triple among the nonmetro older population. The growth rates would rise from 6 percent this decade to 18 percent in the 2010s as the baby-boom population born in the late 1940s and 1950s reaches 65.
Further, as adults become empty-nesters and retirees, their propensity to migrate to rural settings increases. Baby boomers exhibited a marked affinity for moving to rural destinations during the dot.com boom of the 1990s, long before reaching traditional retirement ages. The trend will likely resume, since the first boomers reached their 60th birthday in 2006.
Aging and Economic Development Challenges Vary by Region
Because population change due to aging-in-place and inmigration are concentrated in different areas, high-elderly nonmetro counties are becoming increasingly heterogeneous. Retiree-age newcomers to nonmetro areas tend to be better educated, wealthier, and more likely to be married than living alone, compared with the nonmetro aging-in-place population. In addition, they often relocate to nonmetro counties that contain, or are adjacent to, large cities providing a broader range of services important to this age group. Such areas often benefit from growth, as retirees boost the tax base and help sustain local businesses. On the other hand, areas with recreation development or increasing urban influence undergo increased land and housing costs, sprawl-like settlement patterns, and traffic congestion. Strains on public finances arise when new service and infrastructure costs outrun increased tax revenues.
In the nonmetro counties affected mostly by aging-in-place, older residents generally have less income, lower educational attainment, and higher dependence on Social Security income. Health services are less accessible, and fewer health care providers offer specialized services. Attracting doctors, nurses, and other service professionals is difficult for many rural areas. Generally, it is not cost effective to locate specialized facilities in sparsely populated, remote areas. These locational disadvantages are hard to overcome in areas still losing working-age persons and confronting tax base erosion.
Racial and Ethnic Nonmetro Totals Mask Local Diversity
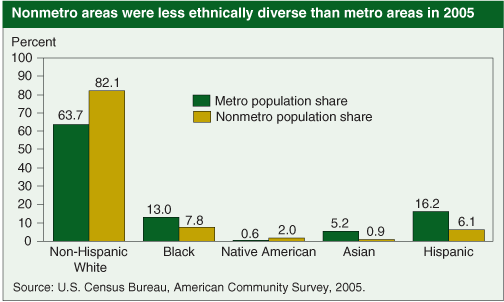
The minority share of the nonmetro population (18 percent) was half the metro share (36 percent) in 2005. Though Hispanics now make up a larger share of the metro population than Blacks, Blacks remain the largest nonmetro minority group. Native Americans are the only ethnic group with greater representation in nonmetro than in metro counties. Primarily metro residents, Asian Americans have the smallest nonmetro share of the four groups.
Yet, national averages mask the variety in racial and ethnic patterns across nonmetro areas, where local minority populations tend to be dominated by one or two groups. Examples across several U.S. regions include:
- Almost all of the 50,000 residents of Starr County, Texas, are Hispanic. Nonmetro Hispanics have concentrated in the Southwest for centuries; more recent immigrants have settled in metro areas, notably Los Angeles, Miami, Chicago, and New York. In the past two decades, however, native- and foreign-born Hispanics have settled in new nonmetro destinations, including counties in the rural Midwest and the Southeast.
- In South Dakota, 95 percent of Shannon County’s 12,500 residents are Native American. Though small in overall numbers, Native Americans are a majority in some communities, particularly in the Northern Great Plains, Alaska, and the Southwest.
- Asians of single or mixed racial backgrounds are the majority of Kauai County’s population in Hawaii. Asian Americans have concentrated in urban areas, but are also present in some rural areas, especially in Hawaii, the Pacific Northwest, and, increasingly, the Midwest. More educated Asian populations have settled in nonmetro college communities across the country.
- Brown County, Minnesota, is 97 percent non-Hispanic White. Although two-thirds of its residents claim German ancestry, less than 4 percent speak German. Many nonmetro areas are overwhelmingly non-Hispanic White, particularly in the Northeast and Midwest. This is the legacy of early settlement patterns and the selection of primarily urban destinations by 20th-century immigrants.
- Blacks in Jefferson County, Mississippi, make up 87 percent of the population. There are pronounced concentrations of Blacks that remain in parts of the nonmetro Southeast, despite vast migration to Northern cities in the first two-thirds of the 20th century.
Broader Dispersion of Foreign-Born Residents Is Increasing Diversity
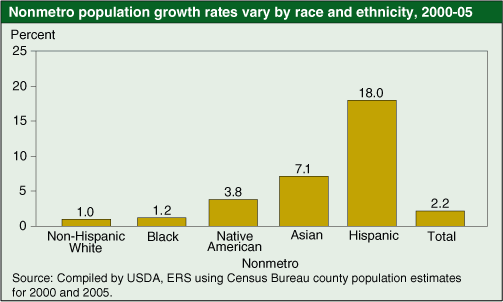
Although non-Hispanic Whites make up 82 percent of the nonmetro population, diversity is increasing more rapidly than in previous decades. The growth of the nonmetro non-Hispanic White population between 2000 and 2005 was 1.0 percent, compared with the overall nonmetro rate of 2.2 percent. This sluggish growth is a result of the relatively older age structure and small family size of non-Hispanic Whites. The two minority groups having significant shares of foreign-born residents have the highest growth rates. In nonmetro counties, the Hispanic growth rate was 18 percent over 2000-05, and the Asian growth rate was 7.1 percent.
The nonmetro Native American population grew 3.8 percent between 2000 and 2005, due mostly to above-average birth rates. A modest Black growth rate of 1.2 percent is also primarily due to natural increase.
Foreign-born immigrants add a relatively new dynamic to rural population growth: between 2000 and 2005, immigration accounted for almost 30 percent of nonmetro population growth. In fact, inmigration lowered population loss in almost 800 (78 percent) of the 1,027 nonmetro counties experiencing population loss during this period—roughly half of all nonmetro counties. In addition, it prevented population loss from occurring in 83 (8 percent) of the 1,024 nonmetro counties that gained population during this period.
Almost half of all Asians and a third of all Hispanics in nonmetro counties were born outside the United States. In 2000, the nonmetro foreign-born included 250,000 Asians, 670,000 non-Hispanic Whites, and 1,025,000 Hispanics. The Hispanic and Asian influx is due in part to changes in U.S. immigration laws in the mid-1960s that ended a bias toward immigration from European countries, and also from a growing demand for low-skill labor. Though Hispanics have been concentrated in metro areas or in the Southwest and Asians have been concentrated in metro areas, migration is now becoming more geographically dispersed as new economic opportunities, such as food processing jobs, open up in nonmetro areas.
Another factor in the higher growth rates associated with immigrant populations is their relative youth and slightly higher fertility rates. Because immigrants tend to be young adults, they are more likely to form families and have children. On average, nonmetro non-Hispanic Whites were about 14 years older than nonmetro Hispanics in 2005. Over 20 percent of non-Hispanic Whites are age 60 or older, versus less than 10 percent of Hispanics. Higher birth rates contribute to larger under-20 cohorts for Blacks, Native Americans, and Hispanics, compared with non-Hispanic Whites.
Rural Areas Face Diverging Service and Infrastructure Demands
Hispanic population growth has counteracted long-term population decline in many rural counties, especially in the Midwestern and Great Plains States where natural decrease and outmigration by young adults have been reducing population in some areas since the 1950s or earlier. A disproportionate share of the Hispanic growth in new rural destinations is from foreign-born residents.
New and diverse residents from abroad are revitalizing small towns economically and demographically. At the same time, their presence signals changes in local economic structure and raises concerns about barriers to assimilation and changing and increasing demands for social services.
Nonmetro Hispanics have less education, on average, and are more likely to be employed in lower skilled sectors such as agriculture, construction, and manufacturing. As a result, they tend to have lower incomes, are more likely to live in poverty, and less likely to own homes than non-Hispanic Whites.
Their rural neighbors, who are mostly non-Hispanic Whites, will retire from the workforce in large numbers in the coming decades. The different age distributions between these two groups imply diverging social service needs and societal contributions. More elderly non-Hispanic Whites will need retirement communities, nursing homes, and home care, while young minority families will need schools, jobs, child care, and health services suited for children and young adults. Age distribution differences also imply that the integration and mobility of new rural residents and their children are critical to the economic and social well-being of many rural communities.
This article is drawn from:
- Population & Migration. (n.d.). U.S. Department of Agriculture, Economic Research Service.
- Kandel , W. (2005). Rural Hispanics At A Glance. U.S. Department of Agriculture, Economic Research Service. EIB-8.
You may also like:
- Rural Classifications. (n.d.). U.S. Department of Agriculture, Economic Research Service.
- Reeder, R. & Brown, D. (2005). Recreation, Tourism, and Rural Well-Being. U.S. Department of Agriculture, Economic Research Service. ERR-7.
- Rogers, C. (2000). Changes in the Older Population and Implications for Rural Areas. U.S. Department of Agriculture, Economic Research Service. RDRR-90.
- Changes in the Older Population and Implications for Rural Areas. (2000). Economic Research Service. RDRR-90..


