
Data Feature
- by Karen Hamrick and Kristina J. Shelley
- 11/1/2005
How Much Time Do Americans Spend Preparing and Eating Food?
The American Time Use Survey (ATUS) collects information on how Americans spend a critical resource—their time. According to the 2003 data, employed men worked about an hour more than employed women on an average day, and about one-third of employed individuals worked on a given weekend day. About 20 percent of men reported doing housework at home on an average day compared with 55 percent of women. Half of all leisure time for both men and women was spent watching TV.
The Survey reports on time spent on work, household chores, child care, recreation, and numerous other activities. Estimates from the Survey show the range of detailed activities performed daily, how much time is spent in each activity, and how time is allocated by demographic group, labor force status, and weekdays versus weekends. Starting in 2005-06, the Survey will include an ERS-developed module consisting of questions designed to examine time use; purchasing, preparing, and consuming food; and obesity.
Sponsored by the Bureau of Labor Statistics (BLS) and conducted by the U.S. Census Bureau, the ATUS is a continuous, monthly survey that started in January 2003. Time diaries were collected from about 21,000 individuals in 2003 and about 14,000 in 2004 (due to a sample reduction). One individual from each sampled household is interviewed about his or her time use for the 24-hour period on the day before the interview (the “diary” day). Survey respondents are asked to identify their primary activity if they were engaged in more than one activity at a time. Results from 2003 and 2004 are available.
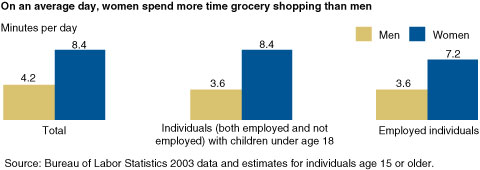
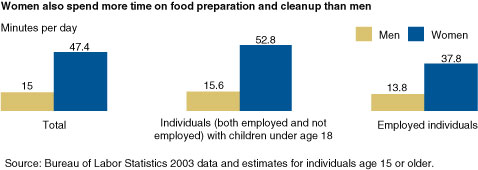
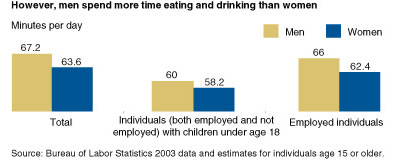
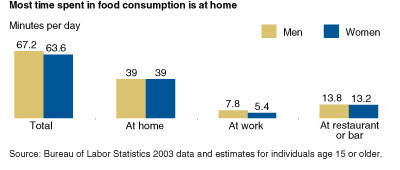
The basic Survey also provides estimates of time spent in several food-related activities, such as grocery shopping; buying other food, such as prepared food; food preparation and cleanup; and eating and drinking as a main activity. All women—both employed and not employed—spent more time, on average, than did men on grocery shopping and meal preparation and cleanup. Women spent an average of 8 minutes a day grocery shopping, and men, 4 minutes, averaging across the entire population, including those who did not grocery shop. About 18 percent of women grocery shop on a given day for an average of 45 minutes compared with 11 percent of men who averaged 39 minutes. Employed women spent slightly less time on these activities than other women. Most of the respondents reported some eating and drinking as a main activity, with an average of 65 minutes spent in this activity. However, 9 percent reported no eating or drinking at all. Because the Survey also collects information on a respondent’s whereabouts during most activities, the 2003 data reveal that an average of 39 minutes was spent eating and drinking at home versus an average of 13 minutes in restaurants.
The ATUS Food & Eating Module contains questions on eating while engaged in other activities, such as driving or watching TV; height and weight; participation in the Food Stamp Program and school meal programs for children; grocery shopping and meal preparation; and household income. Funded by ERS and the National Institutes of Health, National Cancer Institute, the Module was added to the core ATUS in October 2005 and will continue through December 2006, with data available in 2007.
Information obtained from the Food & Eating Module will supplement time use diaries from the core ATUS interview. The information also will allow researchers to study the relationships between obesity, eating patterns, and time use; time use patterns by food stamp recipiency status; and the relationship between the time use patterns of parents and their children’s participation in school meal programs. Findings on these topics can help inform policies on and implementation of food assistance and nutrition programs.
You may also like:
- Eating and Health Module (ATUS). (n.d.). U.S. Department of Agriculture, Economic Research Service.