
Why Hasn't Crop Insurance Eliminated Disaster Assistance?
- by Robert Dismukes and Joseph Glauber
- 6/1/2005
Agricultural production is inherently risky. Poor weather, pests, and diseases can reduce production levels. Americans have long supported government aid to farmers and ranchers facing such adverse events, though the best form of assistance has been open to debate. During the 1970s, standing disaster legislation protected major field crop producers who were enrolled in commodity programs. The Federal crop insurance program operated largely as a pilot program available for producers of selected crops in selected counties. In 1980, Congress passed the Federal Crop Insurance Act to strengthen the crop insurance program with the goal of replacing the costly disaster assistance programs.
Since then, the U.S. Government has promoted crop insurance over disaster payments as a primary risk management tool. From the outset, policymakers recognized that participation—the purchase of crop insurance policies by producers—would be key, so they included premium subsidies of up to 30 percent in the 1980 Act. When signups remained low, Congress passed legislation in 1994 and 2000 to raise subsidy levels and provide other incentives to participate.
As a result, 80 percent of eligible acreage was enrolled in crop insurance by 1995. Still, Congress has continued to pass ad hoc disaster assistance measures in reaction to drought and other adverse events. Since 2000, four such programs have been authorized, covering 6 crop years for a total cost of about $10 billion. Citing these instances, the Bush Administration is calling for reforms that would require all commodity program participants to buy crop insurance. Whether these reforms would reduce the need for disaster assistance is uncertain.
Crop Insurance Participation Can Be Measured in Several Ways
Participation can be defined as share of farms, eligible acres, or total crop value. In 2002, according to USDA’s Agricultural Resource Management Survey (ARMS), only 16 percent of U.S. farms purchased crop insurance. However, according to other USDA data, 75 to 80 percent of eligible acreage was insured, and about 41 percent of the total U.S. crop value (or 46 percent excluding hay and forage) was insured over 2002-04.
What accounts for such differences? For one thing, more than half of U.S. farms (1.2 million out of 2.2 million farms) are livestock farms, and only about 8 percent of livestock farms purchased crop insurance. (The Federal crop insurance program recently added pilot programs to insure certain types of livestock operations, but only about 1,000 policies were sold in 2004.) In contrast, almost 28 percent of crop farms purchased crop insurance.
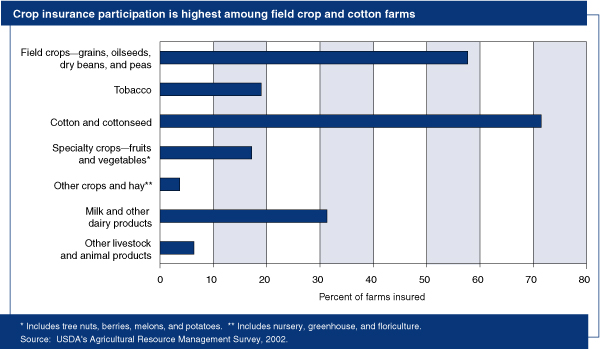
Among crop farms, crop insurance participation is most common among field crop producers. According to the 2002 ARMS, nearly 58 percent of farms that earned most of their income from grains, oilseeds, dry beans, or peas purchased crop insurance. Nearly 72 percent of cotton farms were insured, but less than one in five specialty crop producers purchased crop insurance.
Why do so few producers purchase insurance? Farm size and the importance of farm income to total household income are key considerations. Only 6 percent of the 1.3 million farms classified as rural residence farms (whose operators earn most of their income from nonfarm sources) purchased crop insurance in 2002. Such farms account for about 63 percent of U.S. farms, but less than 10 percent of agricultural production. Crop production on these farms is so minimal that off-farm income likely provides the households with adequate risk protection.
When farm income accounts for more of total household income, the share of farms that purchases crop insurance increases. About 30 percent of intermediate farms—farms with annual sales of less than $250,000 whose operators report farming as their principal occupation—were insured in 2002. Crop insurance participation increases to almost 42 percent among commercial farms—those with a minimum of $250,000 in annual sales. Commercial farms account for less than 9 percent of farms but 70 percent of output.
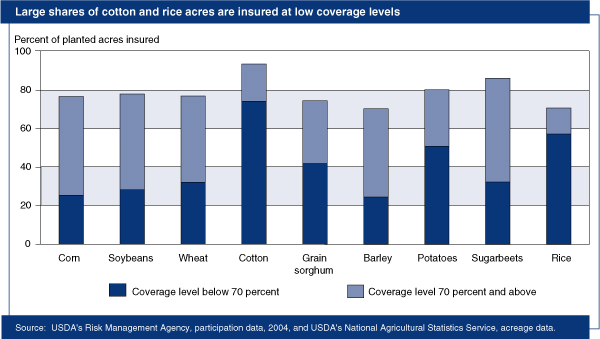
Thus, while participation rates among producers are relatively low, more than 220 million acres of crops were insured in 2004. This included 75-80 percent of corn, soybean, wheat, and cotton acres, with over half of the area insured at coverage levels of 70 percent and higher.
Efforts To Increase Participation Have Required Premium Subsidies
Historically, the Government has attempted to boost participation in crop insurance by subsidizing the insurance premiums. Under the 1980 law, which greatly expanded insurable crops, premium subsidies of up to 30 percent were offered. Still, growth in participation was sluggish. By 1994, less than 40 percent of eligible acreage was enrolled in the program, and Congress had passed ad hoc disaster assistance totaling nearly $11 billion.
In an attempt to boost crop insurance participation, the Crop Insurance Reform Act of 1994 introduced a 100-percent premium subsidy on a minimal coverage level, called CAT for catastrophic coverage. The Act also increased premium subsidy rates on coverage levels above CAT, called buy-up, or additional, coverage (see “Insurance Plans and Coverage Levels”).
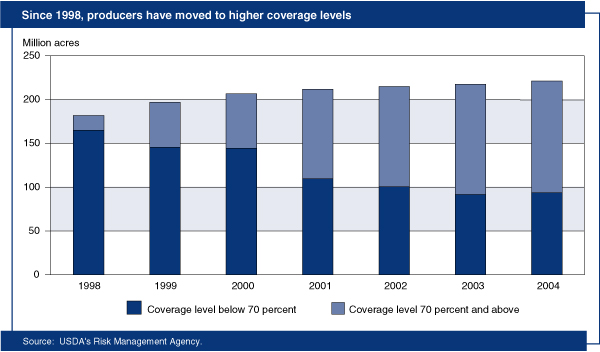
Ad hoc disaster legislation in 1998 and 1999 prompted Congress to add premium discounts in 1999 and 2000 to the existing premium subsidies. In 2000, Congress passed the Agricultural Risk Protection Act, which further increased crop insurance subsidy levels, particularly at high levels of coverage and for revenue insurance products. Insured acres increased to over 200 million acres (from 182 million in 1998), and producers have purchased higher coverage levels.
By 2004, premium subsidies totaled nearly $2.5 billion and accounted for almost 60 percent of total premium costs. Subsidies have become an increasingly costly way of encouraging participation. When subsidies are offered or increased, they are applied to all insured acres—those already insured as well as additional acres. Following the 1980 Federal Crop Insurance Act, the number of acres insured and the subsidy cost grew moderately. Insured acres exceeded 100 million acres in the late 1980s and early 1990s, when recipients of disaster assistance were required to purchase crop insurance in at least one subsequent year. During 1981-94, the cost in additional premium subsidy per additional acre insured was $3.31 in constant (2000) dollars. The Crop Insurance Reform Act of 1994 led to an increase in the marginal subsidy cost per acre insured to $10.51. After the Agricultural Risk Protection Act of 2000, the marginal subsidy cost has averaged about $26 per acre.
The Government has also mandated participation in crop insurance by linking it to other support programs. The 1994 Act required producers participating in price and income support programs to insure their crops at the CAT level. In 1995, crop insurance participation soared to over 80 percent of the eligible area. The coverage levels at which producers insured remained low, however. Over half of the area insured in 1995 was at the CAT level, which drew a full premium subsidy. Moreover, many farmers were unhappy with the mandatory linkage to commodity programs, so Congress terminated linkage after 1 year. Subsequently, CAT participation began to decline.
Another issue affecting participation has been the availability of insurance providers. Although a government program, crop insurance is delivered to farmers by private insurance companies. To entice these companies to make crop insurance widely available, the Government offers a complex set of incentives and requirements. Companies are required to sell Federal crop insurance products at the Government-approved premium rates. If they choose to sell crop insurance in a State, they must insure any eligible producer in that State. In return, companies receive administrative and operating subsidies to reimburse delivery costs. They also share in underwriting gains and losses on crop insurance policies. These subsidies add to the Government costs of providing crop insurance.
Do Producers Have Adequate Coverage?
While increasing the acres under crop insurance is one priority, there has also been a heated debate over whether insured producers have “adequate coverage.” The coverage levels are proportions of expected yield or revenue. For example, 70-percent coverage means that the producer is guaranteed 70 percent of his or her expected yield or revenue. Expected yield is typically calculated as producer’s average yield over the previous 4-10 years; expected revenue is the expected yield multiplied by the average price during a pre-planting period for a harvest-period futures contract. Many critics have pointed to the shortcomings of CAT coverage. Although CAT comes at little cost to producers, it provides little coverage: no insurance payment, or indemnity, on crop losses of up to 50 percent and a maximum indemnity of only 27.5 percent of expected revenue in the event of a total crop failure. Even coverage levels greater than CAT leave substantial portions of a producer’s expected crop uninsured. At 70-percent coverage, for example, a farmer would have to suffer at least a 30-percent drop in expected yield or revenue in order to receive an indemnity, and any indemnity would restore revenue to only 70 percent of the expected level.
In the late 1990s, concerns about the adequacy of coverage led to legislation that increased the maximum coverage available from 75 to 85 percent and raised premium subsidies on higher coverage levels. The higher premium subsidy rates reduced costs to producers and increased the share of crop acres insured at higher coverage levels. In particular, the proportion of acres at 70-percent coverage or higher grew from about 9 percent in 1998 to about 60 percent in 2004.
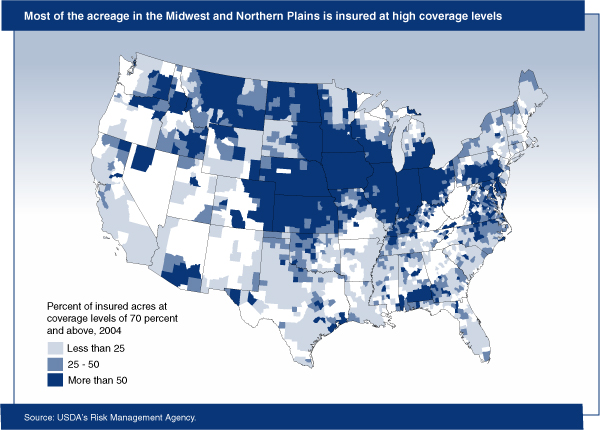
The share of acres at 70-percent coverage and higher varies considerably by region. It is generally high in the Corn Belt and Northern Plains and low in the Southern Plains, Southeast, and West. In North Dakota, Iowa, Minnesota, and Kansas, top States in acres insured, more than two-thirds of the acres insured in 2004 were at the 70-percent coverage level or higher. In Texas, also among the top States in crop insurance acres, only 17 percent of acres insured were at or above the 70-percent level.
Such differences in coverage levels likely derive from the price of insurance. Crop insurance rates, which depend on the riskiness of crop production and the type of insurance coverage, vary from region to region and from farm to farm. To compare premium rates across regions, analysts typically calculate the effective premium rate, or the total premium divided by liability for a standard coverage level and insurance type. ERS used the 65 percent coverage level for farm-level yield insurance as a standard and examined the relationship between the coverage levels chosen by producers and the premium rates in a given area. In Texas, premium rates averaged 18 percent in 2004, versus about 4 percent in Iowa. Other Corn Belt States—Illinois, Ohio, and Indiana—with large shares of acres (67.7, 76.2, and 73.5 percent) insured at or above 70 percent had low premium rates (5.4, 6.9, and 6.3 percent), too.
Premium rates are not the sole explanation for coverage levels chosen. In North Dakota, over 65 percent of acres are insured at high coverage levels even though the effective premium rate is high (13.4 percent). In California, where large areas of cotton, rice, and specialty crops are insured, the premium rates are just 6 percent, but the share of acres insured at or above 70 percent is low—about 17 percent.
As the riskiness of crop production, its effects on income, and farmers’ ability to bear risk differ from farm to farm, so does the usefulness of crop insurance. In addition to crop insurance, farmers use other means to manage crop production risks, including irrigation, crop diversification, and drawing on savings or borrowing. Producers’ perceptions of the relative costs and effectiveness of alternative risk management strategies may lead to different conclusions about the optimal level of insurance coverage.
Can Crop Insurance Replace Ad Hoc Disaster Assistance?
Currently, crop insurance participation—defined as insured acres as a percent of planted acres—is about 80 percent. Coverage levels at which producers are insuring are generally high. But coverage levels continue to be low in some regions and for some crops. Thus, while most U.S. crop production is insured, pockets of inadequate protection raise the prospect of ad hoc disaster assistance.
Drought has been the source of the largest share of crop insurance indemnities. From 1989 to 2004, drought was listed as the primary cause of loss for about 40 percent of indemnities. Excessive moisture, rain, or flood accounted for about 30 percent, followed by frost, freeze or cold weather, and hail, each of which accounted for about 10 percent of indemnities.
Does crop insurance need to be strengthened for it to be the primary form of disaster aid to farmers and ranchers? The use of premium subsidies to encourage insurance participation and to raise coverage levels is costly. Additional subsidies are not likely to boost participation in large areas of the U.S. where it is already high.
The Bush Administration’s proposal would mandate participation by linking it to other farm program benefits. This requirement would likely bring more acres into the crop insurance program. However, cuts in subsidies may lead some producers to reduce their coverage levels. In the end, whether participation and coverage would be adequate to forestall future ad hoc disaster assistance legislation will depend on perceptions of coverage, the fiscal environment, and the political decisions of Congress and the Administration.
This article is drawn from:
- Farm Practices & Management. (n.d.). U.S. Department of Agriculture, Economic Research Service.
- Crop Insurance Reconsidered. (2004). American Journal of Agricultural Economics. Vol. 86, No. 5, pp. 1179-1195.
We’d welcome your feedback!
Would you be willing to answer a few quick questions about your experience?