
Wheat ranks third (behind corn and soybeans) among U.S. field crops in planted acreage, production, and gross farm receipts. In 2024/25, U.S. farmers are estimated to have produced a total of 1.97 billion bushels of winter, spring, and Durum wheat from a harvested area of 38.5 million acres (which is up year to year) though planted area is down. Wheat plantings and production have followed a long-term downward trend, although the decline in production is partly mitigated by rising yields. Since peaking in 1981, U.S. wheat area planted has declined by 42 million acres and production has decreased by about 800 million bushels.
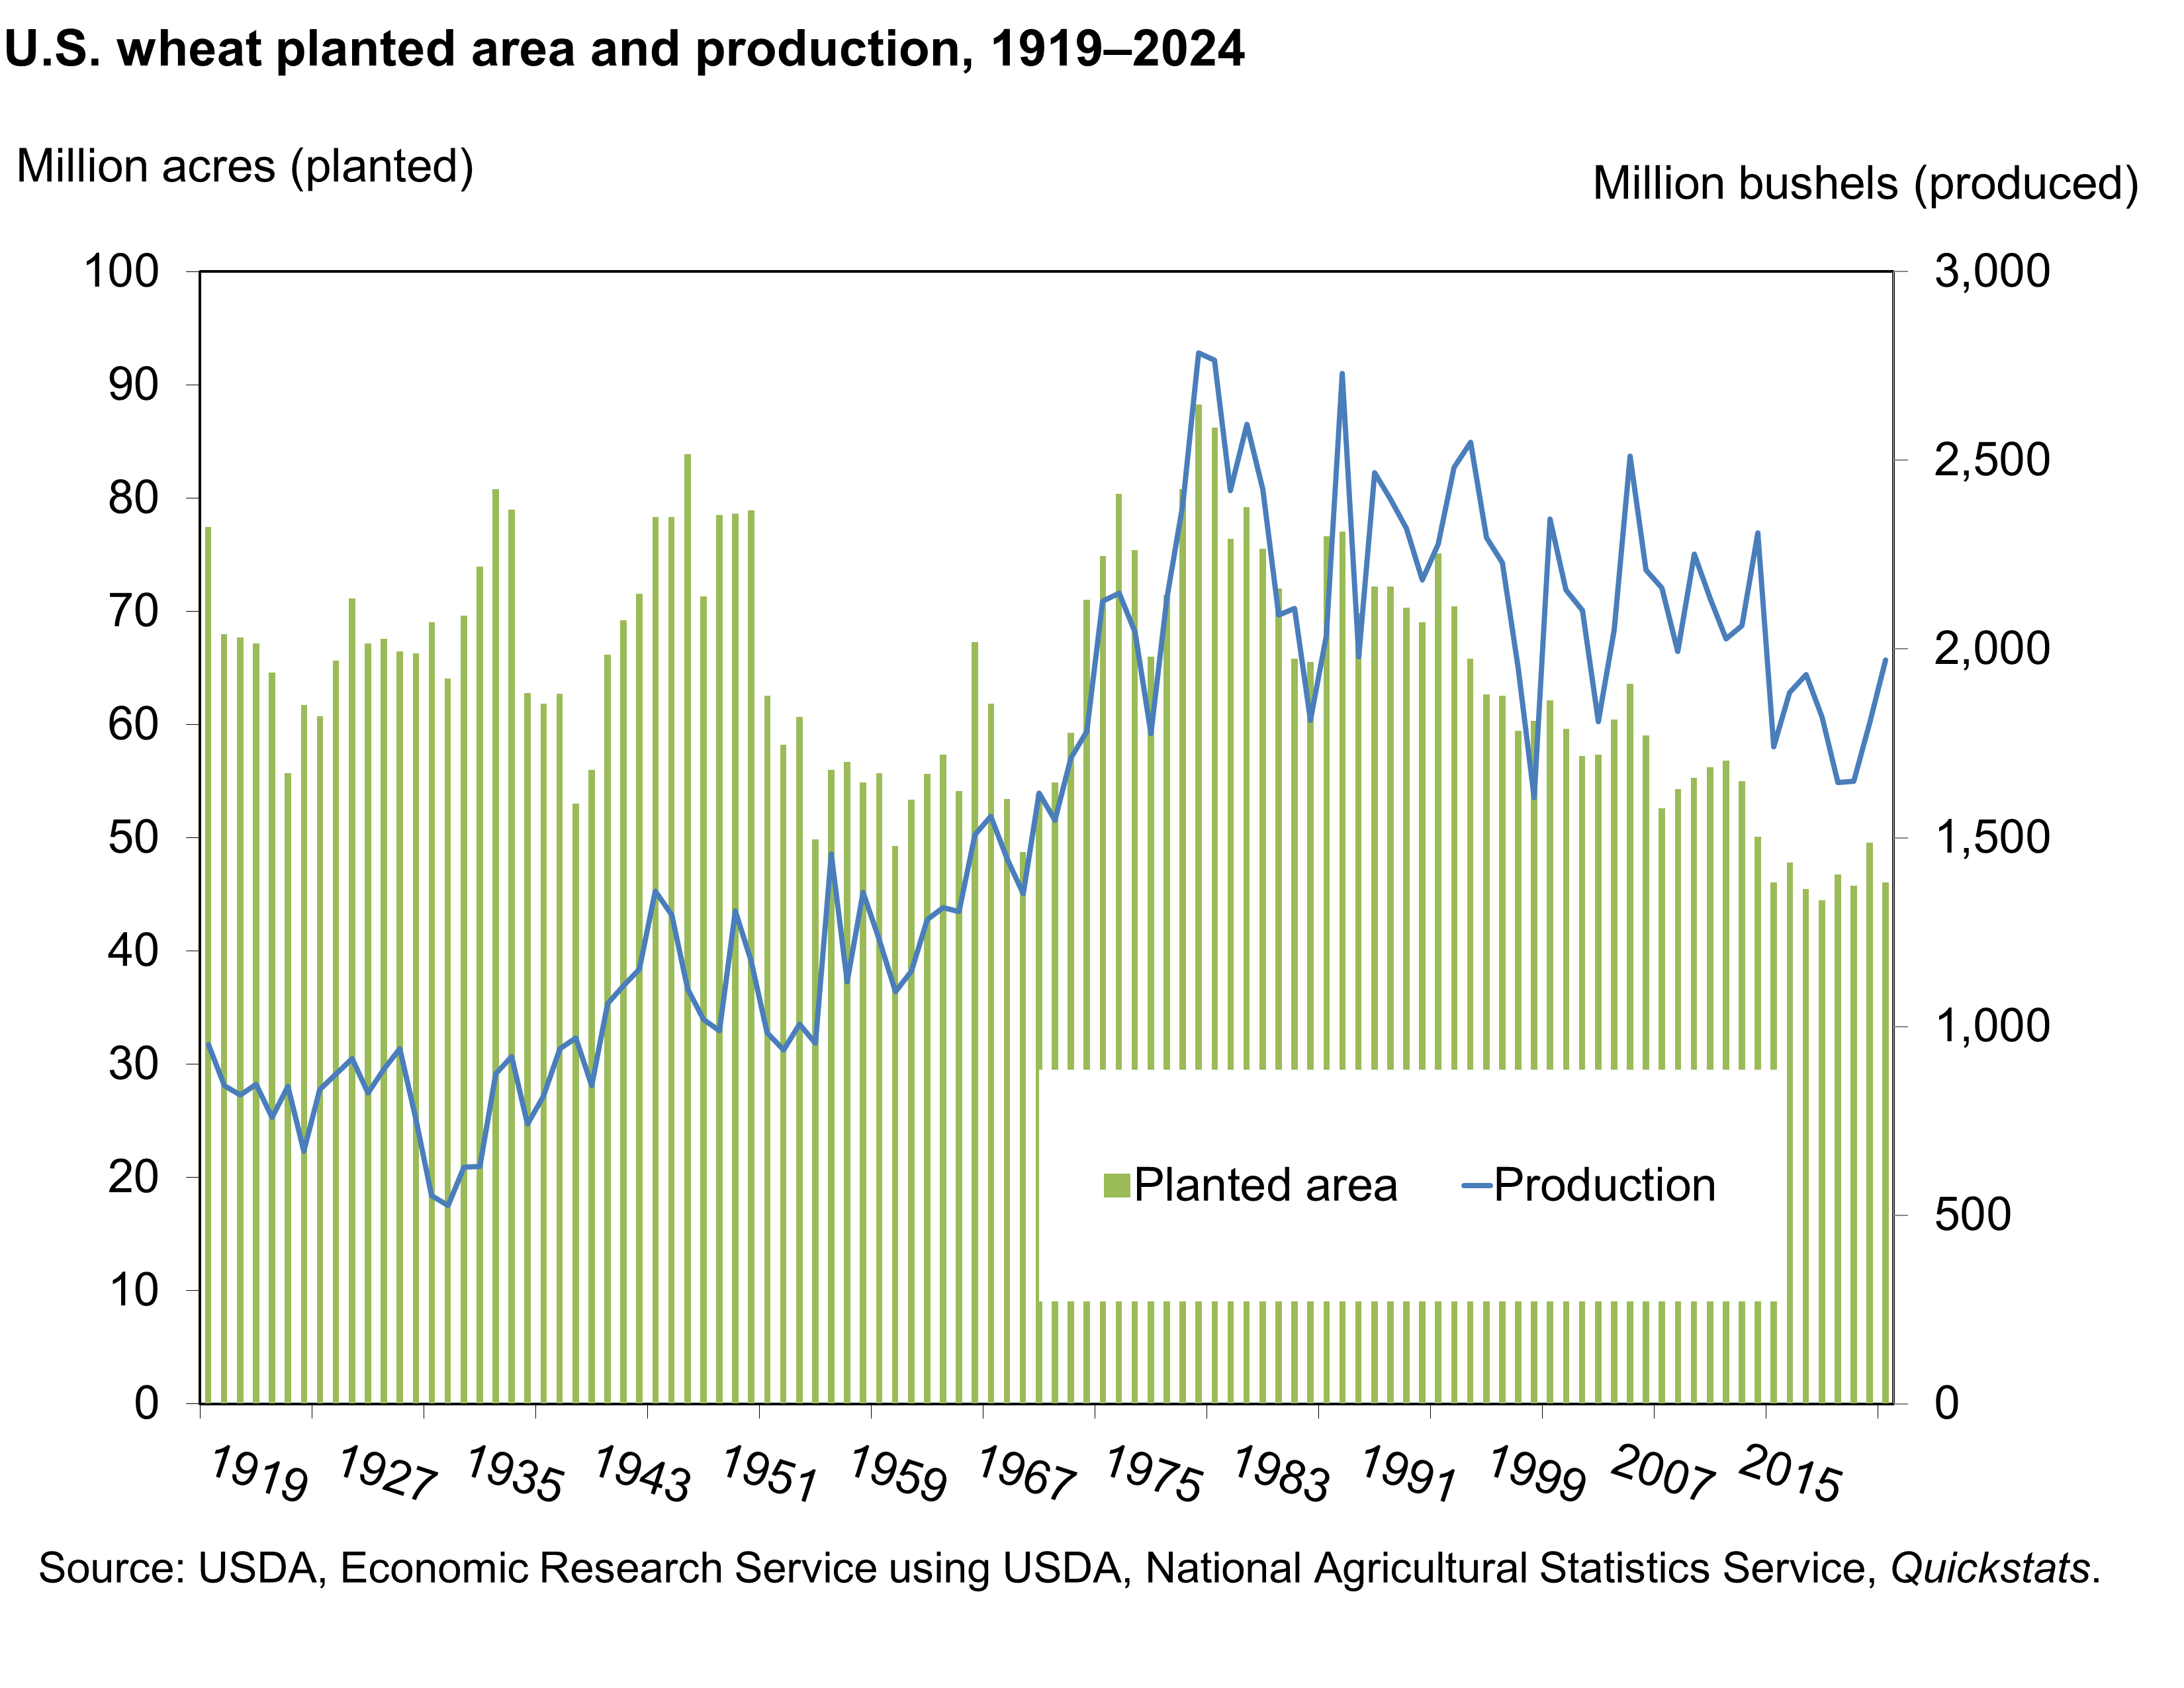
Download chart data in Excel format.
As competition in global wheat markets has grown, farmers’ returns for planting wheat in the United States have declined relative to other crops, which has motivated some farmers to reduce wheat plantings. Changes in farm legislation in the mid-1990s that allowed farmers more flexibility when choosing crops to plant also reduced wheat acreage.
Specifically, the 1996 Farm Act strengthened the market orientation of crop planting by eliminating the requirement that farmers maintain base acreage of a crop to qualify for Government payments. In addition, area planted for wheat lost ground to technological innovations that improved production prospects for corn and soybeans. Genetic improvement has been slower for wheat due to the food grain’s significantly more complex genetics and lower potential returns from research investments. Farmers grow wheat primarily for human food use, and U.S. food processors are wary of consumers’ reactions to products containing genetically modified wheat. No genetically modified wheat is commercially grown in the United States.
U.S. Wheat Classes
Wheat is the principal food grain produced in the United States. The three primary varieties of the grain domestically sown are winter wheat, spring wheat, and durum wheat.
Winter wheat varieties are sown in the fall and usually become established before going into dormancy when cold weather arrives. In the spring, plants resume growth and grow rapidly until the summertime harvest. Winter wheat production represents nearly 70 percent of the total U.S. production, on average.
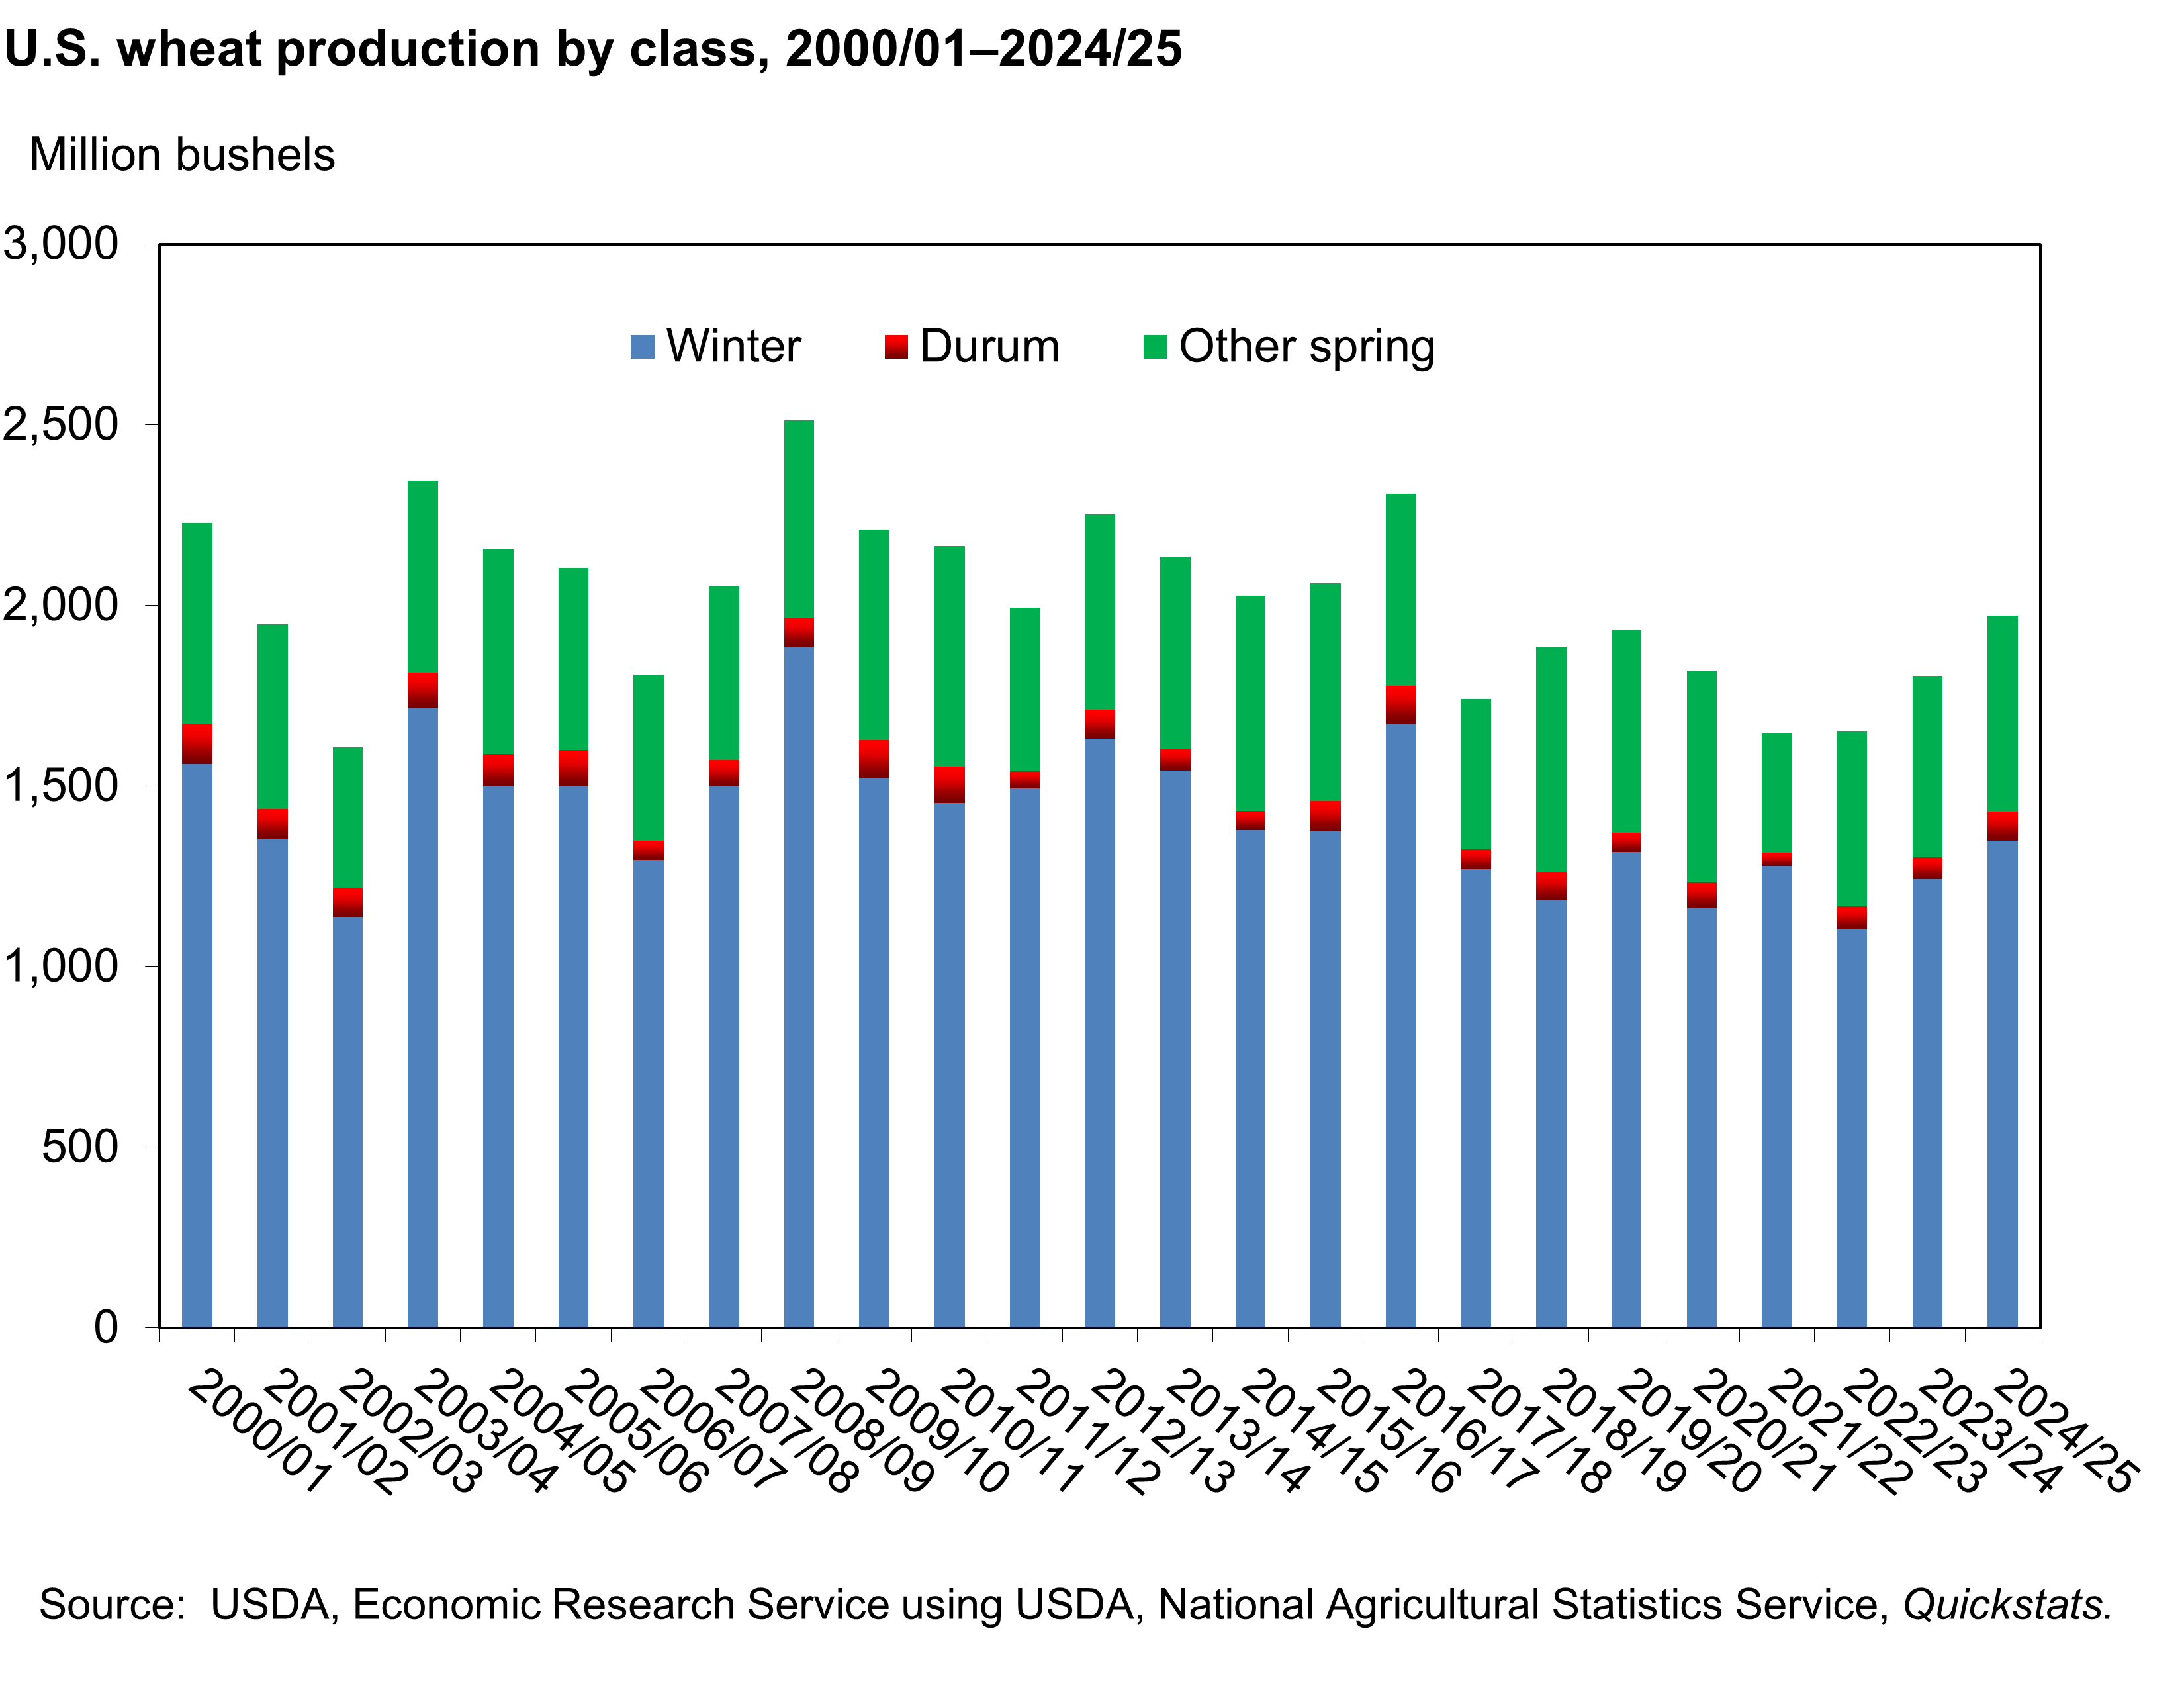
Download chart data in Excel format.
Winters are harsh in the Northern Great Plains States of Minnesota, Montana, North Dakota, and South Dakota—so winter-wheat plantings are limited, and spring or Durum varieties are favored. Spring and Durum wheat are typically planted as soon as soil conditions permit in mid-March through May and are harvested in the late summer or fall of the same year. Spring wheat typically constitutes about 25–30 percent of total U.S. wheat production, or 340 million to more than 600 million bushels. Durum wheat is the smallest of the 3 major wheat categories and typically accounts for less than 75 million bushels, or 2–5 percent of the total U.S. wheat production.
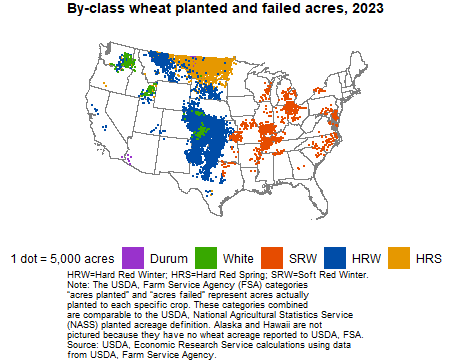
The three categories of wheat can be disaggregated into five major classes: Hard Red Winter, Hard Red Spring, Soft Red Winter, White, and Durum. Each class has a somewhat different end use and its production tends to be region-specific.
- Hard Red Winter (HRW) wheat accounts for about 40 percent of total U.S. wheat production and is grown primarily in the Great Plains (northern Texas through Montana). HRW is principally used to make bread flour.
- Hard Red Spring (HRS) wheat accounts for about 25 percent of wheat production and is grown primarily in the Northern Plains (North Dakota, Montana, Minnesota, and South Dakota). HRS wheat is valued for its high protein levels, which makes it suitable for specialty breads and blending with lower protein wheat.
- Soft Red Winter (SRW) wheat typically accounts for about 15–20 percent of the total wheat production and is grown primarily in States along the Mississippi River and in the East. Flour produced from milling-grade SRW is used for cakes, cookies, and crackers.
- White wheat (both winter and spring) accounts for 12–17 percent of the total wheat production and is grown in Washington, Oregon, Idaho, Michigan, and New York. White wheat flour is used for noodle products, crackers, cereals, and crusted white breads.
- Durum wheat accounts for 2–5 percent of the total wheat production and is grown primarily in North Dakota and Montana. Durum wheat is used in pasta production.
Download chart data in Excel format.
Wheat milling byproducts—such as bran (the outer seed coat of a wheat kernel), shorts (more inward layers of the seed coat that contain some starchy or floury components), and middlings (an intermediate product of a combination of bran and shorts)—are used to produce animal feeds.
U.S. Wheat Use
U.S. consumer demand for food products made from wheat flour is relatively stable and largely unaffected by changes in wheat prices or disposable income. However, wheat demand is closely tied to population and changing consumer tastes and preferences.
The strength of the domestic market for wheat developed because of a historic turnaround in U.S. per capita wheat consumption in the 1970s. For nearly 100 years, per capita wheat consumption declined in the United States as diets diversified to include substitute carbohydrates such as potatoes and rice. Wheat consumption dropped from more than 225 pounds per person in 1879 to 180 pounds in 1925, before bottoming out at 110 pounds in 1972. Per capita consumption began to steadily rise and had rebounded to 147 pounds per capita by 1997. The rise in consumption benefited the U.S. wheat processing industry, and the industry expanded and modernized.
The decades-long growth in per capita U.S. wheat consumption ended in 1997. Changing consumer preferences, led by the adoption of low-carbohydrate diets, again reduced per capita wheat consumption. Consumer interest in these diets spiked in the early 2000s, resulting in a decline in bread consumption and—ultimately—in per capita flour consumption. By 2005, per capita flour consumption had fallen to 134.4 pounds. As interest in low-carbohydrate diets abated, per capita use grew modestly for the next 3 years. Starting in 2008, rising consumer interest in gluten-free foods and renewed promotion of low-carbohydrate diets again put downward pressure on per capita wheat food-use. USDA’s Economic Research Service (ERS) estimates per capita wheat flour use at 128.9 pounds in 2024.
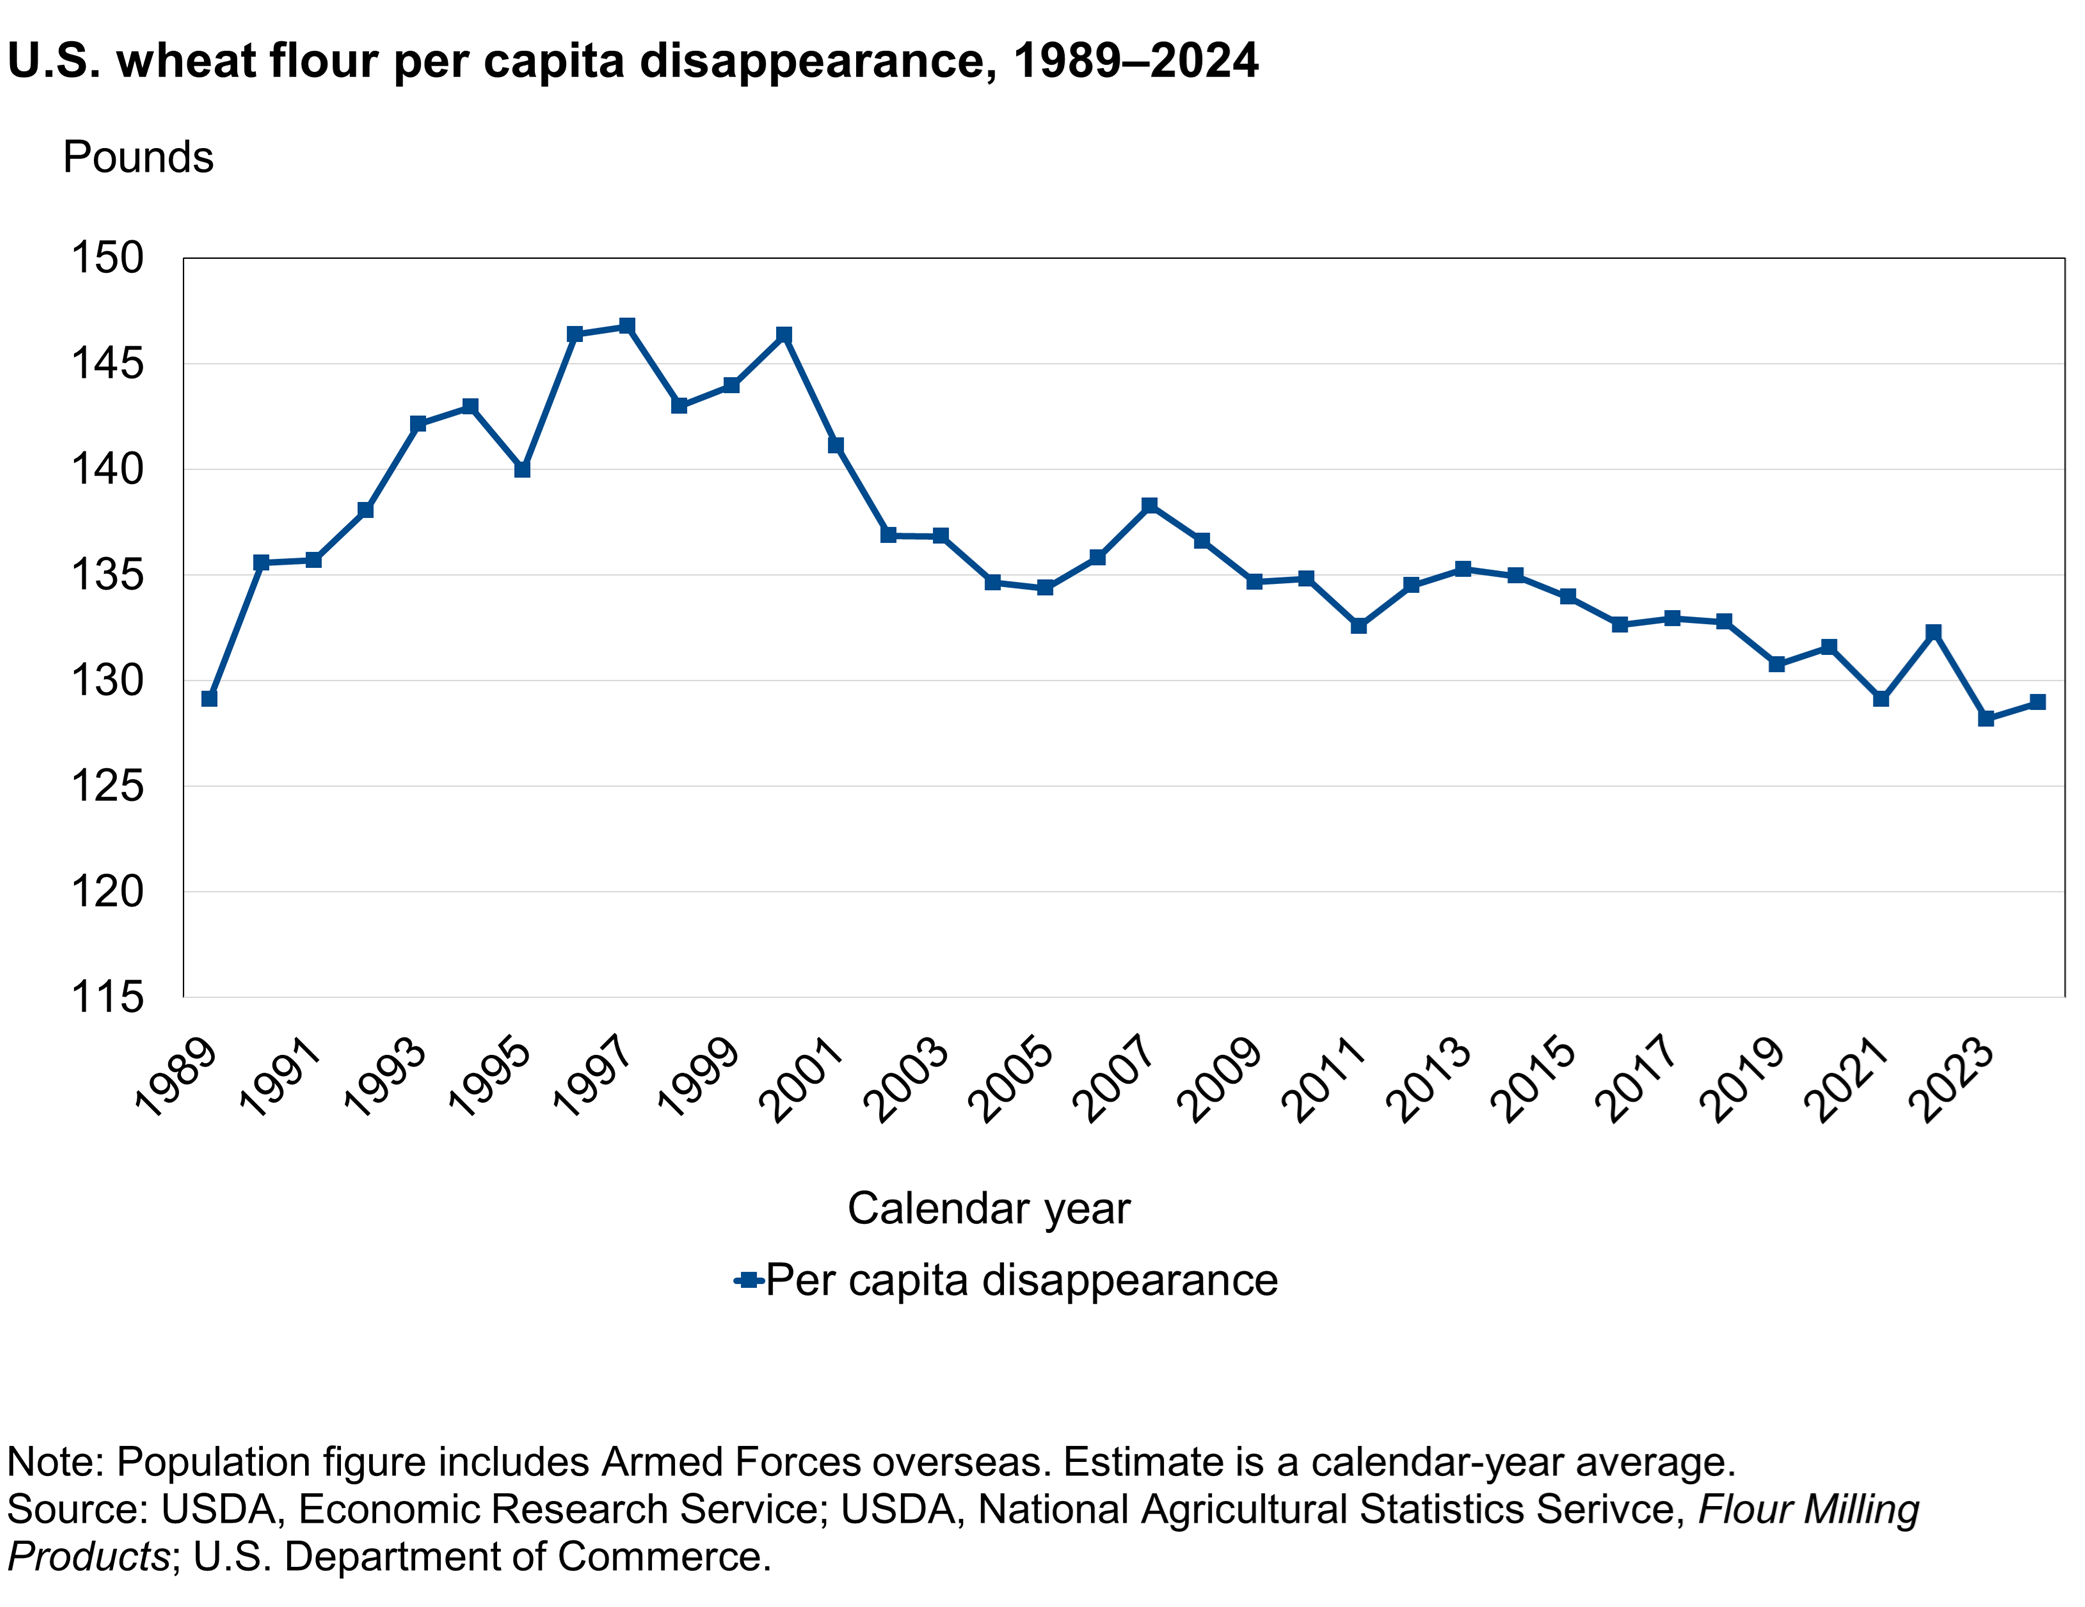
Download chart data in Excel format.
U.S. Wheat Trade
The United States is a major wheat exporter, even though it typically produces only about 6–7 percent of the world’s wheat. Although Russia and the European Union are the top world wheat exporters, the United States routinely ranks among the top five global wheat exporters. Rising global populations and incomes, especially in low- and middle-income countries, encouraged the expansion of world wheat consumption and the global wheat trade. Despite expanding global wheat trade, the U.S share of global wheat exports is trending lower, forecast at around 11 percent for the 2024/25 wheat international trade year (July–June).

Download chart data in Excel format.
U.S. imports of wheat grain, mostly from Canada, have grown from less than 0.1 million metric tons in the 1970s to an average of 2.3 million metric tons over the last 10 complete marketing years (2014/15–2023/24). Imports of wheat flour and products have averaged around 1.1 million metric tons annually over the same 10 years. Flour and product import volumes are expressed in wheat grain equivalent, which is the quantity of wheat needed to produce a certain amount of flour and products. Wheat-product imports consist mainly of pasta and noodles from Canada, the European Union, and Asia. Historical data for U.S. wheat imports and exports are available in the USDA, ERS Wheat Data product as well as in the USDA, Foreign Agricultural Service at Global Agricultural Trade System (GATS).
To explore by-class wheat trade data in greater detail, see the USDA, ERS Wheat Data Visualization. This tool also explores a variety of other elements included in USDA, ERS wheat data tables.
World Wheat Trade
Since 2000, nearly 90 percent of world wheat exports were accounted for by the United States, the European Union, Canada, Australia, Argentina, and the former Soviet Union (including the 3 major wheat exporters Russia, Ukraine, and Kazakhstan). Prior to 2000, these exporters combined to represent 95 percent or more of world wheat exports.
Although a handful of nations dominate wheat exports, there are numerous wheat-importing countries. Most wheat is imported by developing countries that have limited wheat production potential. Wheat is a staple food in many low- and middle-income countries. Rising populations in various parts of the world combined with strong economic growth, increase the demand for both milling-quality and feed wheat. Most of these countries have limited abilities to expand wheat production, which increases the global demand for wheat imports. The largest growth markets for wheat imports include Africa—both North (Egypt, Algeria, and Morocco) and Sub-Saharan (Ethiopia, Kenya, Nigeria, South Africa, and Sudan)—the Middle East (Iran, Jordan, Lebanon, Saudi Arabia, and Syria), and Southeast Asia (Indonesia, the Philippines, and Vietnam).