
Pumpkin production is widely dispersed throughout the United States, with crop conditions varying by region. All States produce some pumpkins, but six States produce most of them. According to the most recent USDA, Census of Agriculture, in 2022, about 45 percent of pumpkin acres were harvested in the top six pumpkin-producing States, measured by pumpkin weight. Every year, USDA surveys top pumpkin-producing States and publishes the data the following year.
In 2023, Illinois maintained its leading position in pumpkin acreage, harvesting more than twice as many pumpkin acres as any of the other top States, at 15,400 acres. In the same year—California, Indiana, Michigan, Pennsylvania, and Washington—each harvested between 2,800 and 6,500 acres.

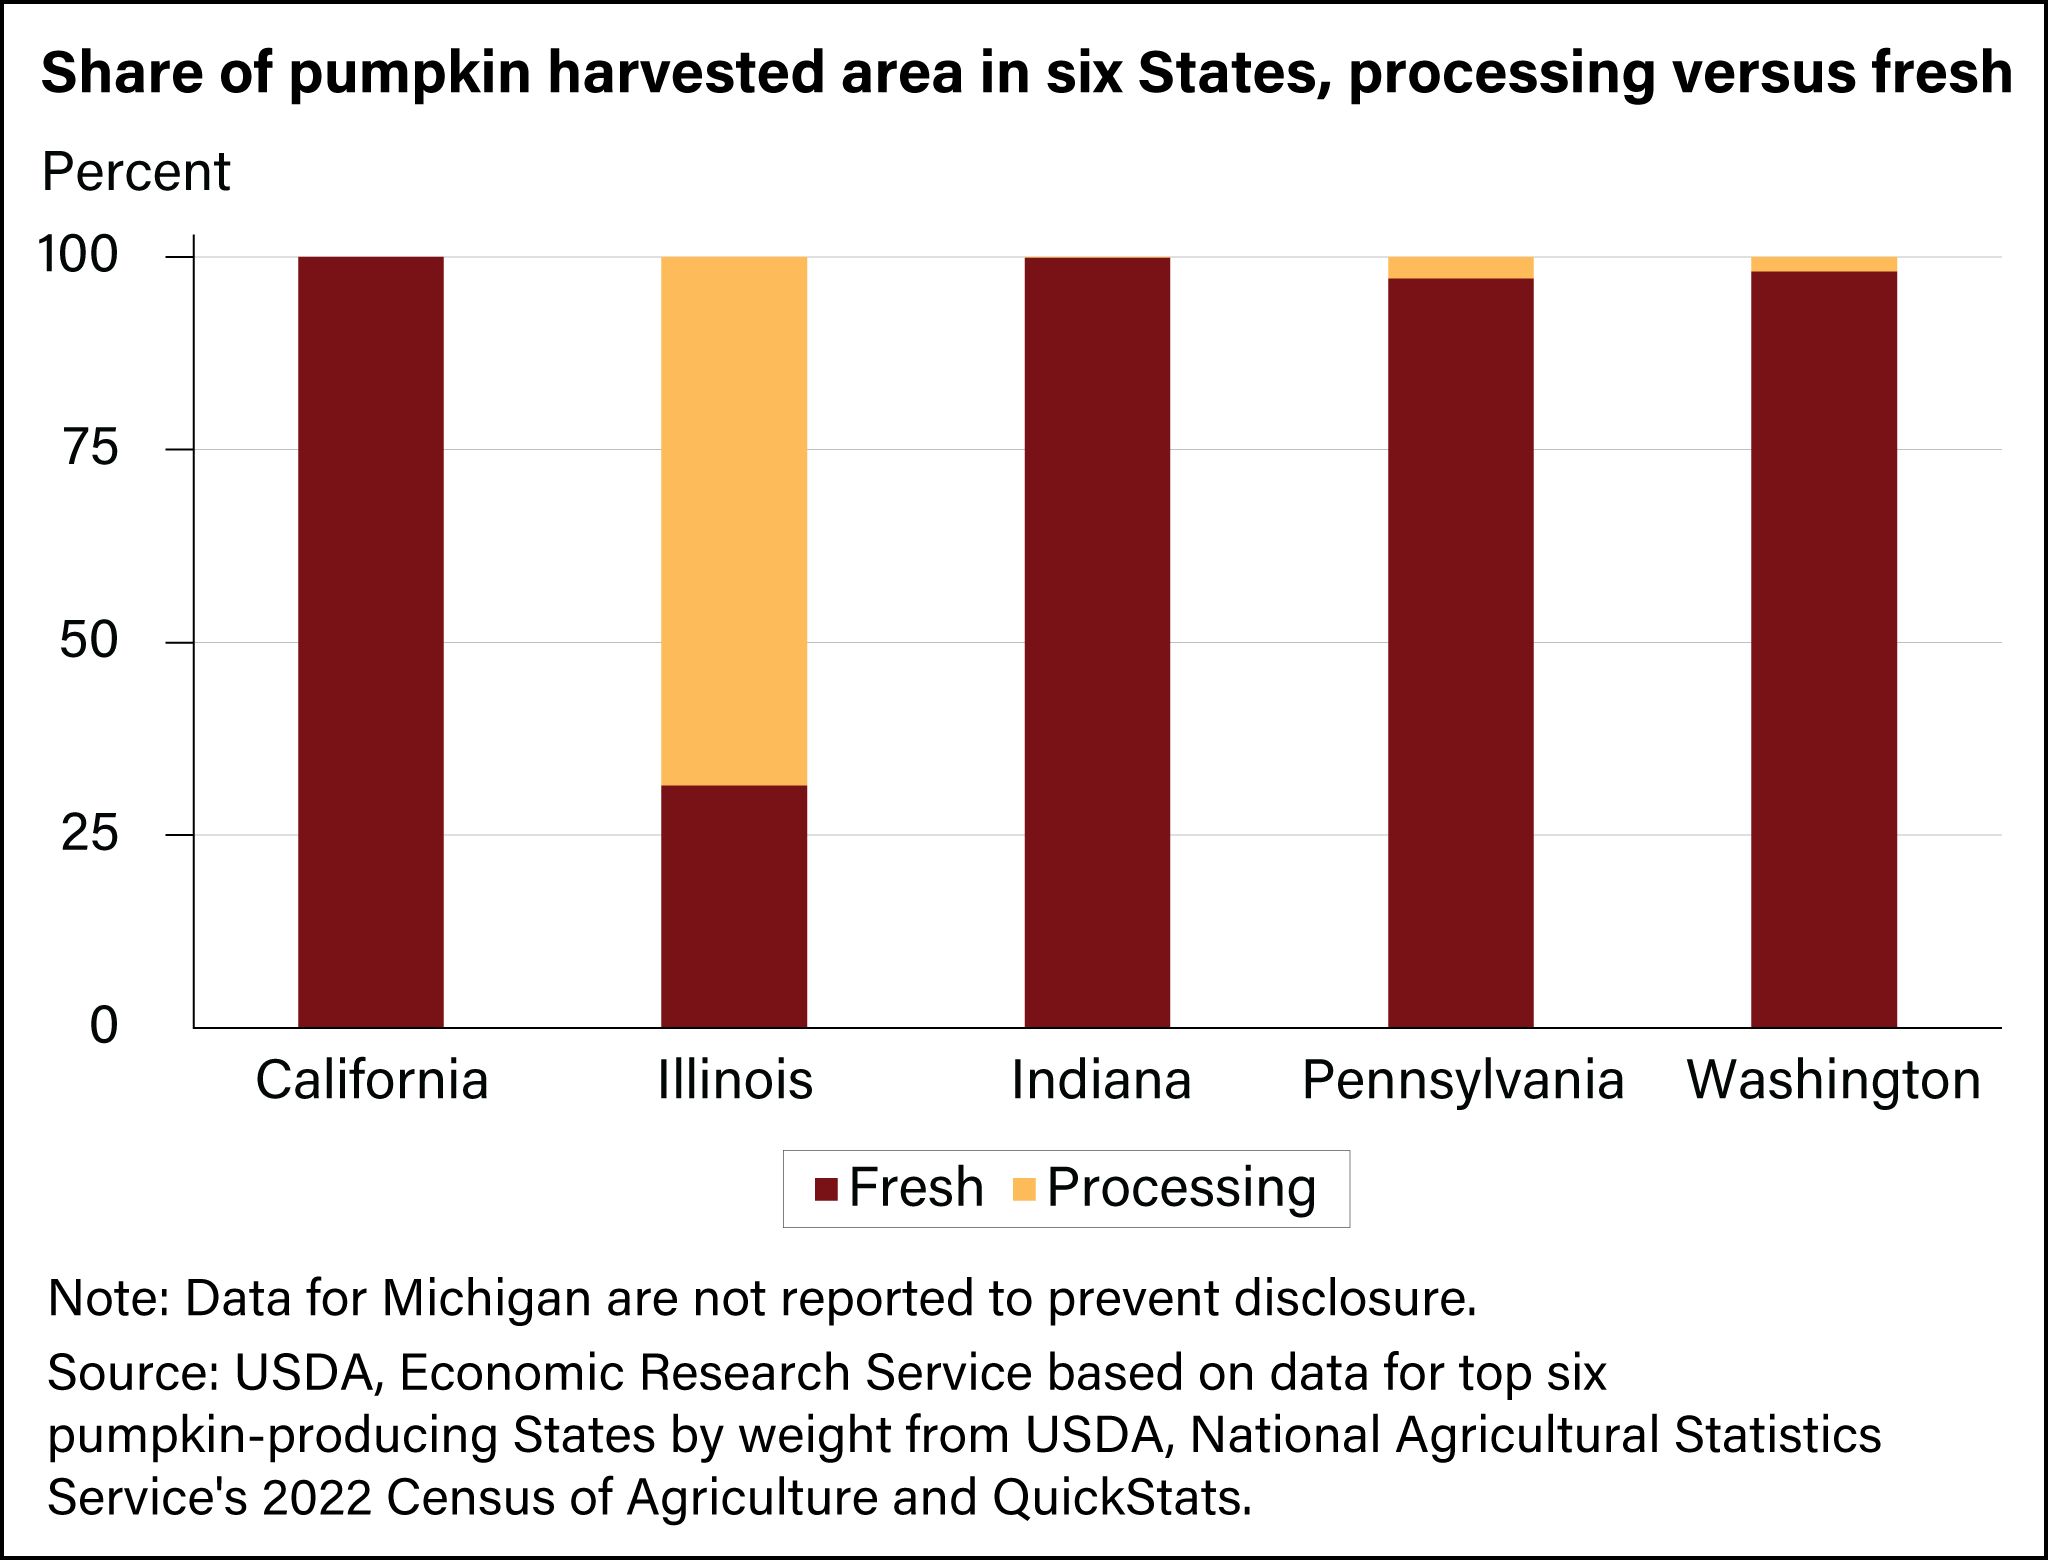
Illinois harvests the largest share of pumpkin acreage among all States and an even larger share of processing acres. The most recent available data indicate that almost 70 percent of pumpkin acres in Illinois are devoted to varieties destined for pie filling or other processing uses—compared with about 3 percent in Pennsylvania and even less in Washington, Indiana, and California. This difference in the type of pumpkin most commonly grown in Illinois helps to explain differences in yield and price between Illinois and other top States.
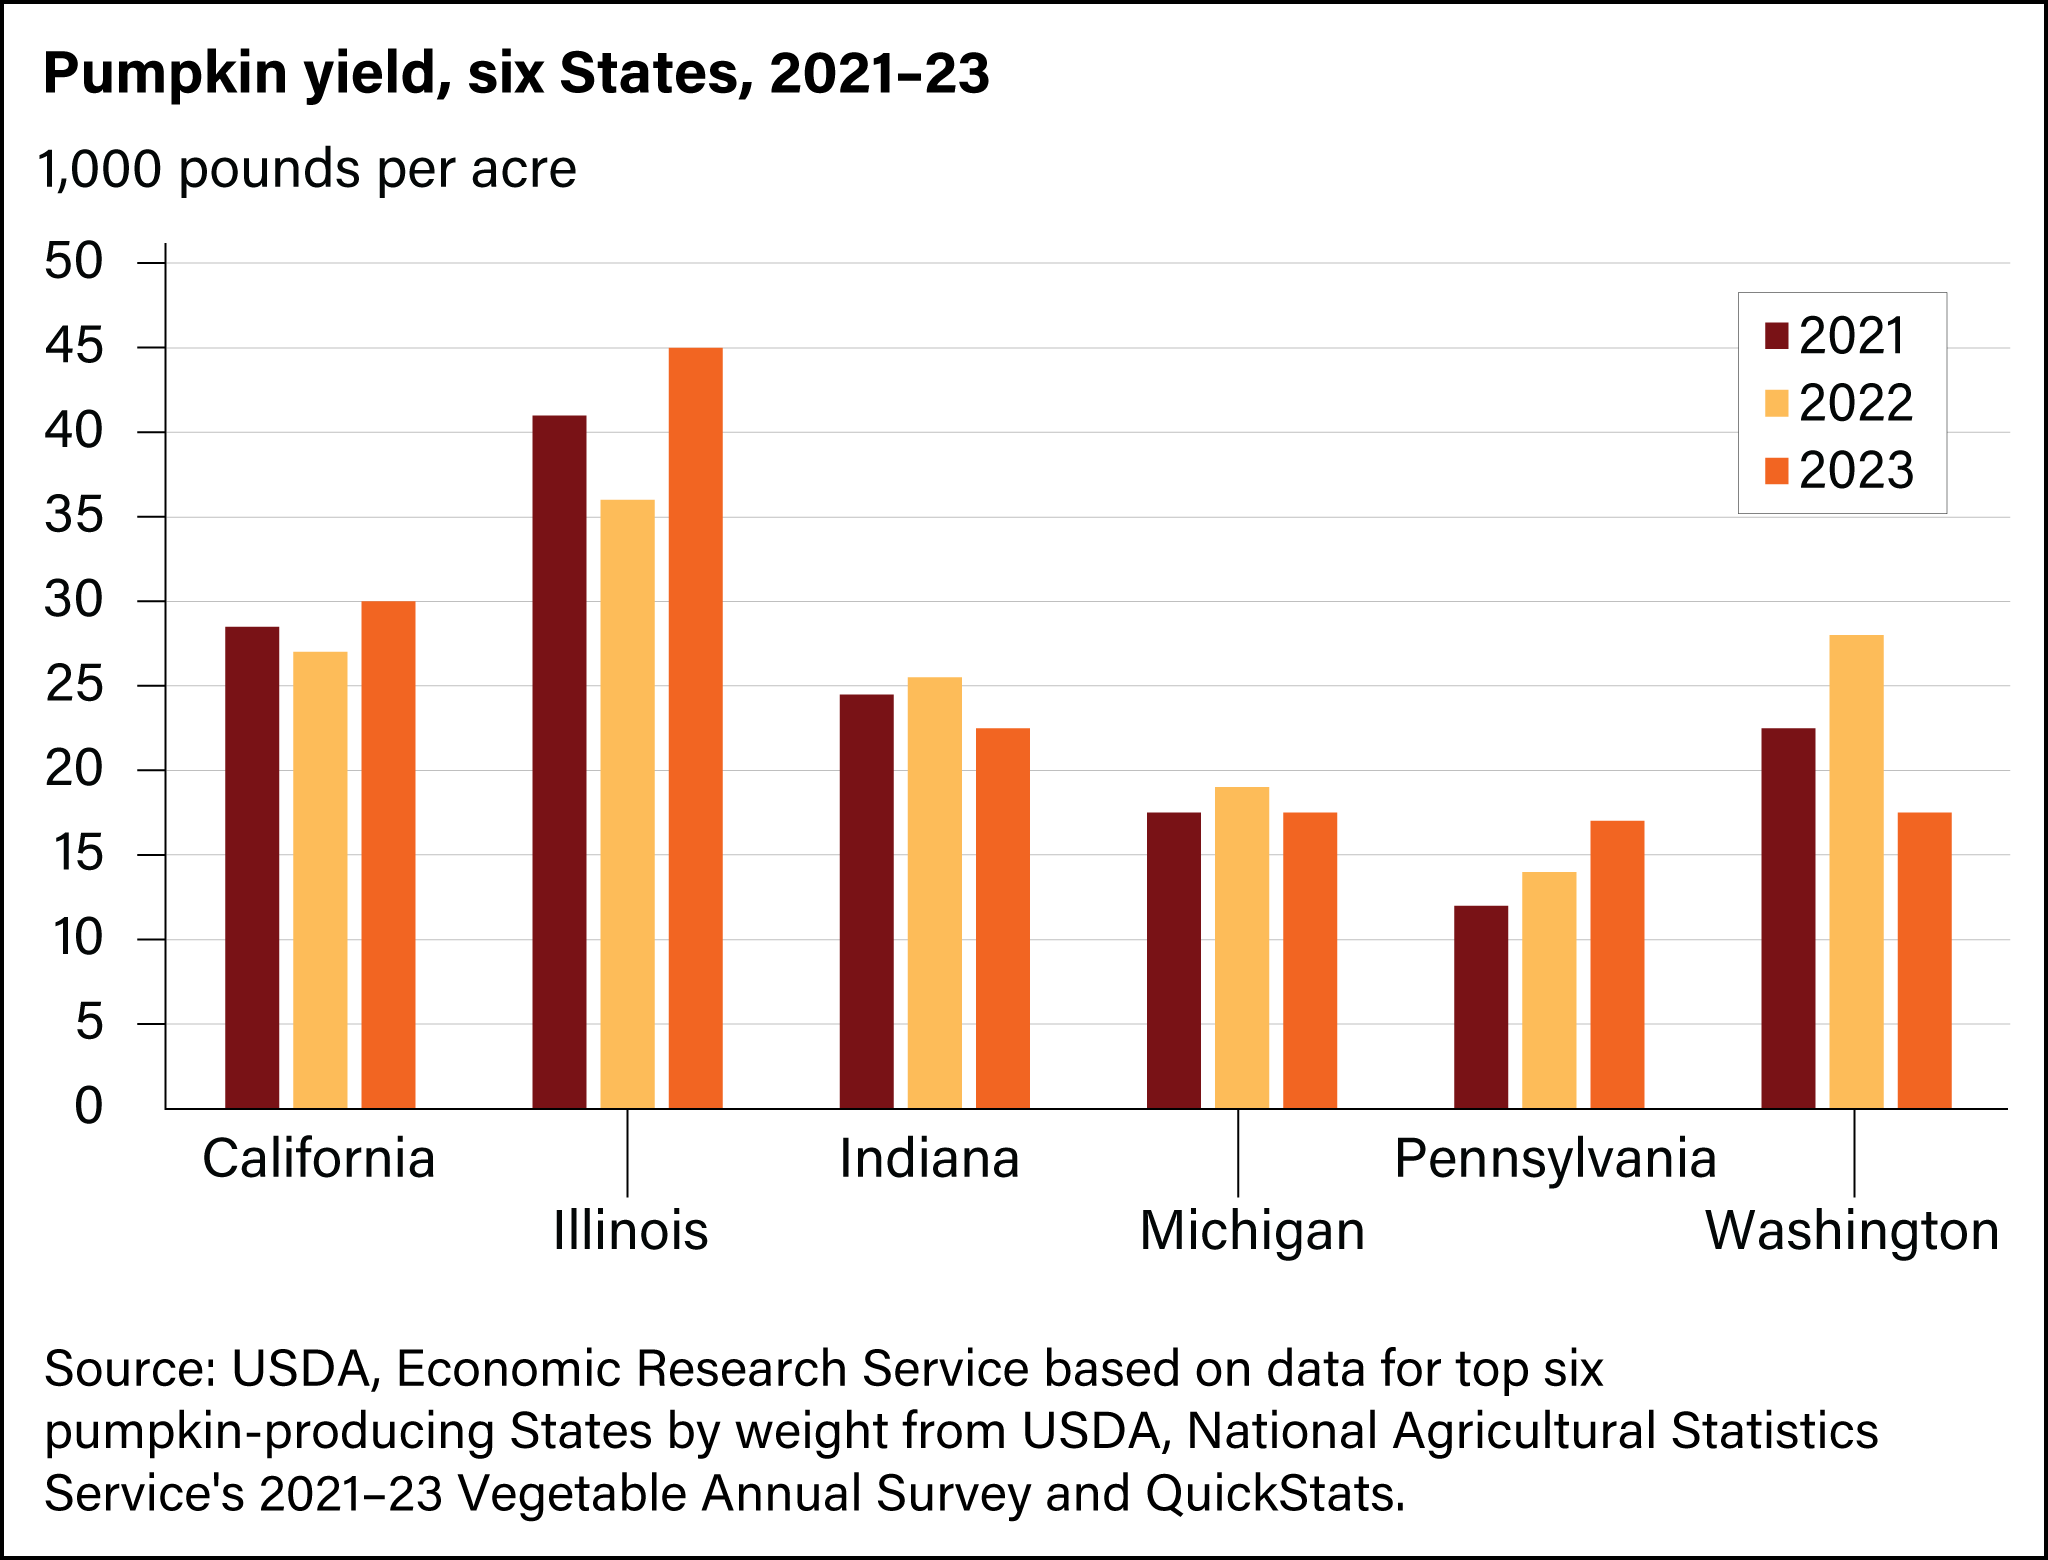
Yields vary substantially among States and over years within a State, depending on pumpkin varieties and growing conditions. On average for the period 2021–23, rounded to the nearest five thousand, Illinois grows about 40,000 pounds per acre (predominantly pie varieties for processing into products like pumpkin puree). California grows about 30,000 pounds per acre on average, Indiana and Washington about 25,000, Michigan about 20,000, and Pennsylvania about 15,000 pounds per acre. Yield can vary each year, rounded to the nearest hundred—from as much as 10,500 pounds per acre in the case of Washington from 2022 to 2023—to as little as 1,000 pounds per acre in the case of Indiana from 2021 to 2022.
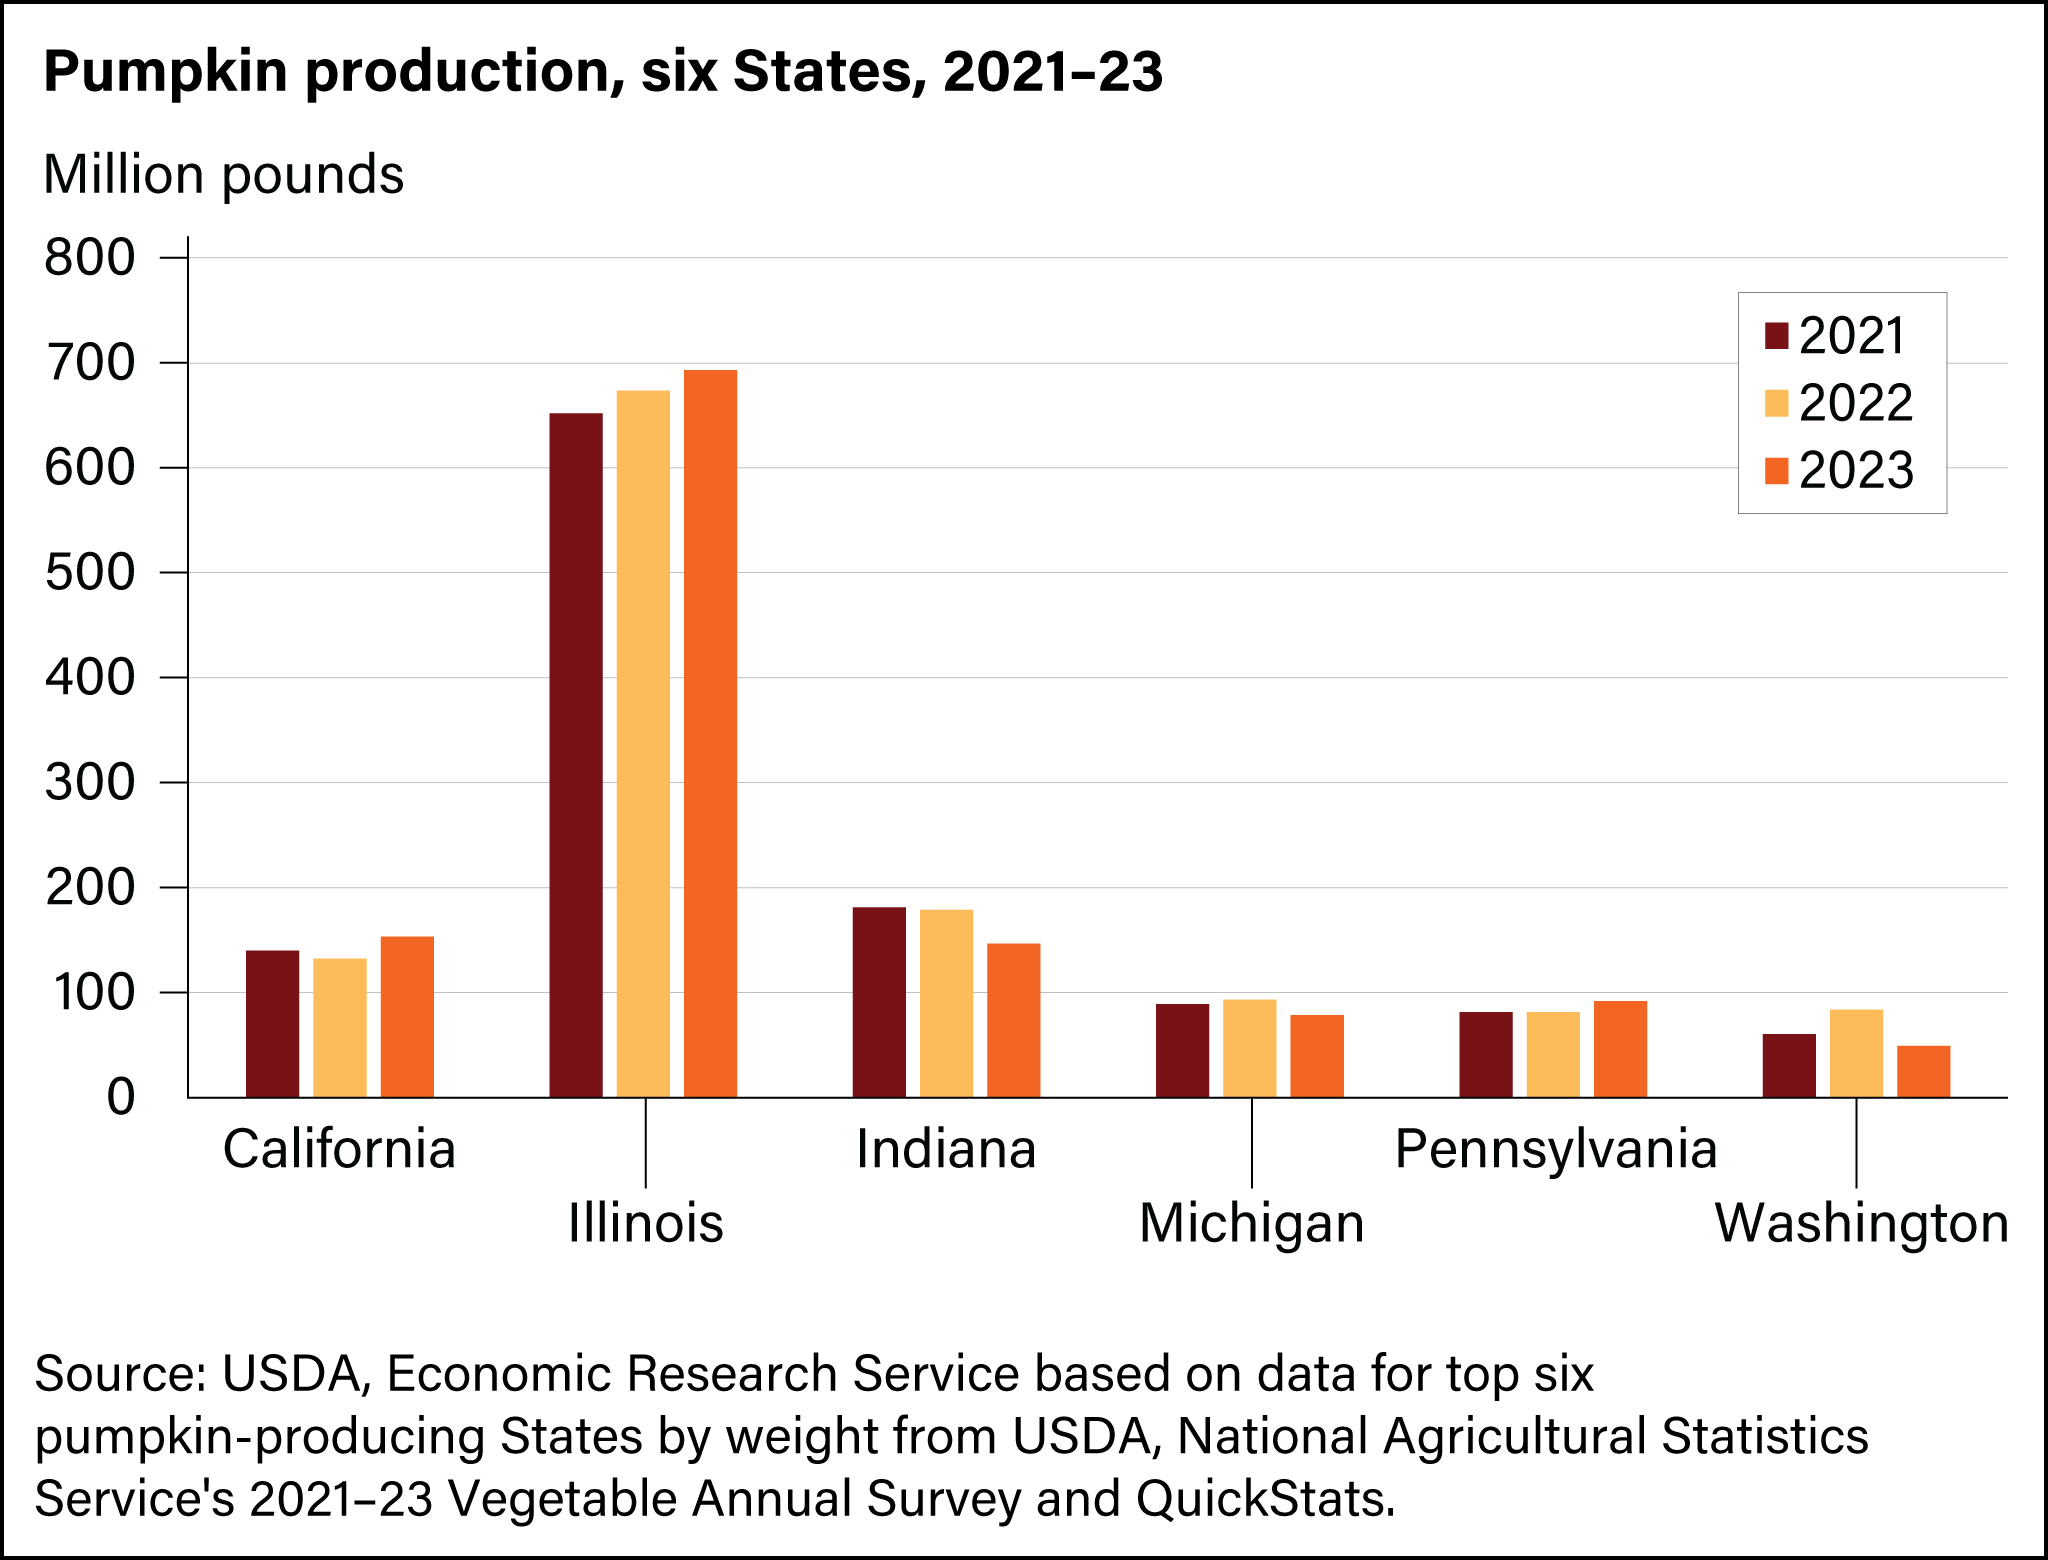
In 2023, farmers in the top six pumpkin-producing States harvested more than 1.2 billion pounds of pumpkins combined. Leading in pumpkin acreage harvested and yield, Illinois produced about 690 million pounds in 2023, more than the other 5 most productive States combined. California and Indiana each produced about 150 million pounds—while Pennsylvania produced about 90 million pounds and Michigan produced about 80 million pounds. Washington’s production dropped 42 percent from 2022 to 2023, falling to about 50 million pounds.
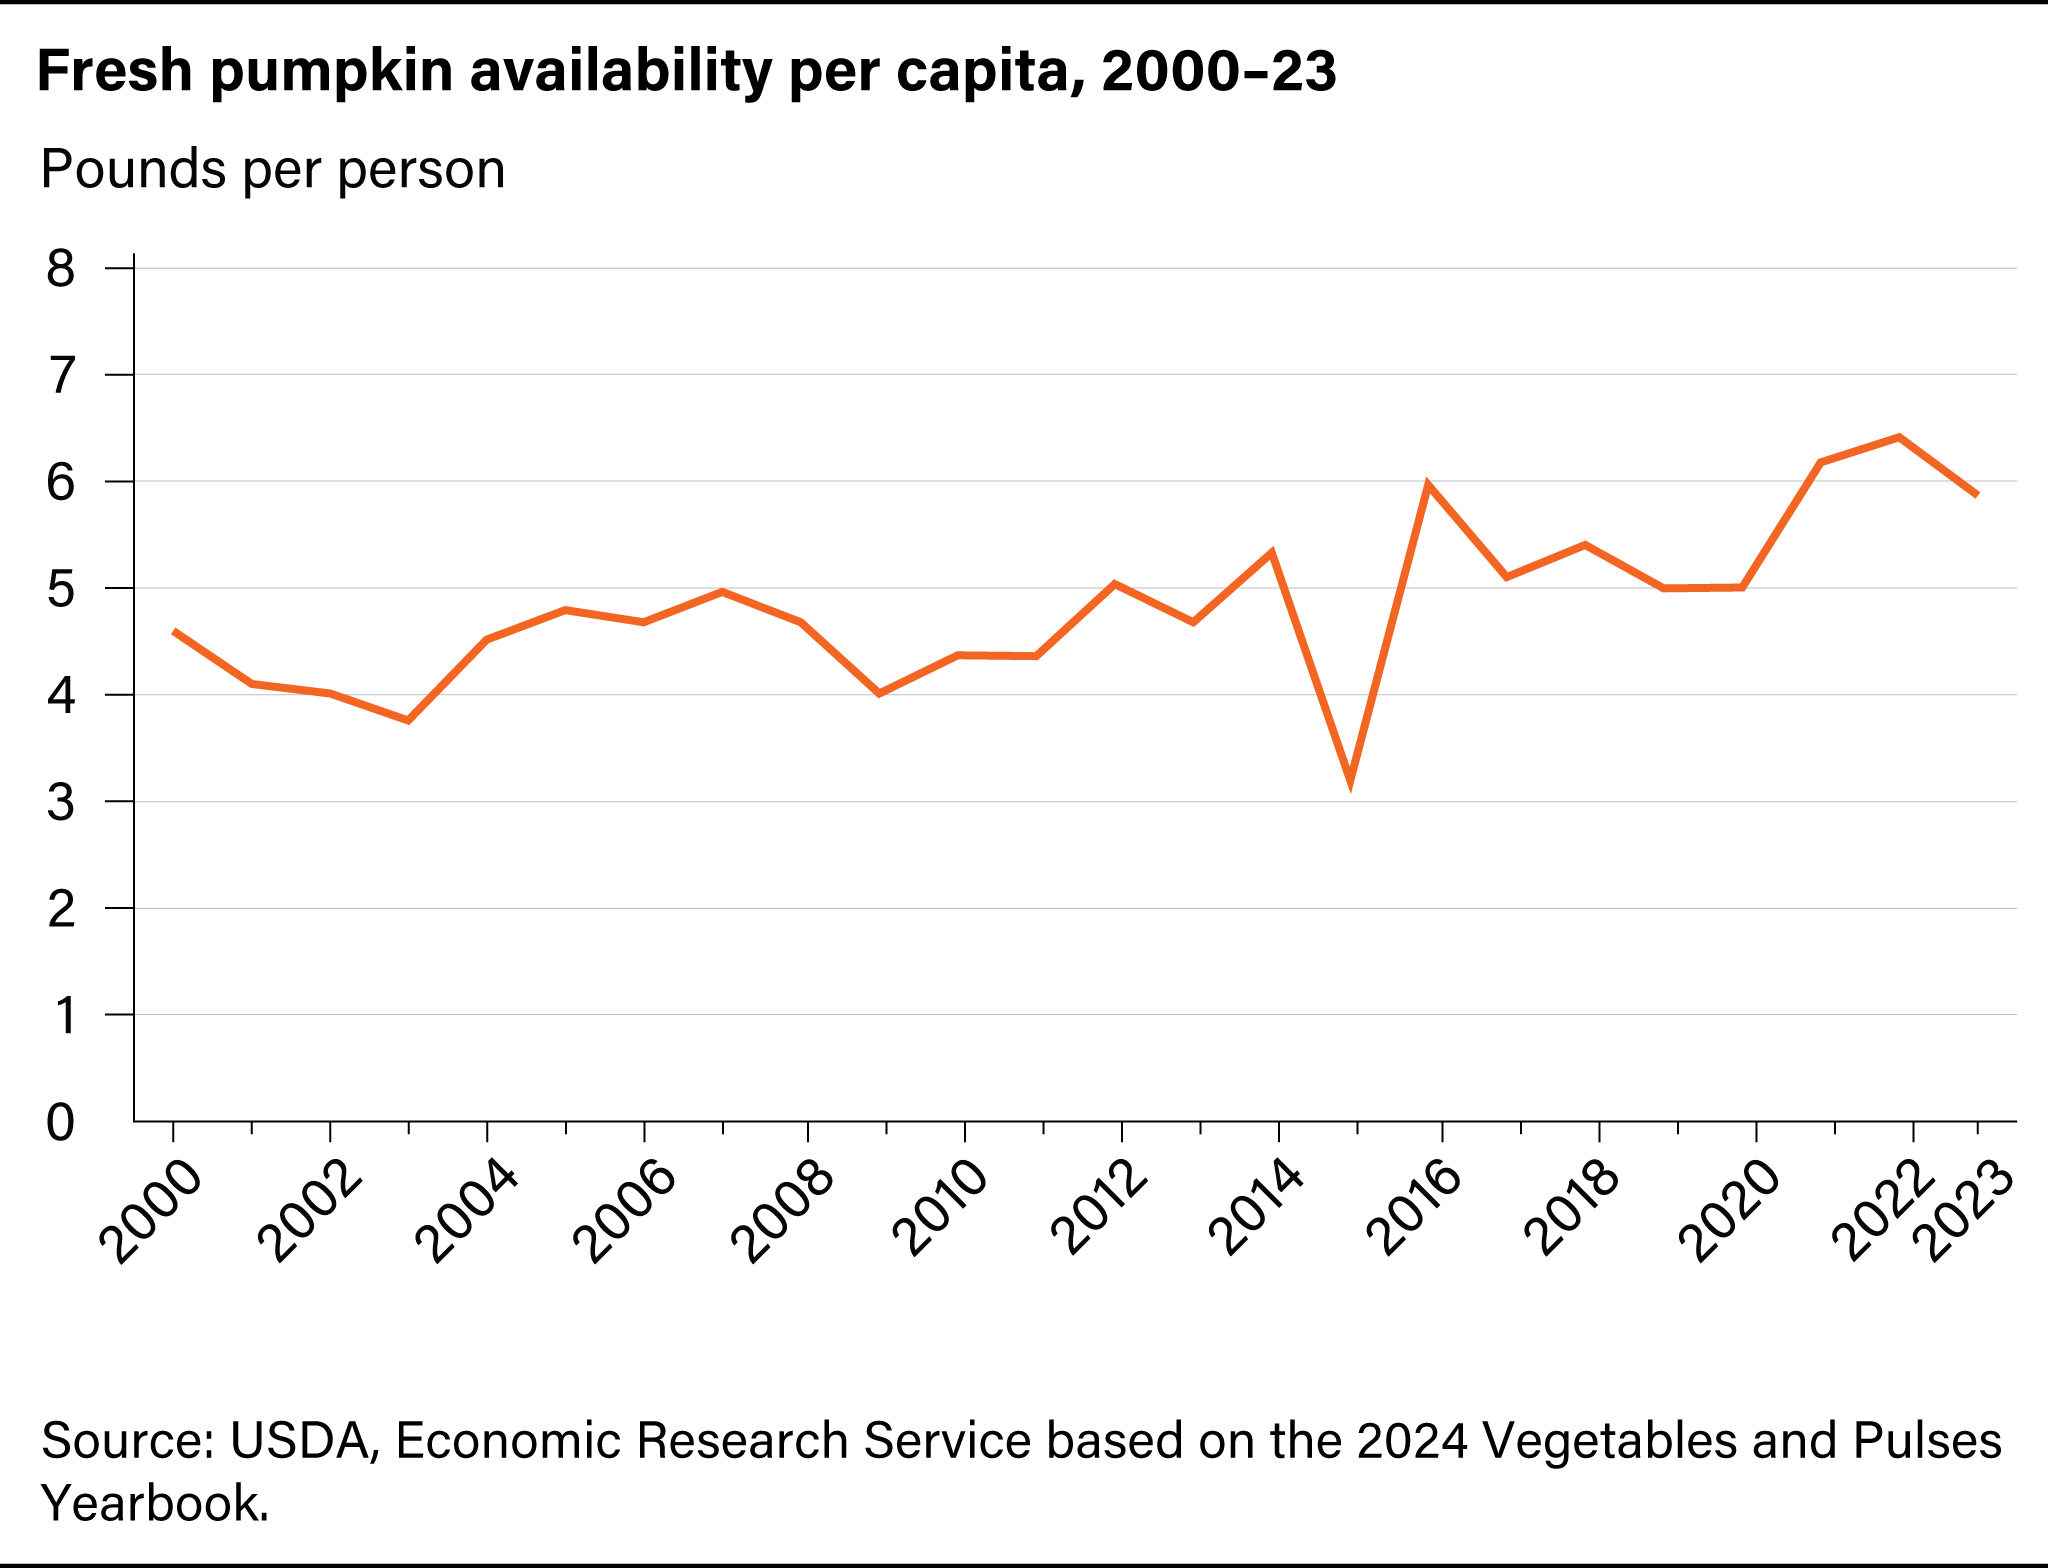
Annual U.S. per capita availability of fresh pumpkins averaged about 6 pounds over 2021 to 2023 and averaged about 4 pounds over 2000 to 2002. From 2000 to 2023, per capita availability of fresh pumpkins has generally trended upward. Reduced pumpkin availability in 2015 corresponded to a drop in domestic production, due in large part to the effects of poor weather on Illinois production. Availability rebounded in 2016 and was 5.9 pounds per person in 2023.
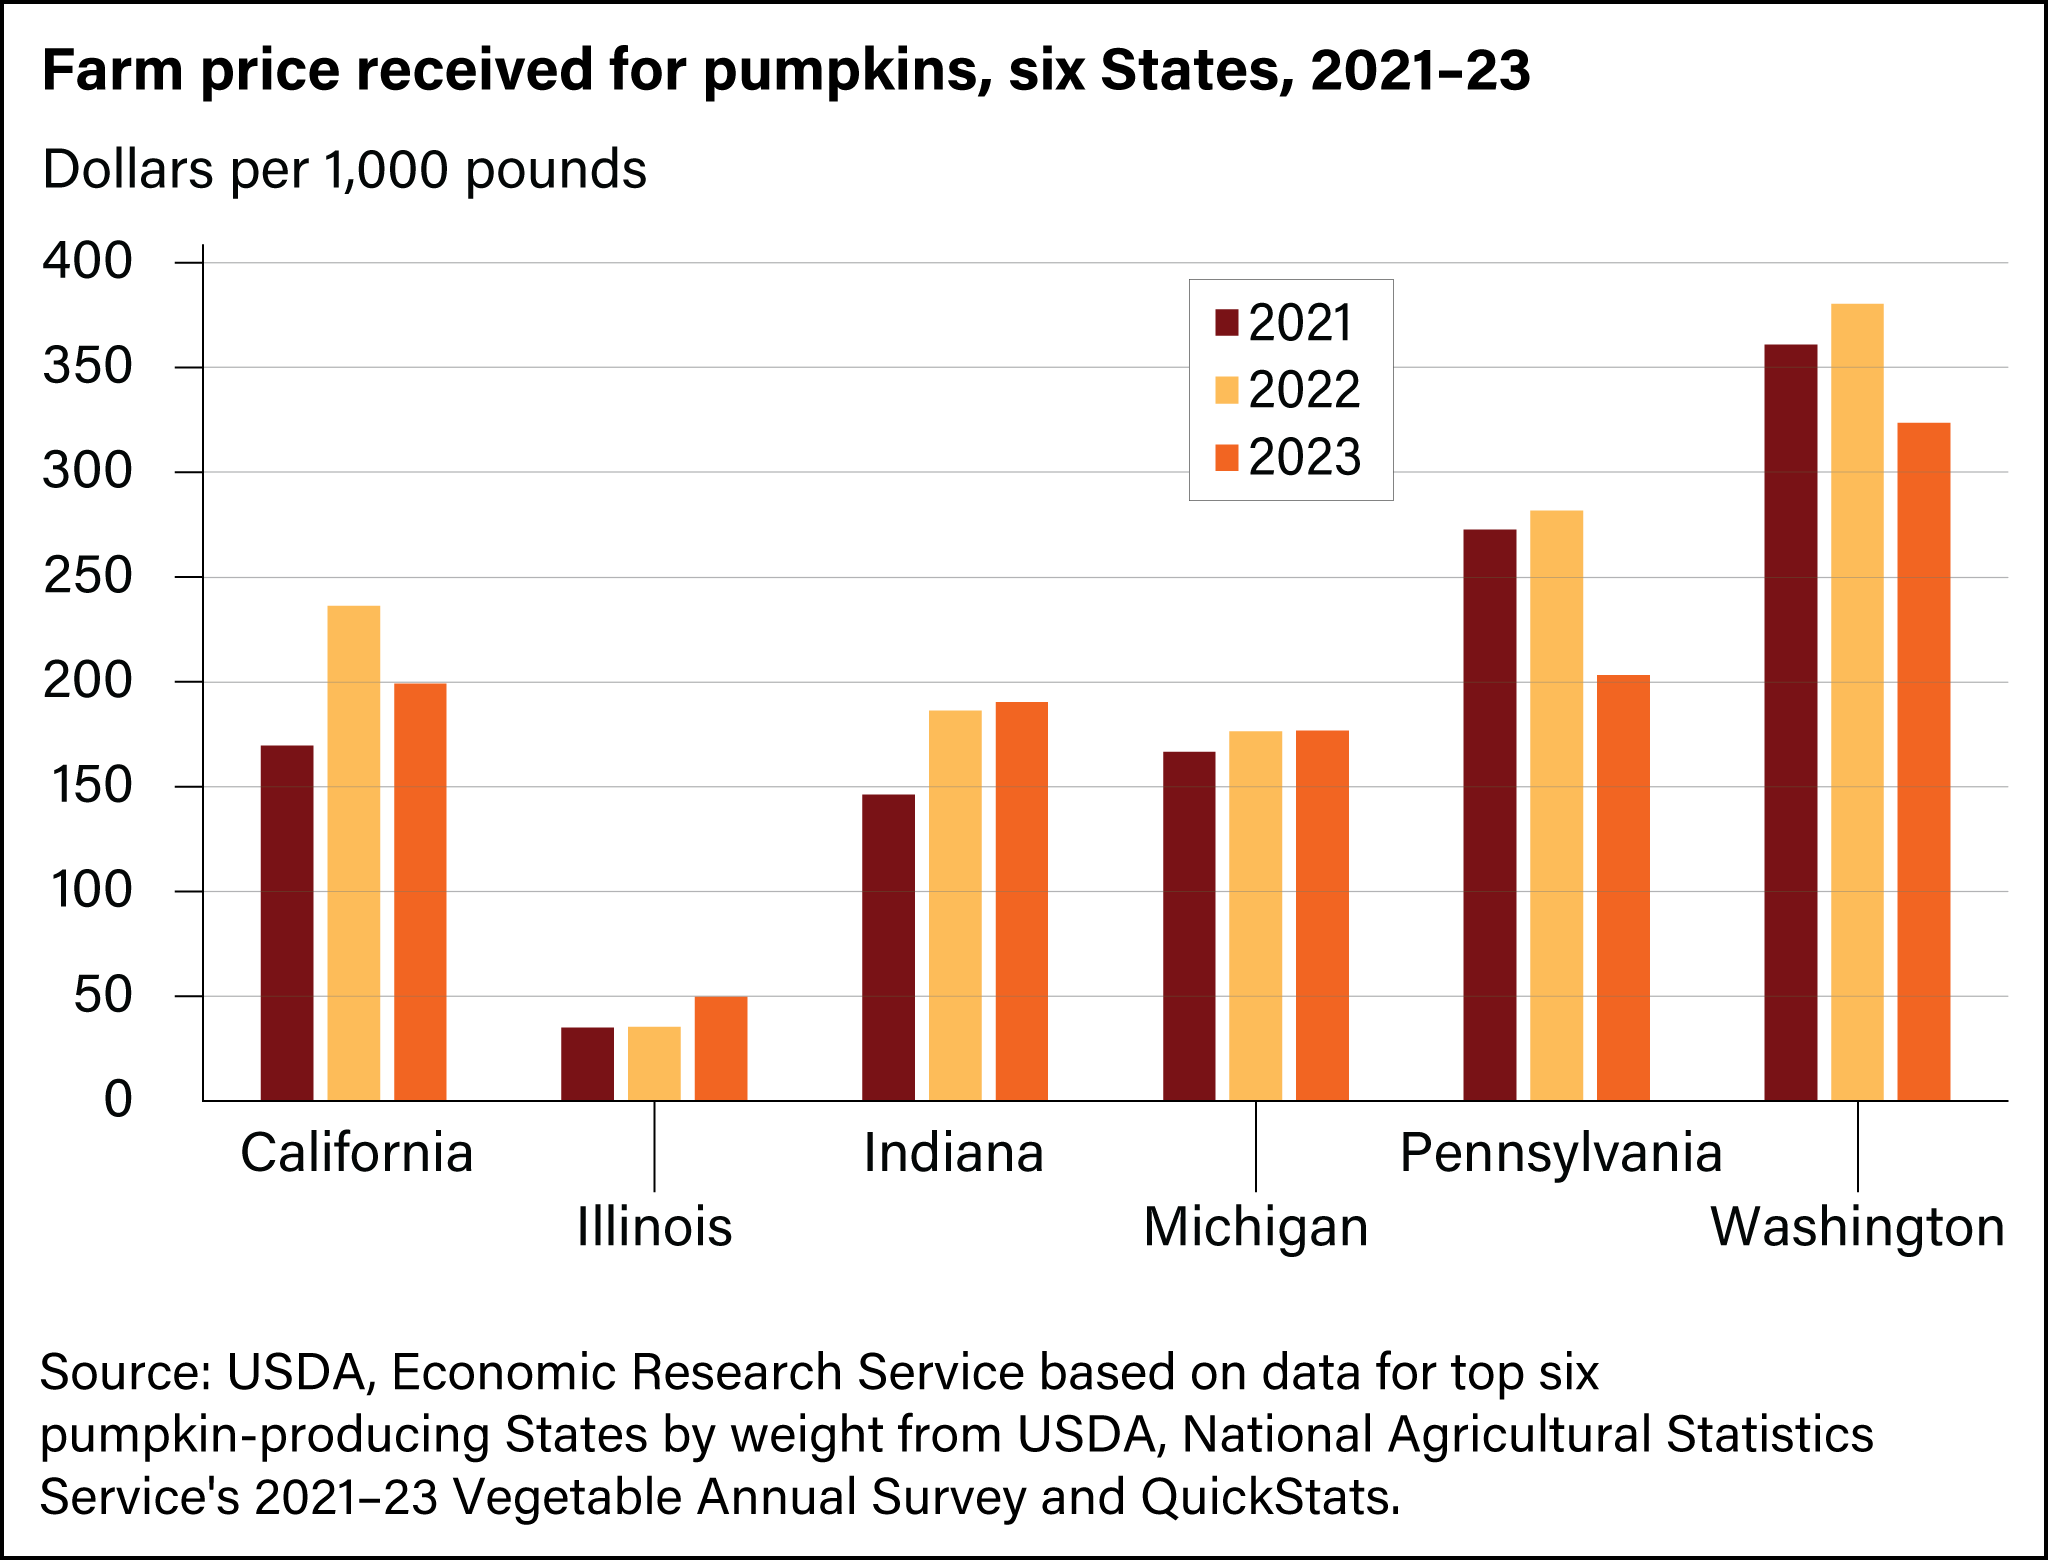
All States see year-to-year changes in the price of pumpkins received by growers. In 2023, among the six top producing States, Washington received the highest price for its pumpkins, at about $324 per 1,000 pounds. California, Indiana, Michigan, and Pennsylvania all received prices within $27 of each other, averaging about $192 per 1,000 pounds each in 2023. Illinois growers sell their pumpkins mainly for processing, and those types of pumpkins are priced lower than jack-o’-lantern pumpkins. This means that Illinois producers consistently received the lowest price at $50 per 1,000 pounds of pumpkins in 2023.
Total pumpkin production value of the top six producing States increased 7 percent from $132 million in 2021 to $141 million in 2023. For three States—California, Illinois, and Indiana—the value of production has increased from 2021 to 2023. Illinois produced the most pumpkins by value in 2023 at $34 million, California was second at $30 million, and Indiana was third at $28 million. Pennsylvania produced $19 million, Washington produced $16 million, and Michigan produced $14 million.

Pumpkin supplies from most States are targeted toward the seasonal fresh market for ornamental uses and home processing. Pie varieties are predominantly sold in the processing market, although some are sold to consumers in retail outlets. Growers mainly produce jack-o'-lantern type pumpkins (Howden), but demand for specialty pumpkins—like White Howden, Fairytale, or Heirloom—continues to expand as consumers look for new and interesting varieties. In the weeks leading up to Halloween of 2024, average wholesale pumpkin prices ranged from $157.50 per 36-inch bin for Howden pumpkins, to $212.50 per 24-inch bin for pie pumpkins, and up to $350.00 for specialty varieties like mixed heirloom pumpkins (Table 1). In the third week of October 2024, the average retail price per Howden pumpkin was $6.21 (Table 2).
| Week, 2024 | Pie | Howden | White Howden | Fairytale | Mixed Heirloom |
|---|---|---|---|---|---|
| Pumpkin Size | Large | Large | Extra Large | Jumbo | Extra Large |
| Bin Width | 24-inch | 36-inch | 24-inch | 24-inch | 24-inch |
| September, 1st Week | 175 | 157.5 | - | 220 | 350 |
| September, 2nd Week | 212.5 | 157.5 | 175 | 220 | 350 |
| September, 3rd Week | 212.5 | 157.5 | 175 | 220 | 350 |
| September, 4th Week | 212.5 | 157.5 | 175 | 220 | 350 |
| October, 1st Week | 212.5 | 157.5 | 175 | - | 350 |
| October, 2nd Week | 212.2 | 157.5 | 175 | - | 350 |
| October, 3rd Week | 212.2 | 157.5 | 175 | - | 350 |
| October, 4th Week | 171.7 | 157.5 | 175 | - | 350 |
| Note: Price is a weekly average of all quoted markets (excluding organic) for the listed type. Source: Market News, Terminal Market Report. USDA, Agricultural Marketing Service (AMS). |
|||||
| Week, 2024 | Average retail price |
|---|---|
| September, 1st Week | 5.78 |
| September, 2nd Week | 6.18 |
| September, 3rd Week | 4.93 |
| September, 4th Week | 5.62 |
| October, 1st Week | 4.68 |
| October, 2nd Week | 5.34 |
| October, 3rd Week | 6.21 |
| October, 4th Week | 5.51 |
Source: Market News, Retail Report. USDA, Agricultural Marketing Service (AMS).
* Wholesale and retail advertised pumpkin prices will be updated during the 2024 fall season as they become available.