

Documentation
2010 Frontier and Remote (FAR) Area Codes
Small population size and geographic remoteness bestow highly-cherished benefits for residents and visitors alike, but those same characteristics often create economic and social challenges. Job creation, population retention, and provision of services (such as groceries, health care, clothing, household appliances, and other consumer items) require increased efforts in very rural, remote communities, all things being equal. Recent research indicates that the demographic and economic penalties associated with small size and remoteness may be increasing. ERS has developed ZIP-code-level frontier and remote area (FAR) codes to aid research and policymaking. This version is based on 2010 Census population data and urban area boundaries. It updates the original ERS data product based on 2000 data. It includes four FAR level codes, based on different population thresholds that are meant to reflect likely access to high order services (level one), low order services (level four), and intermediate order services (levels two and three).
2010 Frontier and Remote Area Codes Maps
The maps below are also available in PDF format, which allows for zooming into an area for greater detail.

Data Sources and Methodology
FAR areas were defined and adjusted along two dimensions:
- A population size dimension: Frontier areas only include urban areas up to a certain size
- A distance dimension: rural areas and smaller urban areas will be counted as frontier only if they are located beyond defined bands of proximity (measured as vehicle travel time) to larger urban areas
Beyond these two choices, defining frontier and remote areas requires choosing among different geographic building blocks:
- What geographic units should be used to represent urban areas?
- At what geographic level should remoteness (distance to urban areas) be measured?
- How are results aggregated to larger, more useful geographic entities, once distance is measured and frontier areas defined?
What Geographic Units Should Be Used to Represent Urban Areas?
This study uses Census Bureau-defined Urban Areas (from the 2010 Census) to represent urban entities around which frontier areas will be identified. They are nationally-consistent, statistically-derived versions of the built-up areas of towns and cities, based strictly on population density and not on municipal boundaries.
Urban Areas (UAs) range in size from 2,500 up to 18.4 million people. Census defines rural areas as all territory outside UAs; 59 million people lived in rural areas in 2000—19 percent of U.S. population. In this analysis, FAR areas are defined in relation to the time it takes to travel by car to the edges of nearby UAs that are above the chosen population-size category.
At What Geographic Level Should Remoteness (Distance to Urban Areas) Be Measured?
Travel times to the edges of UAs were measured at the ½ x ½ kilometer grid level, using routing algorithms applied to a road network that included posted speed limits for all federal, state, county, and municipal roads. Population data from the 2010 Census was translated to the grid network from census blocks using areal interpolation.
Population Size Thresholds
For each of 32.4 million grid cells, travel times to nearby UAs were examined and up to four pieces of information retained—the travel time in minutes to the edge of the nearest UA with a population in the following size ranges: 2,500-10,000, 10,000-24,999, 25,000-49,999, and 50,000 or more. These data allow for the four different FAR levels to be defined, based on adjusting the population size thresholds.
Distance Thresholds Measured as Travel Time
A key methodological innovation allowed with this approach is the ability to apply longer travel-time bands around larger UAs. The qualifying travel time (beyond which areas are considered to be frontier and remote) should be longer around larger UAs, because people tend to travel farther and less frequently for high-order services. For every grid cell, we calculate travel times to nearby UAs in the four population-size groups listed above, thus we can apply longer travel-time bands to larger population-size groups:
| Urban size category | Travel time band for defining FAR area |
|---|---|
| 2,500-9,999 | 15 minutes |
| 10,000-24,999 | 30 minutes |
| 25,000-49,999 | 45 minutes |
| 50,000 or more | 60 minutes |
Criteria for Defining Four Frontier and Remote Area Levels
- Level 1—FAR areas consist of rural areas and urban areas up to 50,000 people that are 60 minutes or more from an urban area of 50,000 or more people.
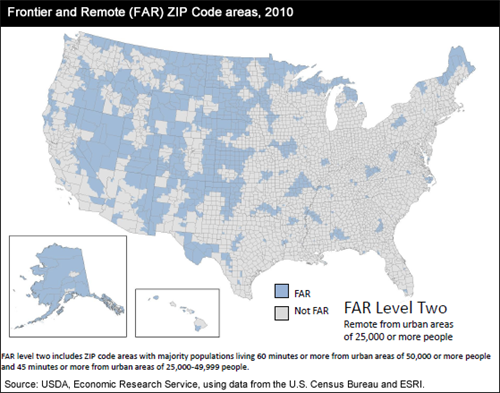
- Level 2—FAR areas consist of rural areas and urban areas up to 25,000 people that are: 45 minutes or more from an urban area of 25,000-49,999 people; and 60 minutes or more from an urban area of 50,000 or more people.
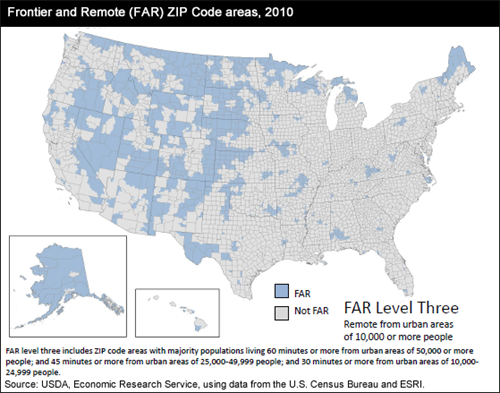
- Level 3—FAR areas consist of rural areas and urban areas up to 10,000 people that are: 30 minutes or more from an urban area of 10,000-24,999; 45 minutes or more from an urban area of 25,000-49,999 people; and 60 minutes or more from an urban area of 50,000 or more people.
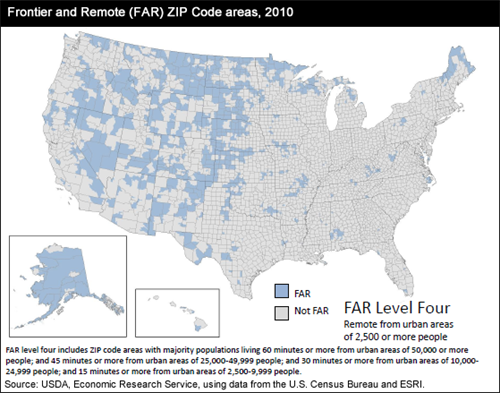
- Level 4—FAR areas consist of rural areas that are: 15 minutes or more from an urban area of 2,500-9,999 people; 30 minutes or more from an urban area of 10,000-24,999 people; 45 minutes or more from an urban area of 25,000-49,999 people; and 60 minutes or more from an urban area of 50,000 or more people.
How Are Results Aggregated to Larger, More Useful Geographic Entities?
Once frontier levels were delineated at the ½ x ½ kilometer grid-cell level, results were aggregated to ZIP code areas. For each ZIP code area, the percent of the population defined as frontier was calculated. Most ZIP code areas were either entirely frontier or entirely non-frontier for a given level. For those ZIP code areas containing a mix of frontier and non-frontier populations, classification was based on the status of the majority population.
U.S. and State-level Summaries
U.S. populations living in ZIP Code areas designated as frontier and remote ranged from 12.2 million for level one down to 2.3 million for level four in 2010. Five States (Connecticut, Delaware, New Jersey, Ohio and Rhode Island) and the District of Columbia contained no FAR territory. States with the highest shares of FAR populations were Wyoming, Montana, North Dakota, South Dakota, and Alaska.
Nationally, the share of land area classified as frontier and remote ranged from 52 percent for level 1 down to 35 percent for level 4. Alaska had the highest share of FAR land area at level 1 (97.9 percent), followed by Nevada, Wyoming, Montana, and South Dakota.
2000 Frontier and Remote (FAR) Area Codes
Originally released in June 2012, the 2000 FAR codes use the same methodology as the 2010 codes, using the 2000 Census Bureau UAs. They did not, however, have the level of detail in road networks to estimate travel time, and were not done for Alaska and Hawaii.