

Documentation and Maps
Note: Updates to this data product are discontinued.
Table of Contents
- Background
- Scope
- Data File Structure and Variable Descriptions
- Charts and Maps of Data Highlights
- Data Sources
- Comparison to State Totals from the Energy Information Agency
- Updates and Revision History
- Errata
Background
For many years, geologists knew that large quantities of oil and gas were trapped in shale and other lower-permeability formations around the United States. But drilling technology did not permit profitable extraction until the 1990s and early 2000s, when drilling companies combined and refined hydraulic fracturing ("fracking") and horizontal drilling methods. Hydraulic fracturing—shooting a mixture of water, chemical, and sand into underground rock formations at high pressure—frees trapped oil and gas to flow to the surface. Drilling wells horizontally lowers costs by allowing companies to access more oil and gas with one well bore.
Prior to the application of unconventional drilling methods, U.S. natural gas production had been growing slowly, and U.S. oil production had been in decline since the mid-1980s. Both trends reversed during the 2000s.
Most policies regarding oil and gas development occur at the State level, and most States with oil or gas production have a government agency that manages information on oil and gas wells. Using data from State agencies, the Energy Information Administration (EIA) publishes oil and gas production totals by State, but more local data for the entire United States had not been widely available.
By acquiring disaggregated oil and gas production data from State agencies, ERS researchers have created a national county-level database providing yearly estimates of onshore production for counties in the lower 48 States. Some States had published county-level production statistics available to draw from. In other States, researchers acquired well-level databases which were then aggregated to the county level by year. Nationwide county-level data permit a more comprehensive assessment of the geography of oil and gas development. These county-level data also allow researchers to assess changes in rural production over the past decade.
Scope
State oil and gas production statistics were used to create a database of annual county-level production for 2000 through 2011. Data are available for onshore production in the lower 48 States only. Raw data for natural gas is for gross withdrawals, and oil data include natural gas liquids except for Colorado where the State reported them as natural gas withdrawals. Note that State-reported natural gas withdrawals were not available for Illinois or Indiana; these estimates were produced using geocoded wells and State total production reported by the EIA.
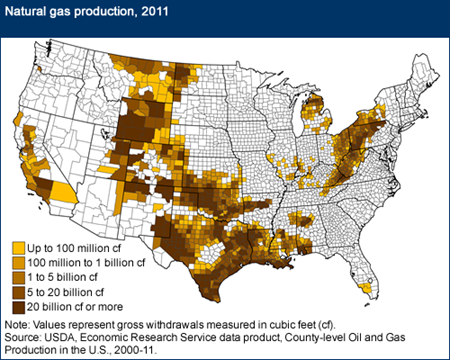
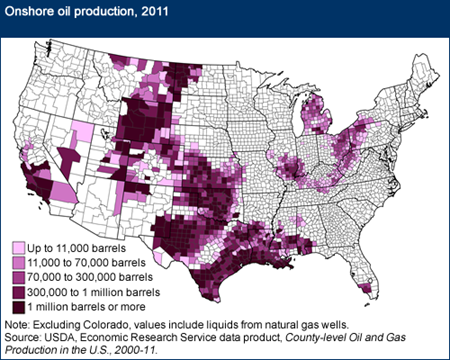
Using this method, 920 counties in 31 States are identified with some natural gas production occurring (in 2011), and 980 counties in 30 States are identified with some onshore oil production (in 2011), see the maps below.
Counties with increases or decreases in excess of $20 million in oil and/or natural gas production during 2000-11 are also identified. To convert amounts to values, ERS researchers took annual national prices for oil (EIA first-purchase price) and gas (EIA wellhead price) for 2000 and 2011, converted them to 2011 dollars, and then took the average over the period. This method yields a natural gas price of $5.80 per 1,000 cubic foot (Mcf) and an oil price of $57.90 per barrel, which is then applied to the county-level change in production over the 2000-11 period. Counties with $20 million or more gain/decline in the value of production are thus identified.
Data File Structure and Variable Descriptions
Data are provided in two file types (Excel and csv) with identical formats, detailed below. Each row represents a county observation with the following variables (variable names are included at the top of the file):
FIPS—Five-digit Federal Information Processing Standard (FIPS) code (numeric)
geoid—FIPS code with leading zero (string)
Stabr—State abbreviation (string)
County_Name—County name (string)
Rural_Urban_Continuum_Code_2013—Rural-urban Continuum Code, 2013
Urban_Influence_2013—Urban Influence Code, 2013
Metro_Nonmetro_2013—Metro-nonmetro 2013 (0=nonmetro, 1=metro)
Metro_Micro_Noncore_2013—Metro-Micro-Noncore indicator 2013 (0=nonmetro noncore, 1=nonmetro micropolitan, 2=metropolitan)
oil2000, oil2001, ..., oil2011—Annual gross withdrawals (barrels) of crude oil, for the year specified in the variable name (2000 through 2011)
gas2000, gas2001, ..., gas2011—Annual gross withdrawals (1,000 cubic feet) of natural gas, for the year specified in the variable name (2000 through 2011)
oil_change_group—Categorical variable based upon change in the dollar value of oil production, 2000-11. Values are H_Growth (>=$20 million), H_Decline (<=-$20 million), Status Quo (change between +/- $20 million)
gas_change_group—Categorical variable based upon change in the dollar value of natural gas production, 2000-11. Values are H_Growth (>=$20 million), H_Decline (<=-$20 million), Status Quo (change between +/- $20 million)
oil_gas_change_group—Categorical variable based on the change in the dollar value of the sum of oil and natural gas production, 2000-11. Values are H_Growth (>=$20 million), H_Decline (<=-$20 million), Status Quo (change between +/- $20 million)
Charts and Maps of Data Highlights
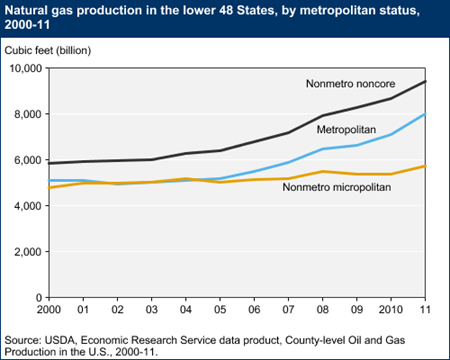
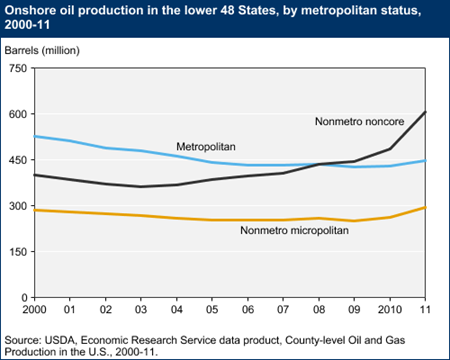
From 2000 to 2011, onshore gross withdrawals of natural gas in the lower 48 States increased by about 47 percent, reaching historic highs in every year after 2006. Over the same period, withdrawals of oil increased by 11 percent, with much of that growth occurring between 2007 and 2011. Rural counties (nonmetro noncore) accounted for almost all of the growth in oil production and a large share of the growth in gas production. For natural gas, several metropolitan areas—notably the Fort Worth area in Texas—also contributed to the growth in production. County-level indicators of the degree of rurality are included in the data file.
Researchers calculated the change in oil and gas production from 2000 to 2011, and valued the change using national prices averaged over the period using the first-purchase price for oil and the wellhead price for natural gas. This allowed approximation of the combined dollar value change in oil and gas production for each county. Notably, over 2000-11, the number of counties with an increase of $20 million or more (218 counties) was nearly the same as the number (212) with a decrease of $20 million or more. To put the dollar value in context, at typical rates, $20 million in production would generate roughly $3 million in royalty income for the owners of oil/gas rights and $1 million in State severance tax revenue.
_450px.png?v=1808.8)
Data Sources
By acquiring disaggregated oil and gas production data from State agencies, researchers created a county-level database covering onshore production in the lower 48 States. Some States had published county-level production statistics. In other States, researchers acquired well-level databases, which were then aggregated to the county level by year. In the case of Illinois and Indiana, estimates were produced by allocating each State’s total production, as reported by the EIA, among geocoded wells and then aggregating to the county-level.
Detailed, State-by-State information on data sources and data set construction is not presented here, but is readily available from the authors.
Comparison to State Totals from the Energy Information Agency
EIA publishes onshore oil and gas production totals by State. State totals calculated by aggregating counties will generally not equal the totals published by EIA, although they are close for most States, most of the time. What State agencies report to the EIA and what they report on their websites may differ because of timing. Changes in EIA methodology for creating State totals are another potential source of differences.
Updates and Revision History
Currently, an ERS update to this data product is not planned. Note that as of April 2014, however, 2011 oil/gas production data for Kentucky and Virginia (which had been approximated using 2010 data) are available.
Errata
On April 4, 2014, the 2010 and 2011 oil and gas production for three Pennsylvania counties (Crawford, Erie, and Mercer) were changed to correct a coding error.