ERS Charts of Note
Subscribe to get highlights from our current and past research, Monday through Friday, or see our privacy policy.
Get the latest charts via email, or on our mobile app for  and
and 
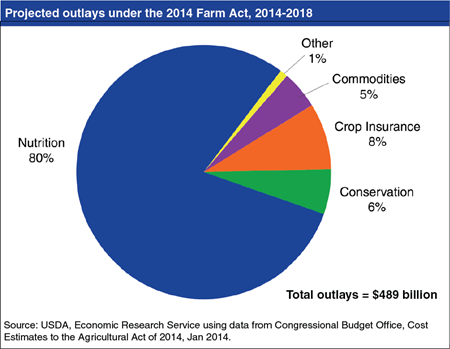
Nutrition programs projected to account for 80 percent of outlays under the Agricultural Act of 2014
Wednesday, March 12, 2014
The new U.S. farm bill, the Agricultural Act of 2014, was signed on February 7, 2014 and will remain in force through 2018. The 2014 Act makes major changes in commodity programs, adds new crop insurance options, streamlines conservation programs, modifies provisions of the Supplemental Nutrition Assistance Program (SNAP), and expands programs for specialty crops, organic farmers, bioenergy, rural development, and beginning farmers and ranchers. The Congressional Budget Office (CBO) projects that 80 percent of outlays under the 2014 Farm Act will fund nutrition programs, 8 percent will fund crop insurance programs, 6 percent will fund conservation programs, 5 percent will fund commodity programs, and the remaining 1 percent will fund all other programs, including trade, credit, rural development, research and extension, forestry, energy, horticulture, and miscellaneous programs. Find this chart and additional information on the new U.S. farm bill on the Farm Bill Resources pages.
Thursday, October 31, 2013
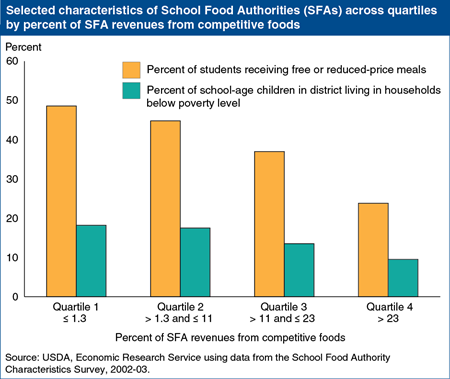
Beginning with the 2014-15 school year, competitive foods in U.S. schools—foods in cafeteria à la carte lines, vending machines, school stores, and other locations—will be subject to new nutrition standards aimed at creating a healthier nutrition environment. Concerns have been raised that the new standards may reduce revenues from competitive foods and hurt less affluent schools. ERS analysis of the 2002-03 School Food Authority Characteristics Survey found that revenues from competitive foods were highly skewed. School Food Authorities (SFAs), the foodservice management units for school districts, reported obtaining an average of 12 percent of their revenues from competitive foods. While 10 percent of SFAs received 36 percent or more of their revenues from competitive foods, revenue shares were smaller than average for the majority (54 percent) of SFAs. When separated into quartiles based on competitive foods’ share of total revenues, SFAs with higher shares were typically located in more affluent districts and served fewer low-income students receiving free and reduced-price meals than did schools with low competitive food revenues. This chart appears in “Eating Better at School: Can New Policies Improve Children’s Food Choices?” in the September 2013 Amber Waves.
Tuesday, September 17, 2013
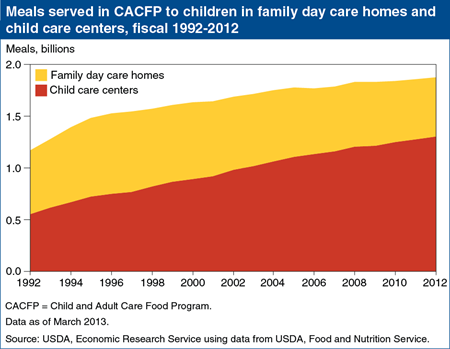
In fiscal 2012, on a typical day, USDA’s Child and Adult Care Food Program (CACFP) provided meals and snacks to more than 3.4 million children at family day care homes and nonprofit child care centers, homeless shelters, and after-school programs. The program also provided subsidized meals for 118,530 older or functionally impaired adults at adult day care centers. The total cost to USDA for CACFP in fiscal 2012 was $2.8 billion—96 percent of which covered children’s meals and snacks. Since 1992, the average number of meals served annually to children in family day care homes and child care centers has risen from 1.2 to 1.9 billion. In 2012, 70 percent of meals were served in centers, reflecting growing numbers of children attending child care centers and fewer family day care homes participating in CACFP. In 1996, reimbursements from USDA to family day care homes shifted from a single rate to a two-tiered system with higher reimbursements for homes serving primarily low-income children. Eligible centers continued to be reimbursed by USDA on a sliding scale based on the child’s family’s income. This chart is from the Child Nutrition Programs: Child and Adult Care Food Program topic page on the ERS website.
Wednesday, September 11, 2013
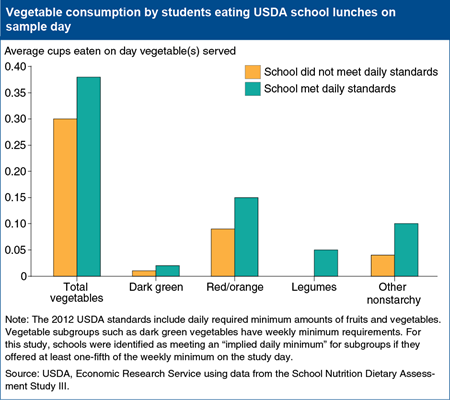
America’s schools are entering their second year of meeting new nutrition standards for USDA school lunches that feature whole grains, low-fat milk, more fruit, and a healthier mix of vegetables. To explore the question of whether children who are offered more fruits and vegetables will actually eat them, ERS researchers used a nationally representative survey of 242 schools in 2005 to match food intake data to that day’s lunch menus. After controlling for a number of student and school foodservice characteristics, serving more fruits and a healthier mix of vegetables did increase students’ vegetable consumption, although average amounts consumed were still small. For example, in schools that offered more total vegetables, students ate 0.38 cups of them at lunch on average versus the 0.30 cups eaten by students in schools that did not meet the total vegetables standard. Available alternatives mattered—students at schools that had no à la carte options, or only healthy à la carte options, had higher intakes of dark green vegetables. This chart appears in “Eating Better at School: Can New Policies Improve Children’s Food Choices?” in the September 2013 Amber Waves.
Wednesday, July 31, 2013
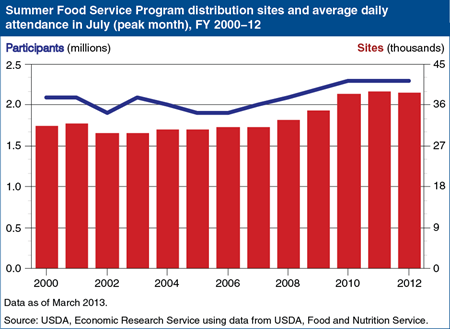
USDA’s Summer Food Service Program provides nutritious meals and snacks to children in low-income areas during the summer months (and during other long vacation periods for schools on year-round schedules). USDA reimburses schools, local governmental agencies, camps, private nonprofit organizations, and other sponsors for meals and snacks served to children at eligible sites. The program served 144 million meals and snacks at a cost to USDA of $398 million in fiscal year 2012, primarily during summer vacation. After rising in 2008 and 2009, the number of sites offering summer meals to children has been fairly steady at around 39,000 sites since 2010, and participation has remained at around 2.3 million children. This chart is from the Child Nutrition Programs: Summer Food Service Program topic page on the ERS website, updated July 26, 2013.
Thursday, May 30, 2013
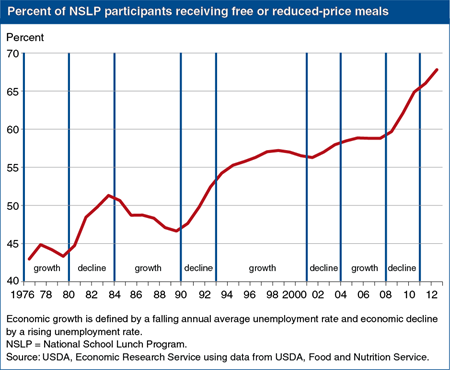
USDA’s National School Lunch Program (NSLP) is the Nation’s second largest food and nutrition assistance program. In fiscal year 2012, expenditures totaled $11.6 billion and an average 31.6 million children participated in the program on a typical school day. While total participation is closely linked to school enrollment and does not vary with economic conditions, the share of children receiving free or reduced-price lunches rises during economic downturns. During the Great Recession (December 2007 to June 2009) and continuing through 2010, the share of NSLP participants receiving free or reduced-price meals grew from 59 to 65 percent. Preliminary data for fiscal years 2011 and 2012 show that this share continued to rise even after the unemployment rate started to decline, suggesting that economic conditions did not improve enough to raise people out of poverty and the need for assistance remained high. This chart appears in the May 2013 Amber Waves article, “Economic Conditions Affect the Share of Children Receiving Free or Reduced-Price School Lunches.”
Friday, July 27, 2012
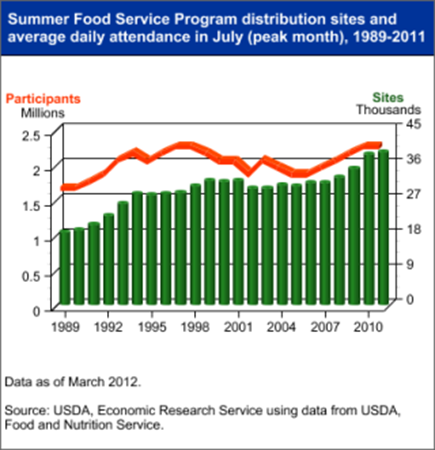
The Summer Food Service Program is one of five major domestic food assistance programs administered by USDA that exclusively or primarily serve the nutritional needs of children. The program served 137 million meals and snacks at a cost to USDA of $373 million in fiscal year 2011, primarily during summer vacation. The number of sites offering summer meals to children grew from 38,471 in 2010 to 39,063 in 2011, while participation remained steady at 2.3 million children after rising in each of the last four years. This chart is from the Child Nutrition Programs: Summer Food Service Program topic page on the ERS website, updated July 11, 2012.
Thursday, March 29, 2012
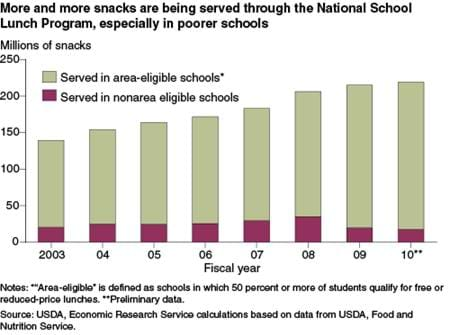
In fiscal year 2010, 219 million after-school snacks were served to children through USDA's National School Lunch Program (NSLP), up from 139 million in 2003. Schools that participate in the NSLP can choose to offer nutritious snacks as part of after-school care programs that provide educational or enrichment activities. Over 90 percent of the 2010 snacks were served in schools with high percentages of low-income students. Snacks provided to students who qualify for free school meals receive a 76-cent subsidy for the 2011-12 school year, versus subsidies of 38 cents and 7 cents, respectively, for snacks provided to students qualifying for reduced-price and full-price school meals. Schools in which at least 50 percent of students qualify for free or reduced-price meals are "area eligible" and receive the 76-cent subsidy for all participating students. This chart appeared in "Feeding Children After School: The Expanding Role of USDA Child Nutrition Programs" in the March 2012 issue of ERS's Amber Waves magazine.
Friday, December 23, 2011
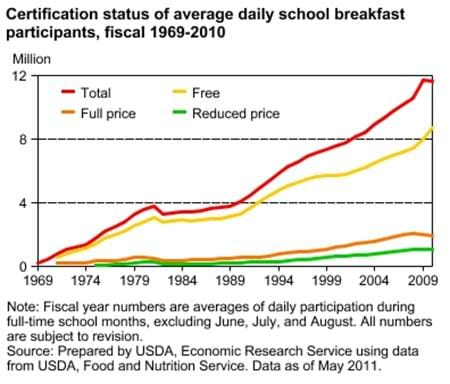
In fiscal year 2010, 11.6 million students participated in USDA's School Breakfast Program, up 5 percent from fiscal year 2009. The program subsidizes breakfasts in participating schools, which must offer nutritious meals to any student at full price, and for free or at reduced prices to income-eligible students. Participation trends in the School Breakfast Program over the last few years echo those of USDA's National School Lunch Program. The number of children receiving full price breakfasts has fallen, while the number of children getting free breakfasts has increased. Of the 1.9 billion breakfasts served in fiscal year 2010, 75 percent were free and another 9 percent were provided at a reduced price. This chart appearred on the Child Nutrition Programs: School Breakfast Program topic on the ERS website.
Tuesday, June 21, 2011
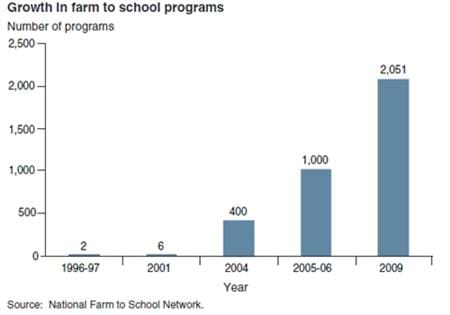
Farm to school programs have grown rapidly over the last decade. The National Farm to School Network, a collaboration of groups supporting farm to school programs, estimated that there were 2,051 farm to school programs in the United States in 2009; twice as many as in 2005-06. As of August 2009, they estimated that 41 States had some kind of farm to school program, and 8,943 schools in 2,065 districts participated. This chart was originally published in Local Food Systems: Concepts, Impact, and Issues, ERR-97, May 2010.


