ERS Charts of Note
Subscribe to get highlights from our current and past research, Monday through Friday, or see our privacy policy.
Get the latest charts via email, or on our mobile app for  and
and 
Monday, January 23, 2012
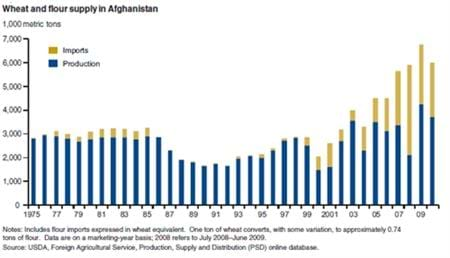
Wheat is Afghanistan's key staple food and its major crop. Given expected increases in demand, imports are likely to grow in coming years even if Afghanistan's rapid post-1990 production growth is sustained, suggesting growing dependence on supplies from Pakistan and other countries. This chart may be found in the ERS report, Long-Term Growth Prospects for Wheat Production in Afghanistan, WHS-11L-01, published January 2012.
Thursday, December 22, 2011
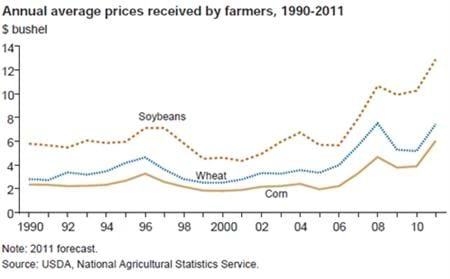
Very large gains in annual receipts are expected for wheat, corn, hay, and cotton in 2011, often reflecting prices that are forecast to exceed their previous records. The U.S. annual wheat price is expected to increase to $7.43 per bushel, a 44 percent increase from 2010 and 8 cents-per-bushel below its 2008 average, reflecting a large increase in wheat exports. The U.S. annual corn price is expected to increase from $3.89 per bushel to $6.04, a large increase over its earlier high of $4.66 in 2008, as corn continues to respond to the increased demand for ethanol. The U.S. annual soybean price is expected to increase from $10.24 per bushel to $12.89 ($10.65 per bushel in 2008) and soybean meal to $339.60 per ton. This chart may be found in Agricultural Income and Finance Outlook, AIS-91, December 2011.
Friday, September 16, 2011
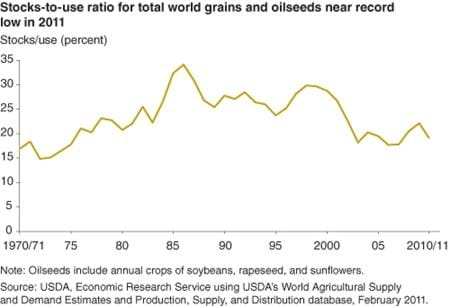
The ratio of global ending stocks to total use can be a reliable indicator of market prices (the lower the ratio, the tighter the market and the higher the price.) Currently, the stocks-to-use ratios for corn and soybeans are near record lows. The stocks-to-use ratios for wheat and rice suggest reasonably comfortable stock levels, but the shortage of milling-quality wheat has put strong upward pressure on wheat prices. Stock-to-use ratios for cotton, total oilseeds, total coarse grains, and sugar are also low. These low ratios suggest strong worldwide competition among crops for acreage in the 2011 planting season. This chart is found in the September 2011 Amber Waves feature, Why Another Food Commodity Price Spike?
Friday, June 17, 2011
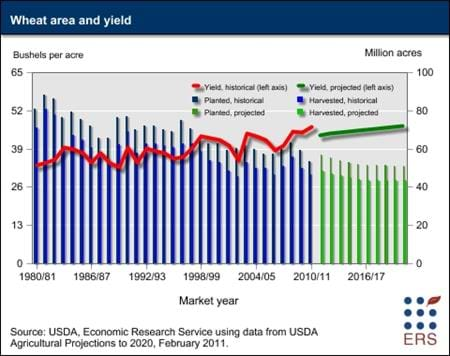
The United States is a major wheat-producing country, with output exceeded only by China, the European Union (EU-27), and India. Nationally, wheat ranks third among field crops in both planted acreage and value of production, behind corn and soybeans. Nonetheless, while varying widely during the past half-century, U.S. wheat area has been trending downward after peaking in the early 1980s, and is expected to do so for the foreseeable future. Past annual fluctuations in wheat area can be explained by changes in the Government's farm program, declining consumer demand for wheat products, and more recently, the relative profitability of growing competing crops. Several long-term factors play important roles in the projected downward trend of the U.S. wheat crop area for the remainder of this decade. The profitability of growing wheat relative to other crops, particularly corn and soybeans, is expected to continue declining. Two factors facilitating the planting of alternative crops, such as corn and sorghum, are the increased use of reduced-tillage and continuing genetic improvements, both of which improve yields of these alternative crops. Furthermore, wheat production in the Ukraine, Russia, and Kazakhstan is expected to continue increasing, competing with the U.S. in global markets. This graphic is from the Wheat briefing room, April 2011.
Monday, March 7, 2011
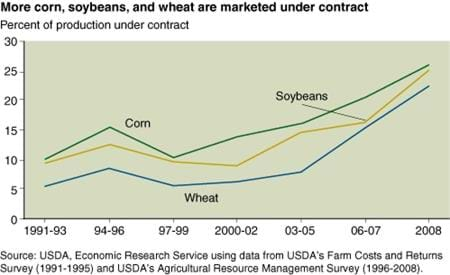
Most U.S. corn, soybean, and wheat production is sold through cash markets, where the producer receives the market price prevailing at the time of sale. However, marketing contracts, which set a market outlet and a pricing arrangement for crops before they are harvested, are becoming increasingly important as risk management tools. Marketing contracts covered 15 percent of corn production in 2001, along with 9 percent of soybean and 6 percent of wheat production. By 2008, contracts covered 26 percent of corn, 25 percent of soybean, and 23 percent of wheat production. This chart originally appeared in the March 2011 issue of Amber Waves. It is based on the ERS publication, Agricultural Contracting Update: Contracts in 2008, EIB-72, February 2011.
Wednesday, October 17, 2018
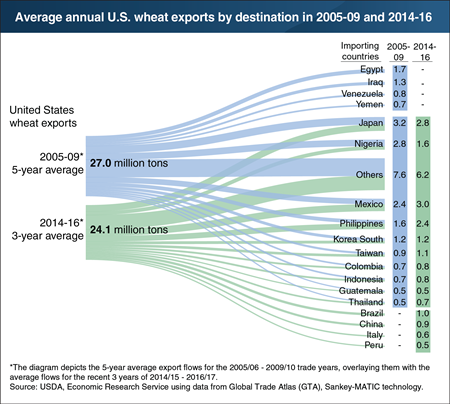
While the United States remains a major global supplier of wheat, it has struggled to attract new markets and has seen its export totals decline over the last decade. In 2014-16, annual U.S. wheat exports averaged nearly 3 million bushels less than in 2005-09, according to an ERS analysis. U.S. wheat exports have decreased as Russia, Ukraine, and the European Union (EU) have gained market share in several key U.S. markets. Although the United States has retained and even increased its wheat exports to some of its markets, such as Mexico and the Philippines, export volumes to several other markets have contracted. In one striking example, Egypt, one of the world’s top wheat importers, formerly purchased the bulk of its wheat from the United States but now receives most of its imports from Russia, Ukraine, and the EU. A similar shift is happening with Nigeria and Yemen. Much of the growth in U.S-displacing wheat exports from Russia and Ukraine is in low-quality milling wheat (for food consumption) and feed grain. This chart appears in the October 2018 Amber Waves article, “Major Changes in Export Flows Over the Last Decade Show the U.S. Is Losing Market Share in Global Grain Trade.”


